Paper Menu >>
Journal Menu >>
 International Journal of Geosciences, 2011, 2, 406-413 doi:10.4236/ijg.2011.24044 Published Online November 2011 (http://www.SciRP.org/journal/ijg) Copyright © 2011 SciRes. IJG A Ground Penetrating Radar and Electrical Resistivity Tomography Prospection for Detecting Sterile Bodies in the Phosphatic Bearing of Sidi Chennane (Morocco) Nora El Assel1, Azzouz Kchikach1*, Teresa Teixidó2, José Antonio Peña2, Mohammed Jaffal1, Roger Guerin3, Pascale Lutz4, Es-Said Jourani5, Mbarek Amaghzaz5 1Equipe de Recherche E2G, Université Cadi Ayyad, Marrakech, Morocco 2Laboratorio de Geofisica Aplicada, Instituto Andaluz de Geofisica, Universidad de Gran ada, Spain 3Université Pierre et Marie Curie-Paris, UMR 7619 Sisyphe, Paris , France 4Institut Polytechn ique LaSalle Beauvais, Départme nt Géosciences, Beauvai, France 5Groupe Office Cherifien des Phosphates (OCP), Khouribga, Morocco E-mail: kchikach@fstg-marrakech.ac.ma Received May 27, 2011; revised July 25, 2011; accepted September 7, 2011 Abstract In Sidi Chennane deposits (Morocco), the phosphatic series is composed of regular interbedded phosphatic and marly limestone layers. Exploitation of the phosphate in these deposits collides frequently with problems bound to the existence, in this series, of sterile bodies qualified as derangements. They cause two kinds of problems: 1) as they are hard, compact and masked by a Quaternary cover, they disturb the exploitation in some yards and give bad reserve calculation; 2) even the use of wells and mechanical boreholes did not evi- dence their delimitation. Our study shows that these bodies can be detected and delimited using ground penetrating radar and electrical resistivity tomography methods. It is based on the acquisition and the inter- pretation of series tests using these methods carried out above visible sterile bodies in a trench of exploitation in order to have geologically valid information. The article concerns to the analysis of the results and of the proceeding for a possible large geophysics survey. Keywords: Phosphatic Series, Sterile Bodies, Geophysical Prospecting, GPR and ERT Methods 1. Introduction Morocco is one of the biggest phosphate producing coun- tries in the world. Its reserves are valued at billion cubic meters and represent more than three quarters of the known world resources [1]. The biggest phosphatic de- posits exist in the Ouled Abdoun sedimentary basin lo- cated in the central part of Morocco (Figure 1(a)). In this basin, the phosphatic series (Figure 1(b)) of tabular structure has a thickness of about 50 m. It starts as a Maastrichian formation that corresponds to interbedded phosphatic marls, uncemented phosphatic and limestone layers. Paleocene is mainly composed of uncemented phosphate and silex bands. Eocene corresponds to an alternation of uncemented phosphate layers, phosphatic limestone, and discontinuous horizons of silex and silt- pelitic levels [2-4]. The whole sequence is covered by a thin Quaternary cover. In some parts of deposits under exploitation, this ver- tical and regular succession of phosphatic layers does not exist. All terms of the phosphatic series are mixed and transformed, and give Sterile Bodies (SB) formed exclu- sively of silicified limestone or limestone blocks and marls (Figure 1(c)). These bodies have a conical or sub- circular form; their diameter varies from 10m to more than 150 m [5]. Geologically, their origin is explained as progressive downfalls on the vertical of underground cavities produced by gypsum dissolution. The gypsum bed is identified in the Senonian evaporitic formation situated at the base of the phosphatic series [6-8]. Such structures have also been described in similar world sedimentary context [9,10]. The presence of these sterile bodies in the phosphatic series causes two main problems: 1) as they are masked by the Quaternary cover, we do not know their volume proportion in the deposit, so the reserve calculation can  N. EL ASSEL ET AL. Copyright © 2011 SciRes. IJG 407 Figure 1. (a) Location of the studied area in the sedimentary basin of Ouled Abdoun. (b) Stratigraphical log of the phosphatic series. (c) Sec tion and photography show ing Sterile bodies witch disturb the extraction of phosphate. 1, hercynian massif; 2, Phosphatic areas; 3, marls; 4, phosphatic marls; 5, phosphatic layer; 6, limestone s; 7, phosphatic limestone; 8, discontinuous silex bed; 9, silex nodule; 10, sterile body formed exclusively of silicified limestone; 11, sterile body constituted of a blend of limestone blocks, marls and clays; 12, limit of the sterile body; 13, road. be wrong and 2) as they are generally hard and compact, they highly complicate the phosphate extraction. Indeed, in areas containing sterile bodies, operators must tighten and fill the necessary boreholes with explosives for this extraction, thereby increasing the cost of operation dras- tically. Their detection and delimitation under the Qua- ternary cover would permit the mining engineers to get around them during the exploitation. Our study concerns Ground Penetrating Radar (GPR) and Electrical Resistiv- ity Tomography (ERT) prospecting to indicate their lo- calization and size in Sidi Chennane area. Several geophysical works have been achieved in Sidi Chennane area: Vertical Eclectric Sounding (VES) [5] and Time-Domain ElectroMagnetic sounding (TDEM)  N. EL ASSEL ET AL. Copyright © 2011 SciRes. IJG 408 [8]. The aim of these studies was to localize the sterile bodies; thus, they established electric resistivity as a suitable geophysical technique, but the slowness and difficulty of data collection do not make them a viable exploration program for an investigation zone close to 25000 ha. In collaboration with the of the Cherifian Of- fice of Phosphate Group (OCP), we investigated new methods that may offer a geophysical contrast and, more importantly, can have an important field production to explore wide surfaces. Considering the absence of strati- fication in the sterile bodies, compared to the normal stratified series (Figure 1(d)), and the median conductiv- ity of the Quaternary cover that prevents the penetration of the electromagnetic waves through the subsurface, geophysical prospecting with a GPR method can be re- garded as useful. We also tested the ERT method to pro- vide another correlation technique. The geophysical im- ages elaborated in this study present the obtained results and we propose to debate these results that are subse- quently controlled by drilling of mechanical wells by the OCP Group. 2. GRP Prospection 2.1. GPR Profiles GPR is a geophysical method that generates and records electromagnetic wave reflections from boundaries, pre- senting changes in electrical properties of strata near the earth’s surface. A GPR profile consists of radar traces collected along a survey line at a fixed station interval. The current practice is to employ a single transmitter/ receiver pair of antennas having a fixed separation be- tween them (2.1 m in this study) and registering them coupled over the terrain surface. Figure 2(a) shows the geographic locations and the relative distances for the four GPR profiles performed. Most parts of the GPR profiles were made near the exploitation trench in order to validate their results with the geological information. In this study, we have mounted the transmitter/receiver pair in a bearer car with a control survey wheel (Figure 2 (b)) in order to accomplish the acquisition of data quickly. All profiles have been investigated using Geo- physical Survey Systems, Inc. equipment (GSSI, SIR- 3000, Sys) with two types of antennas (40 and 80 MHz). Table 1 presents the acquisition parameters and the in- tegrity of the specifications. 2.2. GPR Data Processing Flow The GPR traces are processed to yield an image of the subsurface structure. The acquired GPR profiles corre- spond to a common-offset gather and the data are single- fold, in contrast to the multifold Commun Depth Point (CDP) seismic data, and cannot be stacked horizontally to attenuate random noise [11]. In addition, in this case, much coherent noise is present in the GPR data because of the strong waves produced between the air-transported antennas and the ground. This air-ground additive noise reduces the usual signal/noise relation in the radar sec- tion. Consequently, the radar noise may be much higher on these GPR profiles than that in a coupled GPR with the same characteristics, and must be attenuated through an accurate processing flow. A stack of four adjacent traces at each station (vertical stacking) is used to attenu- ate random noise. Because the neighboring CDP are closer (10 cm) and transmitter-receiver antenna separa- tion is small compared to targeted depths, reflection ray paths in flat lying strata can be treated as normal inci- dence rays. In this case, the GPR profile data becomes equivalent to a seismic stacked section having one trace at each CDP [12]. To eliminate the coherent noise, a time predictive deconvolution has been employed along with horizontal filters. Furthermore, the general aim of filter- ing is to preserve the most band-width range of frequen- cies [13]. GPR data are processed using standard seismic software (6.5, GSSI Inc.). Table 2 gives the processing steps used for this study. Preprocessing is applied using RADAM software and final processing is done using ProMax (Land-Mark Graphics, Inc.) seismic package. 3. ERT Prospection 3.1. ERT Surveys ERT method was applied to provide a continuous cover Table 1. GPR profiles and their acquisition par ame ter s. Profile 40 MHz 80 MHz Recorder parameters 1 200 200 Record length 500 ns 2 500 500 Bytes/sample 16 3 200 200 Samples/trace 1024 4 400 400 Scans/m 10 Table 2. Processing flow used in this study . Processing flow 1. Deconvolution: n = 41 ns, lag = 5 ns, range gain = 1.5 2. Vertical Triangle Band-pass filter 3. Horizontal Triangle Background (n = 501 traces) 4. Horizontal Triangle Stack (4 traces) 5. Gain compensation 6. Velocity analysis: Vmig = 0.1 m/ns; dielectric ct. = 9 7. Elevation correction, 8. Conversion to SEG-Y format, 9. Time migration 10. Coherence filter, 11. Depth conversion 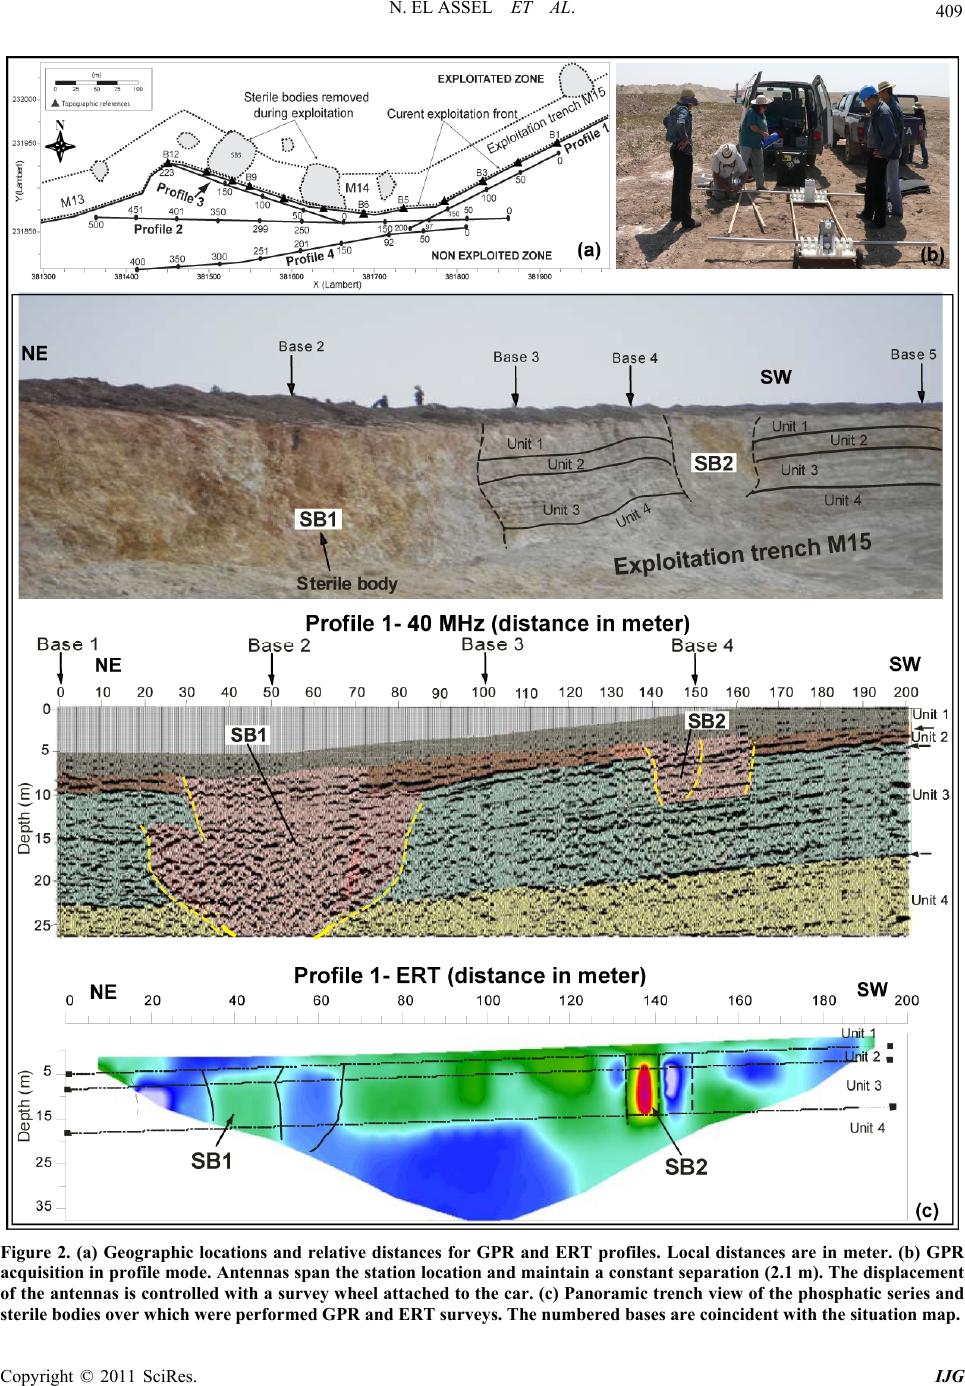 N. EL ASSEL ET AL. Copyright © 2011 SciRes. IJG 409 Figure 2. (a) Geographic locations and relative distances for GPR and ERT profiles. Local distances are in meter. (b) GPR acquisition in profile mode. Antennas span the station location and maintain a constant separation (2.1 m). The displacement of the antennas is controlled with a survey wheel attached to the car. (c) Panoramic trench view of the phosphatic series and sterile bodies over which were performed GPR and ERT surveys. The numbered bases are coincident with the situation map. 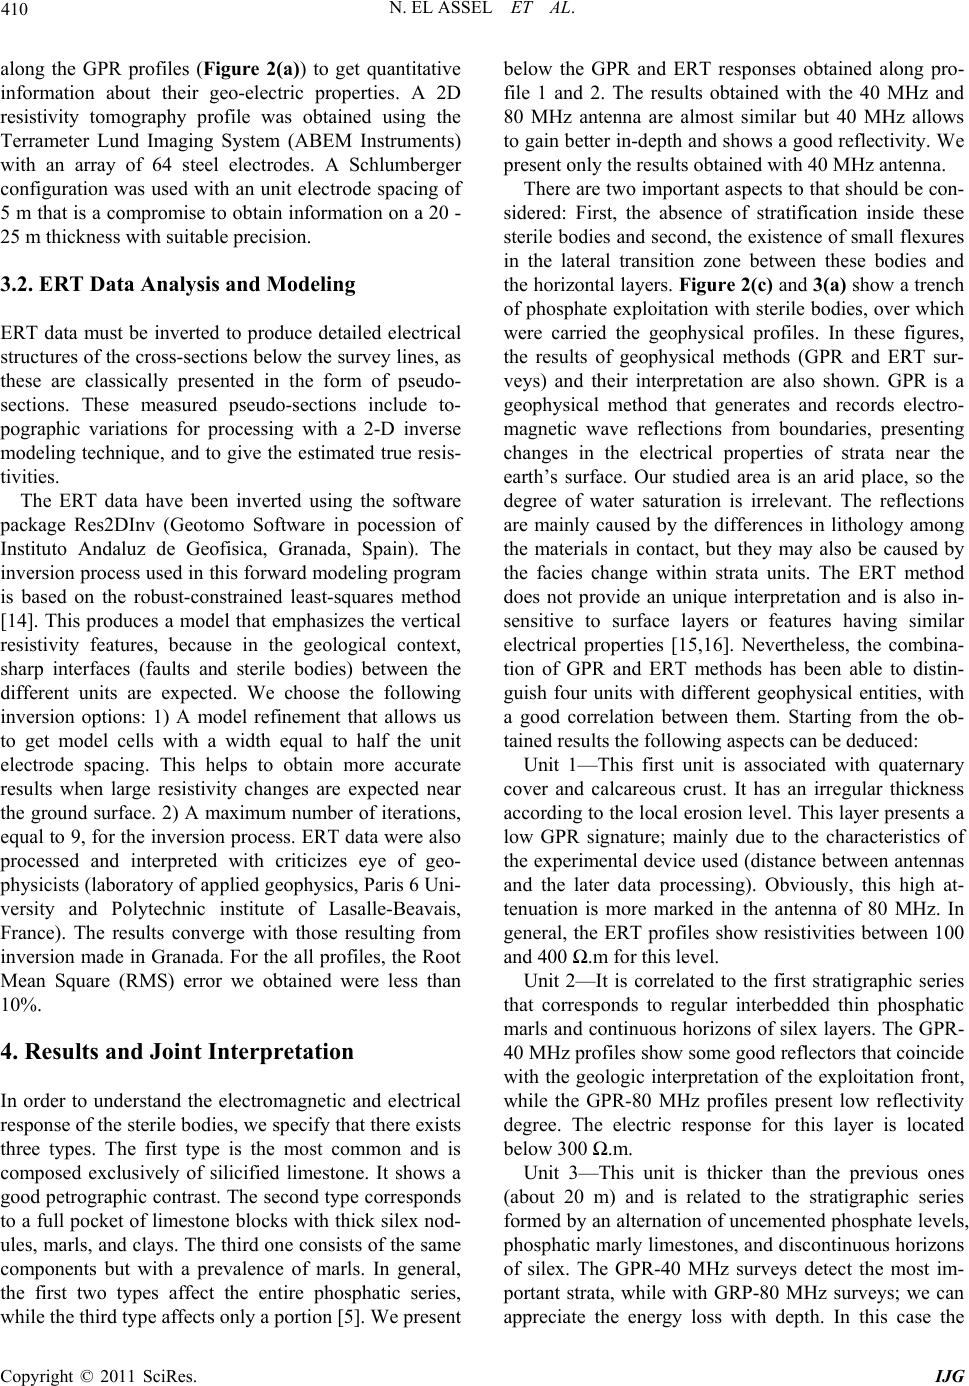 N. EL ASSEL ET AL. Copyright © 2011 SciRes. IJG 410 along the GPR profiles (Figure 2(a)) to get quantitative information about their geo-electric properties. A 2D resistivity tomography profile was obtained using the Terrameter Lund Imaging System (ABEM Instruments) with an array of 64 steel electrodes. A Schlumberger configuration was used with an unit electrode spacing of 5 m that is a compromise to obtain information on a 20 - 25 m thickness with suitable precision. 3.2. ERT Data Analysis and Modeling ERT data must be inverted to produce detailed electrical structures of the cross-sections below the survey lines, as these are classically presented in the form of pseudo- sections. These measured pseudo-sections include to- pographic variations for processing with a 2-D inverse modeling technique, and to give the estimated true resis- tivities. The ERT data have been inverted using the software package Res2DInv (Geotomo Software in pocession of Instituto Andaluz de Geofisica, Granada, Spain). The inversion process used in this forward modeling program is based on the robust-constrained least-squares method [14]. This produces a model that emphasizes the vertical resistivity features, because in the geological context, sharp interfaces (faults and sterile bodies) between the different units are expected. We choose the following inversion options: 1) A model refinement that allows us to get model cells with a width equal to half the unit electrode spacing. This helps to obtain more accurate results when large resistivity changes are expected near the ground surface. 2) A maximum number of iterations, equal to 9, for the inversion process. ERT data were also processed and interpreted with criticizes eye of geo- physicists (laboratory of applied geophysics, Paris 6 Uni- versity and Polytechnic institute of Lasalle-Beavais, France). The results converge with those resulting from inversion made in Granada. For the all profiles, the Root Mean Square (RMS) error we obtained were less than 10%. 4. Results and Joint Interpretation In order to understand the electromagnetic and electrical response of the sterile bodies, we specify that there exists three types. The first type is the most common and is composed exclusively of silicified limestone. It shows a good petrographic contrast. The second type corresponds to a full pocket of limestone blocks with thick silex nod- ules, marls, and clays. The third one consists of the same components but with a prevalence of marls. In general, the first two types affect the entire phosphatic series, while the third type affects only a portion [5]. We present below the GPR and ERT responses obtained along pro- file 1 and 2. The results obtained with the 40 MHz and 80 MHz antenna are almost similar but 40 MHz allows to gain better in-depth and shows a good reflectivity. We present only the results obtained with 40 MHz antenna. There are two important aspects to that should be con- sidered: First, the absence of stratification inside these sterile bodies and second, the existence of small flexures in the lateral transition zone between these bodies and the horizontal layers. Figure 2(c) and 3(a) show a trench of phosphate exploitation with sterile bodies, over which were carried the geophysical profiles. In these figures, the results of geophysical methods (GPR and ERT sur- veys) and their interpretation are also shown. GPR is a geophysical method that generates and records electro- magnetic wave reflections from boundaries, presenting changes in the electrical properties of strata near the earth’s surface. Our studied area is an arid place, so the degree of water saturation is irrelevant. The reflections are mainly caused by the differences in lithology among the materials in contact, but they may also be caused by the facies change within strata units. The ERT method does not provide an unique interpretation and is also in- sensitive to surface layers or features having similar electrical properties [15,16]. Nevertheless, the combina- tion of GPR and ERT methods has been able to distin- guish four units with different geophysical entities, with a good correlation between them. Starting from the ob- tained results the following aspects can be deduced: Unit 1—This first unit is associated with quaternary cover and calcareous crust. It has an irregular thickness according to the local erosion level. This layer presents a low GPR signature; mainly due to the characteristics of the experimental device used (distance between antennas and the later data processing). Obviously, this high at- tenuation is more marked in the antenna of 80 MHz. In general, the ERT profiles show resistivities between 100 and 400 Ω.m for this level. Unit 2—It is correlated to the first stratigraphic series that corresponds to regular interbedded thin phosphatic marls and continuous horizons of silex layers. The GPR- 40 MHz profiles show some good reflectors that coincide with the geologic interpretation of the exploitation front, while the GPR-80 MHz profiles present low reflectivity degree. The electric response for this layer is located below 300 Ω.m. Unit 3—This unit is thicker than the previous ones (about 20 m) and is related to the stratigraphic series formed by an alternation of uncemented phosphate levels, phosphatic marly limestones, and discontinuous horizons of silex. The GPR-40 MHz surveys detect the most im- portant strata, while with GRP-80 MHz surveys; we can appreciate the energy loss with depth. In this case the  N. EL ASSEL ET AL. Copyright © 2011 SciRes. IJG 411 Figure 3. (a) Joint interpretation along profile 2. (b) GPR and ERT responses in front of three types of sterile bodies. (b) Lo- cation of the detected sterile bodies in studied area. Interpretation was controlled by mechanical boreholes.  N. EL ASSEL ET AL. Copyright © 2011 SciRes. IJG 412 electric response is similar to the previous unit, which is located below 300 Ω·m. Unit 4—This unit constitutes the basal layer of this study and its top has been detected at 20 - 25 m depth. Geologically, it corresponds to an alternation of thicker phosphatic marls, marly limestones, and marl layers. In general, the GPR-40 MHz profiles detect clearly the contact between the top and the bottom of the superior unit, while this has been practically impossible with the GPR-80 MHz. However, this contact is very well distin- guished with the ERT method because there is a very- good resistivity contrast. For this unit, the resistivity is very homogeneous and below 150 Ω·m. We have referred to the general characteristics in the above description. But these units are interrupted by the presence of sterile bodies and other geologic signatures (flexures) because their formation has generated in the- subsurface. Based on this, we have established the fol- lowing classification (Figure 3(b)). Sterile body type A: These bodies are formed exclu- sively by silicified limestones that show a good physical contrast. They can be easily detected by two geophysical methods. The GPR signatures are clear and the sections are characterized by the presence of strong reflectors that are truncated in vertical structures in their interior. SB3 and SB7 (Figure 3(c)) are the examples of this type. These structures are also detected in ERT images, which are distinguished to present vertical intercalations of great resistivity (above 750 Ω·m). Most of these bodies have been detected below the Quaternary cover and rise up to the Unit 4. Sterile body type B: These bodies are formed by a mixture of limestone blocks with big silex nodules, marls, clays, and portions of silex bands; so they produce geo- physically smaller contrasts than the previous bodies. Their bottoms have been detected at lower depths; most of them are located in Unit 3, and some in Unit 2. SB2, SB5 and SB6 (Figure 3(c)) are the examples of sterile bodies type B. In this case, the GPR response is not so clear, but the reflectors usually present a vertical disposi- tion that corresponds with the electric response. Sterile body type C: These bodies were not accom- panied by any remarkable silicification and calcification phenomena during their formation [5]. Their GPR im- ages are formed by chaotic reflectors (SB1, Figure 2(c)) and their resistivities are close to that of the phosphatic series (smaller than 300 Ω·m). So it is difficult to distin- guish ERT response from this type compared to that of the normal phosphatic series. In the two detected cases (SB1 and SB4, Figure 3(c)), it has not been possible to differentiate reliably the contact of their base. It is indeed this type of sterile bodies which limits effectiveness of TDEM and VES methods before used to mapped these structures [5,8]. The interest to combine GPR and ERT methods is clearly demonstrated in this study. 5. Conclusions In this study, through prospecting with GPR and ERT methods, we have delimited four sterile bodies visible in the facing of trench exploitation of phosphate (SB1, SB2, SB3 and SB4; Figure 3(c)). The results show that SB1 and SB2 visible in the photography of the explotation trench M15 will continue in the next trench one. SB3 which was a great sterile body in the exploitation trench M14 will cover all the width (40 m) of next trench. On the other hand SB4 will disappear in the next one. We have also identified and delimited three others sterile bodies under the Quaternary cover (SB5, SB6 and SB7; Figure 3(c)). Boreholes have been subsequently achieved by the OCP Group with a 5 × 7 m step to con- trol the geophysical results. Sterile bodies SB1, SB2, SB3, SB5, SB6 and SB7 (Figure 3(c)) have been con- firmed by theses boreholes and the limit of the deranged zone is cartographied with an uncertainty of few meters. This paper demonstrates that the GPR method gives different signs to the vertical of the normal phosphatic series and that of the sterile bodies. This method can de- fine the geometry of sterile bodies in a phosphatic envi- ronment, and can also distinguish facies variation within the bodies. We have observed that for this prospecting type, a 40 MHz antenna is the most useful. There are three main aspects to this research. First, the GPR profiles to perform a methodological test for the recognition and characterization of these bodies. In this context we found that the conductor body (body type C) cannot be detected only with a ERT method. However, in this study we have used an antenna designed to operate in static mode (ground coupling) to acquire the data in a dynamic way; this means an energy loss. In the industry, there are low frequency antennas (up to 40 MHz) that can operate in a dynamic mode (airborne coupling). Usually they are coupled in a car and are designed to provide bigger power injections into the subsurface. Second, this GPR device allows quick acquisition of data sets, so it can be planned for exhaustive terrain recogni- tion. Third, although the resistivity contrast between the normal phosphatic series and the sterile bodies is weak, the ERT method allows their detection, particularly in those of type A, and can be used as a contrast tool for prospecting sterile bodies. 6. Acknowledgements This study is a part of the A/3820/05 and A/025780/09 Projects, financed by the Spanish Agency of Interna-  N. EL ASSEL ET AL. Copyright © 2011 SciRes. IJG 413 tional Cooperation (AECI, PCI-Mediterranean). This study also received the support of the integrated action MA/209/09 (Morocco-French, volubilis program).We thank them for the concession. The authors also thank the following: Granada (Spain) University, Pierre and Marie Currie (French) University and the Cadi Ayyad (Morocco) University for their support; the OCP group for their remarkable collaboration in field work; and fi- nally, the Geologic Institute of Catalonia (ICC, Spain) for their assistance in the use of the Promax seismic package software. 7. References [1] M. Azmany, X. Farkhany and H. M. Salvan, “Gisement des Ouled Abdoun, Géologie des Gîtes Minéraux Maro- cains,” Notes et Mémoires, Service Géologique du Maroc, Vol. 276, No. 3, 1986, pp. 200-249. [2] H. M. Salvan, “Étude Complémentaire sur le Gisement de Merah El Areh. Étude d’ensemble des Niveaux Supé- rieurs,” Rapport Inédit, Edition du Service Géologique de l’Office Chérifien des Phosphates, 1963, pp. 1-14. [3] A. Boujo, “Contribution à l’étude Géologique du Gise- ment de Phosphate des Ganntour, Maroc Occidental,” Notes et Mémoires, Service Géologique du Maroc, Vol. 262, No. 2, 1976, pp. 205-227. [4] M. Azmany, “Évolution des Faciès sur le Gisement des Ouled Abdoun,” Mines, Géologie et Energie, Service Géologique du Maroc, Vol. 44, 1979, pp. 35-38. [5] A. Kchikach, M. Jaffal, T. Aïfa and L. Bahi, “Carto- graphie de Corps Stériles Sous Couverture Quaternaire par Méthode de Résistivités Électriques dans le Gisement Phosphaté de Sidi Chennane, Maroc,” Comptes Rendus Geoscience, Vol. 334, 2002, pp. 379-386. doi:10.1016/S1631-0713(02)01767-4 [6] C. Durlet, A. Kchikach, K. El Hariri and N. El Fedy, “Etude des Dérangements dans le Centre Minier de Khou- ribga,” Rapport Inédit, Edition du Service Géologique de l’Office Chérifien des Phosphates, 2005, pp. 1-7. [7] N. El Fedy, “Paléokarsts des Series Évaporitiques du Bas- sin des Oules Abdoun (Crétacé supérieur, Paléocène, Ma- roc): Influence Sur La Géométrie Des Gisements Phos- phatées,” Mémoire Master Recherche, Biogéosciences UMR CNRSS 5561, Université de Bourgogne, France, 2005. [8] A. Kchikach, P. Andrieux, M. Jaffal, M. Amrhar, M. Mchichi, B. Boya, M. Amaghzaz, T. Veyrieras and K. Iqizou, “Les Sondages Électromagnétiques Temporels Comme outil de Reconnaissance du Gisement Phosphaté de Sidi Chennane (Maroc): Apport à la Résolution d’un Problème D’Exploitation,” Comptes Rendus Geoscience, Vol. 338, 2006, pp. 289-296. doi:10.1016/j.crte.2006.02.003 [9] E.A. Menor, “La sédimentation phosphatée, pétrographie, minéralogie et géochimie des gisements de Taïba (Sé- négal) et Olinda (Brésil)”, Ph.D. Thesis, Louis-Pasteur University, Strasbourg, 1975. [10] A. Boujo, E. A. Menor, F. V. Lima, P. Magate and A. J. Melfi, “O Fosfato Sedimentar de Congaçari (Bacia Per- nambuco-Paraïba): Uma Jazida de Concentraçào Resid- ual”, Annal Academie Brasil, Vol. 70, No. 3, 1998, pp. 627-645. [11] R. B. Szerbiak, G. A. McMechan, R. Cobeanu, C. Foster and S. H. Snelgrove, “3-D Characterization of a Clastic Reservoir Analog: From 3-D GPR Data to a 3-D Fluid Permeability Model,” Geophysics, Vol. 66, No. 4, 2001, pp. 1026-1037. doi:10.1190/1.1487050 [12] R. A. Young and J. Sun, “Revealing Stratigraphy in Ground-Penetrating Radar Data Using Domain Filtering,” Geophysics, Vol. 64, No. 2, 1999, pp. 435-442. doi:10.1190/1.1444548 [13] O. Yilmaz, “Seismic Data Analysis: Processing, Inver- sion, and Interpretation of Seismic Data,” In: S. M. Do- herty, Ed., Society of Exploration Geophysicists, Tulsa. [14] J. F. Claerbourt and F. Muir, “Robust Modeling with Erratic Data,” Geophysics, Vol. 38, No. 5, 1973, pp. 826- 837. doi:10.1190/1.1440378 [15] R. Guérin, P. Bégassat, Y. Benderitter, J. David, A. Tab- bagh and T. Médard, “Geophysical Study of the Indus- trial Waste Land in Mortagne-du-Nord (France) Using Electrical Resistivity,” Near Surface Geophysics, Vol. 2, No. 3, 2004, pp. 137-143. [16] I. Cousin, A. Frison, G. Giot, H. Bourennane, Roger Guérin and G. Richard, “ Three-Dimensional Structure of a Highly Heterogeneous Soil Horizon Derived by Elec- trical Resistivity Tomography,” ArchéoSciences, Vol. 33, No. 1, 2009, pp. 279-281. |