 Open Journal of Physical Chemistry, 2011, 1, 94-103 doi:10.4236/ojpc.2011.13013 Published Online November 2011 (http://www.SciRP.org/journal/ojpc) Copyright © 2011 SciRes. OJPC Electrical and Dielectric Characterization of Na0.5Li0.5Zr2(PO4)3 Umaru Ahmadu1, Tomas Salkus2, Abubakar Ohinoyi Musa3, Kasim Uthman Isah1 1Department of Physics, Federal University of Technology, Minna, Nigeria. 2Faculty of Physics, Vilnius University, Vilnius, Lithuania. 3Department of Physics, Bayero University, Kano, Nigeria. E-mail: u.ahmadu@hotmail.com Received July 11, 2011; revised September 15, 2011; accepted October 16, 2011 Abstract Na0.5Li0.5Zr2(PO4)3 has been synthesized by solid state reaction and characterized by thermogravimetry/ differential thermal analyses (TGA/DTA) in the temperature range 300 - 1573 K. X-ray diffraction measure- ments have been carried out to determine the phase of the composition and scanning electron microscopy (SEM) for microstructure evaluation. Impedance spectroscopy at different temperatures (310 - 600 K) and frequencies (300 kHz - 1 GHz) have been carried out and the dielectric relaxation behaviour was determined under the same conditions. A dc conductivity maximum value of 0.25 S/m at 580 K was observed. However, the mixed alkali effect was not observed. The material exhibited relaxation behaviour with a peak in the dielectric permitivity ' at 469 K. There were no structural transformations observed. Keywords: NZP, Impedance Spectroscopy, Dielectric Relaxation, Electrical Conductivity 1. Introduction At present one of the most important materials under investigation belongs to the NZP (sodium zirconium ph- osphate) family of compounds with formula NaZr2 (PO4)3. NZP has many potential applications, which in- cludes, environmental gas sensors (for detection of pol- lutant gases like CO2), thermal expansion [1], nuclear waste immobilization [2,3] and rechargeable lithium ion batteries. The Na, Zr, and P can be substitutted by atoms of different sizes and oxidation states resulting in com- pounds of different physical and chemical properties, while at the same time retaining the same crystal stru- cture. Such substitutions have lead to an enhancement of electrical conductivity [4,5], among other physical pro- perties. The compound has been synthesized mainly us- ing the solid state reaction method and ZrO2 is usually precipitated [6] due to the high temperature required for the synthesis. Additionally, small impurity phases (Li3 PO4, LiTiPO4, ZrP2O7), among others, have been detec- ted that do not affect the overall conductivity of the com- positions [7-9]. The composition Na1-xLixZr2(PO4)3, (where x = 0.0, 0.3, 0.5, 0.7 and 1.0) have been studied by Pet’kov et al. [10], by using solid state reaction and characterized by X-ray diffraction and differential thermal analyses (DTA). Similarly, Naik et al. [11,12] have synthesized NaZr2 (PO4)3 using microwave techniques at lower tempera- tures and carried out structural characterizations using XRD. However, the conductivity of NaZr2(PO4)3 has been reported to be very low, below the applicable range [13]. A key factor in the application of ionic materials in rech- argeable batteries is that they must have high conduc- tivity, of the order 101 to 10–1 S/m [14] in operating con- ditions. Thus studies on partial as well as full substi- tutions (of Na, Zr and P) have been carried out in order to improve the conductivities of the compositions. More- over, most of the impedance spectoscopy (IS) studies of the compositions have been undertaken within the kHz- MHz range of frequencies [6,15], wheareas very few stu- dies have been reported in the GHz range [5,16]. There are also no reports on their dielectric relaxation pro- perties. It is important to know the structure of NZP in order to understand how substitutions of Na+, Zr4+ or P5+ cations influence the conductivity. NZP has a hexagonal crystal structure and belongs to the rhombohedral symmetry (space group 3Rc). The structure is made up of ZrO6 octahedra and PO4 tetrahedara which share all their vertices to form interconnected network of channels. Na+  95 U. AHMADU ET AL. ions are located in these channels and can occupy two distinct sites, labelled type I (M1) and type II (M2). In NZP, only the M1 sites are filled and the M2 sites are empty. In order to correlate electrical parameters, such as electrical conductivity and associated activation energies with structural factors, the effect of the size of the bot- tleneck that connects M1-M2 sites are very important. A representation of the structure and its detailed description has been provided by several authors [7,18,19]. It has been observed that when Li+ cations are in these channnels they become suitable candidates for lithium rechargeable cells, if their conductivity at room tem- perature can be enhanced. We hypothesize that partial substitution of Na+ by Li+ ions in a 50:50 ratio at these sites should affect the conductivity positively due to their differencies in radii, mass and mobility and it should result in low activation energy. The phenomenon of “mixed alkali effect” has been suspected [7] to be res- ponsible for the low conductivity and high activation energy observed in a similar system (that is, when com- pared with compounds without Li+ ions) in which the authors suggested that further work is needed to arrive at a conclusive position. In the present work we have carried out the synthesis of Na0.5Li0.5Zr2(PO4)3 using solid state reaction by sin- tering at 1523 K. TGA/DTA have been carried out on their powder mixtures (Na2CO3·H2O, NH4H2PO4, Li2CO3 and ZrO2) from room temperature to 1273 K, in order to determine the decomposition and mass losses (tempe- rature stabilty) and phase transformations. In addition, IS and dielectric relaxation relaxation behaviour of the com- pound have been investigated in the temperature range 310 - 600 K and frequency range 300 kHz - 1 GHz. A high dc conductivity value was observed and the system exhibited dielectric behaviour at certain frequencies. 2. Experimental Procedure Na2CO3·H2O, ZrO2, Li2CO3 and NH4H2PO4 of analytical grade and purity > 99% were used as starting materials. Stoichiometric amounts of these materials were mixed and thoroughly ground (manually) in an agate mortar for about five hours. The samples were then dried in air for about four hours. Acetone was added in appropriate qu- antity to homogenize the mixture. Pellets of discs (which were dry) of 13 mm diameter and 6 mm thickness were pressed under pressure of 7.42·106 N/m2 for sintering. All the samples were placed inside a gas-heated furnace for eight hours at successive temperatures 573, 773, 1323, 1373, 1423, 1473 and 1523 K, respectively. Between each temperature the samples were allowed to furnace- cool to room temperature and then thoroughly re-ground, re-mixed, pelletized and placed back into the furnace for the next round of heating. The first two temperatures were to allow for the volatilization of bye-products, am- monia, water and carbon dioxide. The other tempera- tures were to allow for full sintering at a maximum tem- perature of 1523 K. Powder specimens were used for the measurement of thermal analyses on DTA machine Netzsch DTA404PC in air. The readings were conducted between room tem- perature and 1273 K at heating rate of 20.0 K/min. Simi- larly, TGA was performed on specimen powders under similar conditions on TGA Pyris 6 (Perkin Elmer, USA) thermal analyser. Both DTA and TGA data were automa- tically acquired from the machines. X-ray powder diffraction measurements were carried out using a precision mini X-ray diffractometer MD-10, Version 2.0.4 by Radicon Ltd. The 2θ range was 16˚ - 70˚ and the working power was 25 kV using 20 minutes ac- quisition time and CuKα radiation λ = 1.5406 Å. The scanning step was 0.05˚. The surfaces of sintered sample were analysed by SEM working at 5 kV. For the elec- trical measurements, sample was prepared 6.16 mm2 (electrode surface area) and length 1.5 mm. A home- made coaxia line has been used to measure impedance spectra [20]. The control and acquisition of data were carried out using MathLab software, on an Agilent Net- work Analyser E5062A in the frequency range from 300 kHz to 1 GHz (at 16 points per decade of frequency) and temperature range 310 - 600 K. Measurements were per- formed every 10 K on heating the sample at 1 K per min using a voltage of 200 mV. 3. Results and Discussion The XRD pattern for the composition Na0.5Li0.5Zr2(PO4)3 shows minor phase Na5Zr(PO4)3 with ZrO2 detected. Na5 Zr(PO4)3 has been synthesized and characterized by some workers [21] who reported that it has no specific thermal effects (for example, phase transformation), though, it undergoes reversible phase transitions and decomposes at 433 K [21]. We thus assume that there is minimal dis- tortion to the crystal lattice and thus shows that the syn- thesized composition is single phase. Impurity phases have been reported in solid state reactions. Some authors [18] have observed a distortion to the hexagonal lattice (in the preparation of NASICON-based compounds) as a result of presence of some impurity phases (AlPO4, GeO2) which have been found to be a function of either de- creasing temperature or of multiple substitutions at spe- cific lattice sites. The authors assumed the effect of these impurities to be negligble on the overall crystal structure. The compound under investigation (Na0.5Li0.5Zr2(PO4)3 ) was also indexed based on the hexagonal lattice structure and found to belong to the rhombohedral crystal sym- Copyright © 2011 SciRes. OJPC  U. AHMADU ET AL. 96 metry [10]. The lattice paramters obtained by least-square fitting of the XRD data were a = 8.7450 Å and c = 23.2578 Å. The results of the lattice parameters obtained by some workers [10] for the same composition are a = 8.7630 Å and c = 23.4590 Å. The value of the experimental density obtained by measuring the dimensions of the pellets is 90% of the theoeretical density. This shows that it is relatively dense material. The peaks of Na0.5Li0.5Zr2(PO4)3 are found to correspond to the standard ICDD, PDF-2 (33-1312) pattern, except for the detected phases, and could be identified with Na0.5Li0.5Zr2(PO4)3. Complete synthesis of the composition was therefore achieved by sintering at 1523 K by heating for 8 h, although the synthesis of the main compound (NaZr2(PO4)3) has been reported [11] using microwave heating at 923 K for 1 h. Peak broadening was observed in the XRD diffraction peaks as a result of crystallite size due to microstrain (caused by the high temperature used) [22]. High temperature sintering is normally used in the preparation of NZP compositions which results in microcraking as a result of the microstrain it induces in the ceramic on cooling [9]. Figure 1 depicts SEM micrograph of the surfaces of Na0.5Li0.5Zr2(PO4)3 ceramics showing large grains (3 - 7 µm) and very small porosity. The grains are well-structured and have different sizes. The thermal analyses results were obtained for TGA- DTA of the composition in the temperature range 310- 1273 K. There is overall mass loss of 23% in the TGA. The composition is stable and the thermal stability tempe- rature starts from 600 K and is an indication of the com- pletion of the formation of the product phase. The steps in decomposition represent the evolution of water, amonia and carbondioxide. Similar results were obtained by some Figure 1. Micrograph of sintered Na0.5Li0.5Zr2(PO4)3 show- ing surfaces of well-structured grains of different sizes. workers [11] in which they reported that the thermal stability temperature is around 923 K, though the steps in decomposition differed as a result of the starting materials used and the subsequent chemical routes of the reaction. The DTA results shows only one sharp exothermic peak at 469 K, which is attributted to loss of water of hydration. Similarly, the above authors [11] had differing number of peaks, due to the different chemicals used and the routes in the reactions. However, there is no report of any structural transformations or thermal effects (which may affect electrical conductivity and activation energy for conduction, among others) found in this work in the temperature range investigated. Other workers [21] have similarly reported the absence of any thermal effects in NaZr2(PO4)3, in the temperature range 298 - 1123 K. The detailed thermal analyses of the composition has been reported elsewhere [23]. The importance of the thermal analyses is to establish the thermal stability range of the compound and to find out whether there was any phase transition. Figure 2 shows the variation of the imaginary (z ) versus real () parts of impedance at different tem- peratures 310 - 600 K. All the plots show an increasing reduction in the radii of the partially formed semicircles and shrink towards the origin. This implies an increase in conductivity as a result of reduction in resistance of the sample. At low temperatures (310 - 350 K) and frequencies, the overlap of the partially formed arcs due to grains (bulk) and grain boundary are visible. At higher tempe ratures the grain boundary component becomes more visible and ' z Figure 2. Imaginary z versus real impedance plots at different temperatures (310 - 600 K) and frequen- cies (300 kHz - 1 GHz) of Na0.5Li0.5Zr2(PO4)3, Inset, shows ' z exploded plots for temperatures 500 - 600 K. Copyright © 2011 SciRes. OJPC  U. AHMADU ET AL. 97 rlap can be e imaginary part of the arcs become more distinct. The ove attributted to closeness of their relaxation frequencies and to inhomogeneities that may be present in the compo- sition. The persistence of the grain boundary component up to the maximum temperature may be attributted to the temperature range investigated. The impedance curves at high temperatures (500 - 600 K) have been exploded due to their low impedance values in order to elucidate the features more clearly, as shown in the inset of Figure 2, where the curves are seen to make greater curvatures, and the grain and grain boundary contributions become visib- le. The grain boundary contribution is apparently domin- ant and shows more curvature at this temperatures com- pared to the bulk. The electrode effects do not seem to be significant and thus did not show up even though blo- cking electrodes were used (platinum). Figure 3(a) shows the variation of th impedance (z) versus frequency at different tem- peratures (310 - 60 K) in the frequency range 300 kHz - 1 GHz. Two relaxation processes can be observed: the one at higher frequencies is attributed to ionic relaxation in the bulk, while the other ( lower frequency) is attributed to ionic relaxation in grain boundaries, as indicated in Figure 3(a). All the curves show a systematic fall in the maximum values of the peak of z as the temperature increases. Both peaks shift toward hher frequencies with increase in temperature, indicative of the presence of relaxation. The dominance and sharpness of the grain boundary is ob- vious. Based on an Arrhenius-type relation, the rela- xation frequencies () b 0 ig associated with each peak (for bulk contribution) cae related to the bulk and used to determine the corresponding activation energy for relaxa- tion in the bulk ( n b b E) from the equation: e E b T bo ff (1) where o is the preexponential factor and k and T re- present the Boltzmann constant and temperature, respe- ctively. The relaxation time b can be derived from the reciprocal of the relaxatio frequency b n (where 2π) bb and is the angular frequencyt can be Figur 3(b) that a linear relation can be deduced from the above equation when ln b . I seen from e versus 1000/T graph is plotted in the temperature range 400 - 600 K. A linear fit to the above equation yielded bulk activation energy for relaxation of 0.36 eV. A similar approach has been reported in the study of Na1+xTi2-x Alx(PO4)3, where x = 0.6 - 0.9 [7], in which the frequency at which the maxima of the imaginary part of modulus '' m peaks occurs (max ) was used to calculate the tion energy. This oach has been justified on the grounds that the modulus is not affected by the grain boundary contributions, since the peak frequency scales as the bulk conductivity over the bulk permitivity ( activa appr ). Additionally, when the bulk capacitance is temperature- independent, max is equally activated as the conduc- tivity. Figure ows the Arrhenius representation of 3(c) sh (a) (b) (c) Figure 3. (a) O4 versus frequency plot at 450 - 600 K for Na0.5Li0.5Zr2(P )3; (b) Arrhenius plot of ln b f against 1000/T for Na0.5Li0.5Zr2(PO4)3; (c) Arrhenius plot of ln max f against 1000/T for Na0.5Li0.5Zr2(PO4)3. Copyright © 2011 SciRes. OJPC  U. AHMADU ET AL. 98 ln max against 1000/T plot. max E (0.28 eV) is close to tha bulk (t for b E~0.36 eV) corresponding acti- vation energy fhe grain boundary ( . The or t gb E), obtained from the slope (not shown) of the linear the Arrh- enius equation for relaxation frequency ( fit to gb E) is ~ 0.38 eV, which is similar to b E. The variation of theal part ' e r of ac conductivity (ac ) with frequency has also been studied at different ptures (310 - 600 K) and is shown in Figure 4(a). Two regions are visible, the frequency independent region (plateau), associated with dc conductivity at low frequencies (related to the long range transport of Li+ and Na+ ions), and the high frequency dispersive region, which is attributted to the short range hopping motion of the ions as the temperature increases. At lower tempera- tures some of the curves do not obey the Jonscher power law completely since only the high frequency dispersive regions are visible. The dc or low frequency range be- comes narrower and eventually disappears as the tem- perature decreases, leaving only the high frequency dis- persive region. The maximum value of the ' tem era obtained in this work is ~0.32 S/m at 600 K. Figure 4(b) is a log-log plot of the ac conductivity versus frequency in the temperature range 310 - 600 K. It is known that the ac conductivity of ionic materials at a given temperature is usually described by the power law equation, expressed as: ac n dc , (2) where, dc uen is the extrapolated dc conductivity value of the freqcy independent region which shows a flat response at low frequencies, is the ac coefficient which is temperature-dependentnd n is the correllation exponent of the mobile ions. At higher frequencies the conductivity shows dispersion. This equation has been applied in identifying the common qualitative features of many disordered solids, such as glasses, structurally disordered crystals, and supercooled melts [24,25]. In Figure 4(b), the crossover point of the frequency-inde- pendent plateau and the high frequency ac dispersive region shifts towards high frequencies with increasing temperature. This is explained by the fact that with increase in temperature, the kinetic energy of the ions also increases and hence their vibrational frequency. Analyses of the plots shows that the onset part of the conductivity dispersion at different temperatures lie on a straight line. This implies that dc a (T) and the onset frequency fT are proprtion l to eachother, and that both are thlly activated with almost the same energy of activation, indicating a general feature of the power law proposed by Jonscher [18]. The frequency-independent region (flat response ) increases with temperature and all the plots obey the Jonscher’s law at all temperatures. We can determine, from the slope of the ln ac a erma vs ln f plot, the value of the correlation exponent n. Our result tem (b) shows that the value decreases with increase in perature in a narrow range (0.26 - 0.36) and shows that n is a temperature-dependent relaxation process. The plot of n versus T at different temperatures is shown in Figure 4(c) with the straight line fit to the relation and shows an increase of n with decrease of temperature. However, the values of n reported by some authors [7] in their study is ~0.60, for all the compostions. Others [18] however, reported values in the range ~0.61 - 0.63 in the study of Li1+x[(Ta1-x Gex) Al] (PO4)3, where x = 0.0 - 1.0, in some compositions, and up to 0.90 in others. The authors could find no explanation for the high values in the other compositions and suggested further investigations. Our present result is comparatively lower and points to a need for further investigations too. The electrical conduction mechanism of ionic materials has been determined by the (a) Copyright © 2011 SciRes. OJPC 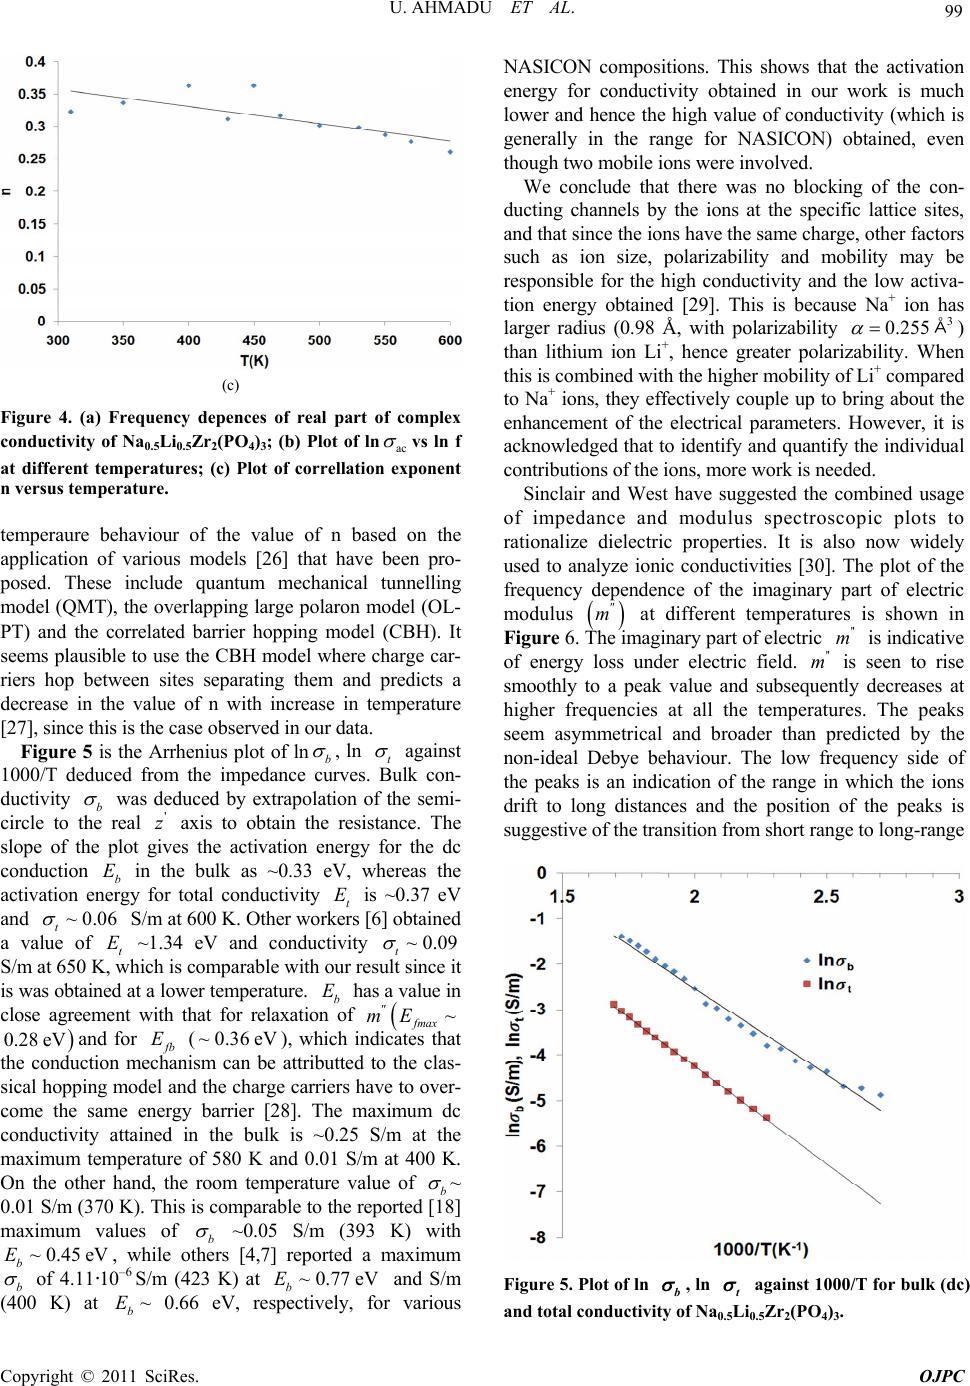 U. AHMADU ET AL. 99 (c) Figure 4. (a) Frequency depences of real part of complex conductivity of NaLi Zr ); (b) Plot of ln 0.50.5243 (PO ac vs ln f at different temperatures; (c) Plot of correllationonent n versus temperature. temperaure behaviour of the value of n based on the application of various models [26] that have been pro- posed. These include quantum mechanical tunnelling model (QMT), the overlapping large polaron model (OL- PT) and the correlated barrier hopping model (CBH). It seems plausible to use the CBH model where charge car- riers hop between sites separating them and predicts a decrease in the value of n with increase in temperature [27], since this is the case observed in our data. Figure 5 is the Arrhenius plot of ln exp b , ln t agai curves. Bulk con nst 1000/T deduced from the edance-imp ductivity b was deduced by extrapolation of the semi- circle to the real ' z axis to obtain the resistance. The slope of the plot gives the activation energy for the dc conduction b E in the bulk as ~0.33 eV, whereas the activation energy for total conductiveV ity t E is ~0.37 and ~0.06 t S/m at 600 K. Other workers [6] obtained a value of t E ~1.34 eV and conductivity ~0.09 t S/m at 650 K, which is comparable with our result since it is was obtained at a lower temperature. b E has a value in close agreement with that for relaxation of ~ fmax mE 0.28 eVand for b E (~0.36eV), which indicates that the conduction mechanism can be attributted to the clas- sical hopping model and the charge carriers have to over- come the same energy barrier [28]. The maximum dc co ~0nductivity attained in the bulk is .25 S/m at the maximum temperature of 580 K and 0.01 S/m at 400 K. On the other hand, the room temperature value of b ~ 0.01 S/m (370 K). This is comparable to the reported [18] maximum values of b ~0.05 S/m (393 K) with ~0.45eV b E, while others [4,7] reported a maximum b of 4.11·10–6 S/m (423 K) at ~0.77eV b E and S/m (400 K) at b E~ 0.66 eV, respectively, for various NASICON copositions. This shows that the energy for conductivity obtained in our work is much lower and hence the high value of conductivity (which is generally in the range for NASICON) obta o mobiles wved. We conclude that there was no blocking of the con- ducting channels by the ions at the specific lattice sites, and that since the ions have the same charge, other factors such as ion size, polarizability and mobility may be responsible for the high conductivity and the low activa- tion energy obtained [29]. This is because Na+ ion has larger radius (0.98 Å, with polarizability 3 0.255 Å) than lithium ion Li+, hence greater polarizability. When ed with the higher mobility of Li+ compared Na+ ions, they effectively coup about the enhancement of the electrical parameters. However, it is acknowledged that to identify and quantify the individual contributions of the ions, more work is needed. Sinclair and West have suggested the combined usage of impedance and modulus spectroscopic plots to rationalize dielectric properties. It is m activation ined, even though tw ionere invol this is combin to le up to bring also now widely used to analyze ionic conductivities [30]. The plot of the frequency dependence of the imaginary part of electric modulus m at different temperatures is shown in Figure 6. The imaginary part of electric '' m is indicative of energy loss under electric field. '' m is seen to rise smoothly to a peak value and subsequently decreases at higher frequencies at all the temperatures. Ths seem asymmetrical and broader than predicted by the non-ideal Debye behaviour. The low frequency side of the peaks is an indication of the range in which the ions drift to long distances and the position of the peaks is suggestive of the transition from short range to long-range e peak Figure 5. Plot ob and total co , ln t f ln against 1000/T for bulk (dc) nductivity of Na0.5Li0.5Zr 2(PO4)3. Copyright © 2011 SciRes. OJPC 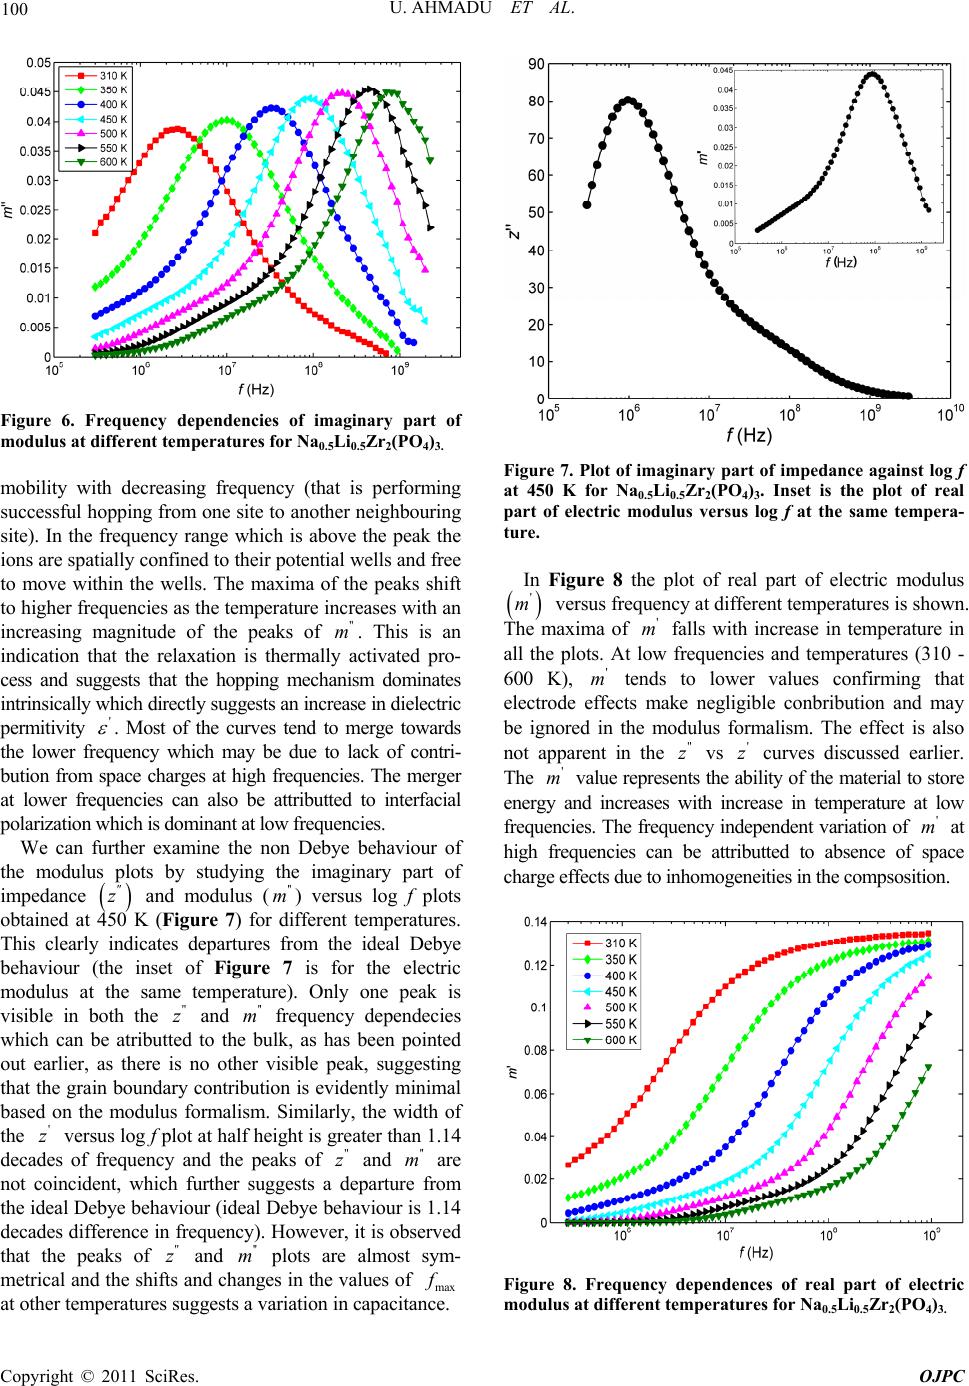 U. AHMADU ET AL. 100 Figure 6. Frequency dependencies of imaginary part of modulus at different temperatures for Na0.5Li0.5Zr2(PO4)3. r neighbouring site). In the frequency range which is above the peak the ions are spatially confined to their potential wells and free to move within the wells. The maxima of the peaks shift to higher frequencies as the temperature increases with an increasing magnitude of the peaks of . This is an indication that the relaxation is thermtivated pro- cess and suggests that the hopping me dominates intrinsically which directly suggests an in in dielectric permitivity mobility with decreasing fequency (that is performing successful hopping from one site to another '' m ally a chanism creas c e ' . Most of the curves tendrge towards the lowerequency which may be du lack of contri- bution from space charges at high frequencies. The merger at lower frequencies can also be attributted to interfacial polarization which is dominant at low frequencies. We can further examine the non Debye behaviour of s btained at 7) for different temp at to me e to fr the modulus plots by studying the imaginary part of impedance z and modulus ('' m) versus log f plot o 450 K (Figure eratures. f f This clearly indicates departures from the ideal Debye behaviour (the inset of Figure 7 is for the electric modulus at the same temperature). Only one peak is visible in both the " z and '' m frequency dependecies which can be atributted to the bulk, as has been pointed out earlier, as there is no other visible peak, suggesting that the grain boundary contribution is evidently minimal based on the modulus formalism. Similarly, the width of the ' z versus log f plot at half height is greater than 1.14 decades of frequency and the peaks of " z and '' m are not coincident, which further suggests a departure from the ideal Debye behaviour (ideal Debye behaviour is 1.14 decades difference in frequency). However, it is observed that the peaks of " z and '' m plots are almost sym- metrical and the shifts and changes in the values omax other temperatures suggests a variation in capacitance. Figure 7. Plot of imaginary part of impedance againstf at 450 K for Na0.5Li0.5Zr2(PO4)3. Inset is the plot of real part of electric modulus versus log f at the same tempera- log ture. In Figure 8 the plot of real part of electric modulus ' m The ma all 600 K be igno not ap The m energy freque high versus frequency at different temperatures is shown. xima of falls with increase in temperature in the plots. At low frequencies and temperatures (310 - ) tends to lower values confirming that ke negligible conbribution and may odulus formalism. The effect is also n curves discussed earlier. rity of the material to store crse in temperature at low ent variation of at tted to absence of ace charge effects due to inhomogeneities in the compsosition. ' m ma m the epres eases cies can b , ' m electrode effects parent i valu and in ncies. The fr frequen red in the e " z vs ents the with in equency e attr ' z abil crea independ ibu ' ' m sp Figure 8. Frequency dependences of real part of eltric modulus at different temperatures for Na0.5Li0.5Zr2(PO4)3. ec Copyright © 2011 SciRes. OJPC 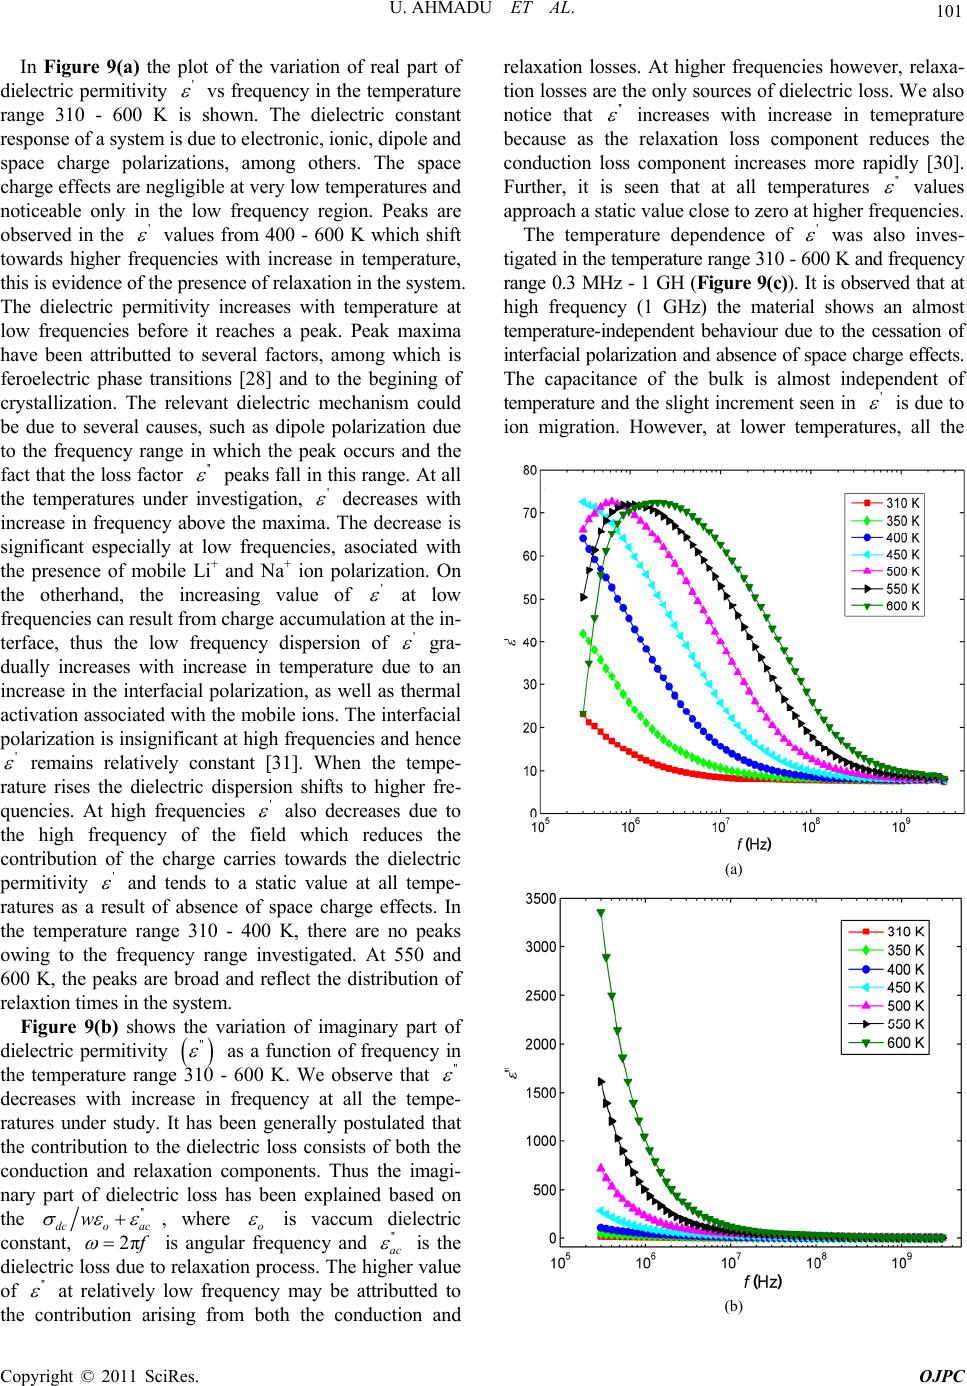 U. AHMADU ET AL. 101 dielectric permitivity In Figure 9(a) the plot of the variation of real part of ' K is s is due to polarizations, gligible y in the low vs frequency in the temperature range 310 - 600 hown. The dielectric constant response of a system electronic, ionic, dipole and space charge among others. The space charge effects are neat very low temperatures and noticeable onlfrequency region. Peaks are observed in the ' fre ion. The relevant y values fr itivity inc ase transitions ral causes, su om 400 - 600 K which shift towards higherquencies with increase in temperature, this is evidence of the presence of relaxation in the system. The dielectric permreases with temperature at low frequencies before it reaches a peak. Peak maxima have been attributted to several factors, among which is feroelectric ph[28] and to the begining of crystallizat dielectric mechanism could be due to sevech as dipole polarization due to the frequenc range in which the peak occurs and the fact that the loss factor '' peaks fall in this range. At all the temperatures under investigation, ' decreases with increase in frequency above the maxima. The decrease is significant especially at low frequencies, asociated with the presence of mobile Li+ and Na+ ion polarization. On the otherhand, the increasing value of ' at low frequencies can result from charge accumulation at the in- terface, thus the low frequency dispersion of ' gra- dually increases with increase in temperature due to an increase in the interfacial polarization, as well as thermal activation associated with the mobile ions. The interfacial polarization is insignificant at high frequencies and hence ' remains relatively constant [31]. When the tempe- rature rises the dielectric dispersion shifts to higher fre- quencies. At high frequencies ' also decreases due to the high frequency of the field which reduces the contribution of the charge carries towards the dielectric permitivity ' and tends to a static value at all tempe- ratures as a result of absence of space charge effects. In the temperature range 310 - 400 K, there are no peaks owing to the frequency range investigated. At 550 and 600 K, the peaks are broad and reflect the distribution of relaxtion times in the system. Figure 9(b) shows the variation of imaginary part of dielectric permitivity " as a function of fruency in the temperature range 310 - 600 K. We observe that '' eq decreases with increase in frequency at all the mpe- ratures under study. It has been generally postulated that the contribution to the dielectric loss consists of both the conduction and relaxation components. Thus the imagi- nary part of dielectric loss has been explained based on e te th '' dco ac w , where o is vaccum dielectric constant, 2πf is angular frequency and '' ac is the dielectric loss due to relaxation pocess. The higher value of '' r at relatively low frequency may be attributted to the contribution arising from both the conduction and relaxation losses. At higher frequencies however, relaxa- tion losses are the only sources of dielectric loss. We also notice that '' increases with increase in temeprature because as the relaxation loss component reduces the conduction loss component increases more rapidly [30]. Further, it is seen that at a '' ll temperatures values approach a static value close to zero at higher frequencies. The temperature dependence of ' was also inves- tigated in the temperature range 310 - 600 K and frequency range 0.3 MHz - 1 GH (Figure 9(c)). It is observed that at high frequency (1 GHz) the material shows an almost temperature-independent behaviour due to the cessation of interfacial polarization and absence of space charge effects. The capacitance of the bulk is almost independent of tempent seen in ' erature and the slight increm is due to ion migrawever, at lower temperatures, all the ti Hoon. (a) (b) Copyright © 2011 SciRes. OJPC  U. AHMADU ET AL. 102 (c) Figure 9. (a) Plots of real and imaginary parts of dielectric permitivity against frequenc different temperatures for y at Na0.5Li0.5Zr2(PO4)3; (b) Imaginary part of dielectric permi- tivity against frequency at different temperatures for the same composition; (c) Real part of dielectric permitivity against temperature at different frequencies (0.3 MHz - 1 GHz). plots show sharp increase in ' with increase in tempe- rature, particularly at 0.3 - 10 MHz. At other frequencies (0.3 - 0.54 MHz ) the plots also attain sharp peaks in the value of ' at 460 K. The increase in ' leading to the peak can be attributted to interfacial polarization and to the beggining of crystallization [32]. During the crystal- lization process the interfaces that would be created bet- ween the cryststallites with different dielectric constants and conductivities could be the origin of charge accumulation and interfacial polarization. However, the subsequent decr- ease in the value of ' above 460 K is due to reduction of interfacial polarizatiand loo. the electrical and dielectric properties of mixed lkali ions (Li+, Na+) in the composition NaLi Zr on w ionic mbility 4. Conclusions We have used multiple characterization methods (TGA/ DTA, XRD/SEM and IS) for the the purpose of inves- tigating a0.5 0.52 (PO4)3. A high value of b was observed which shows that the conducitvity enhancement was due to higher mo- bility and polarizability of the mobile ions. The thermal studies showed that there is no significan thermal effects as to affect structural phase change which can affect the conductivity in the temperature and frequency range investigated. A dc conductivity maximum of 0.25 S/m was obtained at 580 K which is within the application range. The variation of the dielectric permitivity showed that the material exhibited dielectric relaxation properties at specific frequencies and temperatures (450 - 600 K). Also, peaks were observed in the tempera t ture depen- itivity around 469 K. . References dence of the dielectric perm 5 [1] B. Angadi, V. M. Jali, M. T. Lagare, N. S. Kini, A. M. Umarji, R. Kumar, S. K. Arora and D. Kanjilal, “50 MeV Li3+ Irradiation Effects on the Thermal Expansion of Ca1_xSrxZr4P6O24,” Nuclear Instruments and Methods in Physics Research B, Vol. 187, No. 1, 2002, pp. 87-94. doi:10.1016/S0168-583X(01)00847-3 [2] S. Kormaneni, E. Lenain and R. Roy, “Thermal Expan- sion of NH4Zr2(PO4)3,” Journal of Materials Science Letters, Vol. 5, No. 1, 1986, pp. 1-3. doi:10.1007/BF01671415 [3] I. W. Donald, B. L. Metcalfe and R. N. J. Taylor, “The Immobilization of High Level Radioactive Wastes Using Ceramics and Glasses,” Journal of Materials Science, Vol, 32, No. 22, 1997, pp. 5851-5887. doi:10.1023/A:1018646507438 [4] N. Anantharamulu, G. Prasad and M. Vithal, “Preparation, Characterization and Conductivity Studies of Li3–2xAl2–x Sbx(PO4)3,” Bulletin of Materials Science, Vol. 31, 2008, pp.133-138. No. 2, doi:10.1007/s12034-008-0023-3 indune, Z. Kanepe, J. Ronis, A. Kažeonis liukas, “Synthesis Structure and Electric [5] T. Ŝalkus, A. D and A. E. Or Properties of L1+xScxZ2-x(PO4)3(x = 0.1,0.2,0.3),” Lithua- nian Journal of Physics, Vol. 46, 2006, pp. 361-366. doi:10.3952/lithjphys.46314 [6] H. Kang and N. Cho, “Phase Formation, Sintering Be- havior, and Electrical Characteristics of NASICON Com- pounds,” Journal of Materials Science, Vol. 34, No. 2 1999, pp. 5005-5013. doi:10.1023/A:10 0, 04784327302 [7] F. E. Mouahid, M. Zahir, P. M. Maldonado-Manso, S. Bruque, E. R. Losilla, M. A. G. Aranda, A. Rivera, C. Leona and J. Santamaria, “Na-Li Exc Al (PO )(0.6 ≤ x ≤ 0.9) N hange of Na1+xTi2-x x4 3ASICON Series: A Rietveld and Impedance Study,” Journal of Materials Chemistry, Vol. 11, 2001, pp. 3258-3263. doi:10.1039/b102918p [8] K. Oda, S. Takase and Y. Shimizu, “Preparation of High Conductive Lithium Ceramic,” Material Vol. 544-545, 2007, pp. 1033-1036. s Science Forum, doi:10.4028/www.scientific.net/MSF.544-545.1033 [9] P. S. Tantri, K. Greetha, A. M. Umarji and S. K. Rama- sesha, “Thermal Expansion Behaviour of Barium and Strontium Zirconium Phosphates,” Bulletin of Materials Science, Vol. 23, No. 6, 2000, pp. 491-499. doi:10.1007/BF02903889 [10] V. I. Petkov, A. I. Orlova, I. G. Trucbach, Y. A. Asabina, V. T. Demarin and V. S. Kurazhkovskaya, “Immobili tion of Nuclear Waste Mate za- rials Containing Different Alkali Elements in Single-Phase NZP-Based Ceramics,” Czech Journal of Physics, Vol. 53, No. 1, 2003, pp. A639 -A648. doi:10.1007/s10582-003-0082-z A. H. Naik, N. V. Thakkar, S. R. Darwatkar, K. D.[11] S. Mudher and V. V. Venagopal, “Microwave Assisted Low Copyright © 2011 SciRes. OJPC 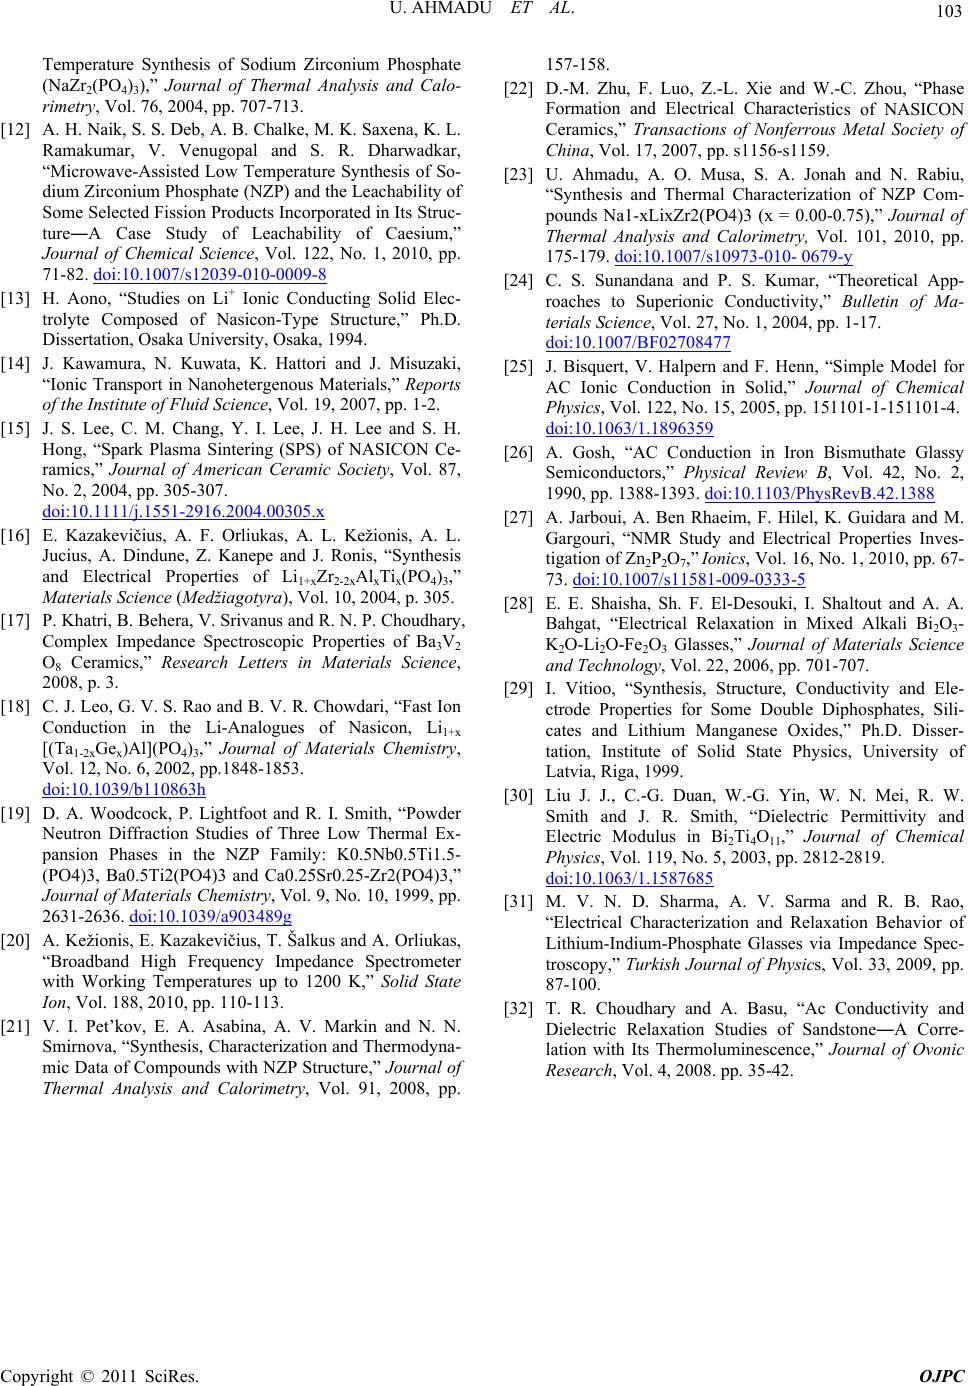 U. AHMADU ET AL. Copyright © 2011 SciRes. OJPC 103 the Leachability of Temperature Synthesis of Sodium Zirconium Phosphate (NaZr2(PO4)3),” Journal of Thermal Analysis and Calo- rimetry, Vol. 76, 2004, pp. 707-713. [12] A. H. Naik, S. S. Deb, A. B. Chalke, M. K. Saxena, K. L. Ramakumar, V. Venugopal and S. R. Dharwadkar, “Microwave-Assisted Low Temperature Synthesis of So- dium Zirconium Phosphate (NZP) and Some Selected Fission Products Incorporated in Its S truc- ture―A Case Study of Leachability of Caesium,” Journal of Chemical Science, Vol. 122, No. 1, 2010, pp. 71-82. doi:10.1007/s12039-010-0009-8 [13] H. Aono, “Studies on Li+ Ionic Conducting trolyte Composed of Na Solid Elec- sicon-Type Structure,” Ph.D NASICON Ce- . Dissertation, Osaka University, Osaka, 1994. [14] J. Kawamura, N. Kuwata, K. Hattori and J. Misuzaki, “Ionic Transport in Nanohetergenous Materials,” Reports of the Institute of Fluid Science, Vol. 19, 2007, pp. 1-2. [15] J. S. Lee, C. M. Chang, Y. I. Lee, J. H. Lee and S. H. Hong, “Spark Plasma Sintering (SPS) of ramics,” Journal of American Ceramic Society, Vol. 87, No. 2, 2004, pp. 305-307. doi:10.1111/j.1551-2916.2004.00305.x [16] E. Kazakevičius, A. F. Orliukas, A. L. Kežionis, A. L. Jucius, A. Dindune, Z. Kanepe and J. Ronis, “Synthesis Li and Electrical Properties of Li1+xZr2-2xAlxTix(PO4)3,” Materials Science (Medžiagotyra), Vol. 10, 2004, p. 305. [17] P. Khatri, B. Behera, V. Srivanus and R. N. P. Choudhary, Complex Impedance Spectroscopic Properties of Ba3V2 O8 Ceramics,” Research Letters in Materials Science, 2008, p. 3. [18] C. J. Leo, G. V. S. Rao and B. V. R. Chowdari, “Fast Ion Conduction in the Li-Analogues of Nasicon, 1+x [(Ta1-2xGex)Al](PO4)3,” Journal of Materials Chemistry, Vol. 12, No. 6, 2002, pp.1848-1853. doi:10.1039/b110863h [19] D. A. Woodcock, P. Lightfoot and R. I. Smith, “Powder Neutron Diffraction Studies of Three Low Thermal Ex- pansion Phases in the NZP Family: K0.5Nb0.5Ti1.5- (PO4)3, Ba0.5Ti2(PO4)3 and Ca0.25Sr0.25-Zr2(PO4)3,” Journal of Materials Chemistry, Vol. 9, No. 10, 1999, pp. 2631-2636. doi:10.1039/a903489g [20] A. Kežionis, E. Kazakevičiu “Broadband High Frequency Impedan s, T. Šalkus and A. Orliukas ce Spectrometer ristics of NASICON rization of NZP Com- , with Working Temperatures up to 1200 K,” Solid State Ion, Vol. 188, 2010, pp. 110-113. [21] V. I. Pet’kov, E. A. Asabina, A. V. Markin and N. N. Smirnova, “Synthesis, Characterization and Thermodyna- mic Data of Compounds with NZP Structure,” Journal of Thermal Analysis and Calorimetry, Vol. 91, 2008, pp. 157-158. [22] D.-M. Zhu, F. Luo, Z.-L. Xie and W.-C. Zhou, “Phase Formation and Electrical Characte Ceramics,” Transactions of Nonferrous Metal Society of China, Vol. 17, 2007, pp. s1156-s1159. [23] U. Ahmadu, A. O. Musa, S. A. Jonah and N. Rabiu, “Synthesis and Thermal Characte pounds Na1-xLixZr2(PO4)3 (x = 0.00-0.75),” Journal of Thermal Analysis and Calorimetry, Vol. 101, 2010, pp. 175-179. doi:10.1007/s10973-010- 0679-y [24] C. S. Sunandana and P. S. Kumar, “Theoretical App- roaches to Superionic Conductivity,” Bulletin of Ma- terials Science, Vol. 27, No. 1, 2004, pp. 1-17. doi:10.1007/BF02708477 [25] J. Bisquert, V. Halpern and F. Henn, “Simple Model for AC Ionic Conduction in Solid,” Journal of Chemical Physics, Vol. 122, No. 15, 2005, pp. 151101-1-151101-4. doi:10.1063/1.1896359 [26] A. Gosh, “AC Conduction in Iron Bismuthate Glassy Semiconductors,” Physical Review B, Vol. 42, No. 2, 1990, pp. 1388-1393. doi:10.1103/PhysRevB.42.1388 0, pp. 67- 9-0333-5 [27] A. Jarboui, A. Ben Rhaeim, F. Hilel, K. Guidara and M. Gargouri, “NMR Study and Electrical Properties Inves- tigation of Zn2P2O7,” Ionics, Vol. 16, No. 1, 201 73. doi:10.1007/s11581-00 , 2006, pp. 701-707. er- Permittivity and [28] E. E. Shaisha, Sh. F. El-Desouki, I. Shaltout and A. A. Bahgat, “Electrical Relaxation in Mixed Alkali Bi2O3- K2O-Li2O-Fe2O3 Glasses,” Journal of Materials Science and Technology, Vol. 22 [29] I. Vitioo, “Synthesis, Structure, Conductivity and Ele- ctrode Properties for Some Double Diphosphates, Sili- cates and Lithium Manganese Oxides,” Ph.D. Diss tation, Institute of Solid State Physics, University of Latvia, Riga, 1999. [30] Liu J. J., C.-G. Duan, W.-G. Yin, W. N. Mei, R. W. Smith and J. R. Smith, “Dielectric Electric Modulus in Bi2Ti4O11,” Journal of Chemical Physics, Vol. 119, No. 5, 2003, pp. 2812-2819. doi:10.1063/1.1587685 [31] M. V. N. D. Sharma, A. V. Sarma and R. B. Rao, asu, “Ac Conductivity and “Electrical Characterization and Relaxation Behavior of Lithium-Indium-Phosphate Glasses via Impedance Spec- troscopy,” Turkish Journal of Physics, Vol. 33, 2009, pp. 87-100. [32] T. R. Choudhary and A. B Dielectric Relaxation Studies of Sandstone―A Corre- lation with Its Thermoluminescence,” Journal of Ovonic Research, Vol. 4, 2008. pp. 35-42.
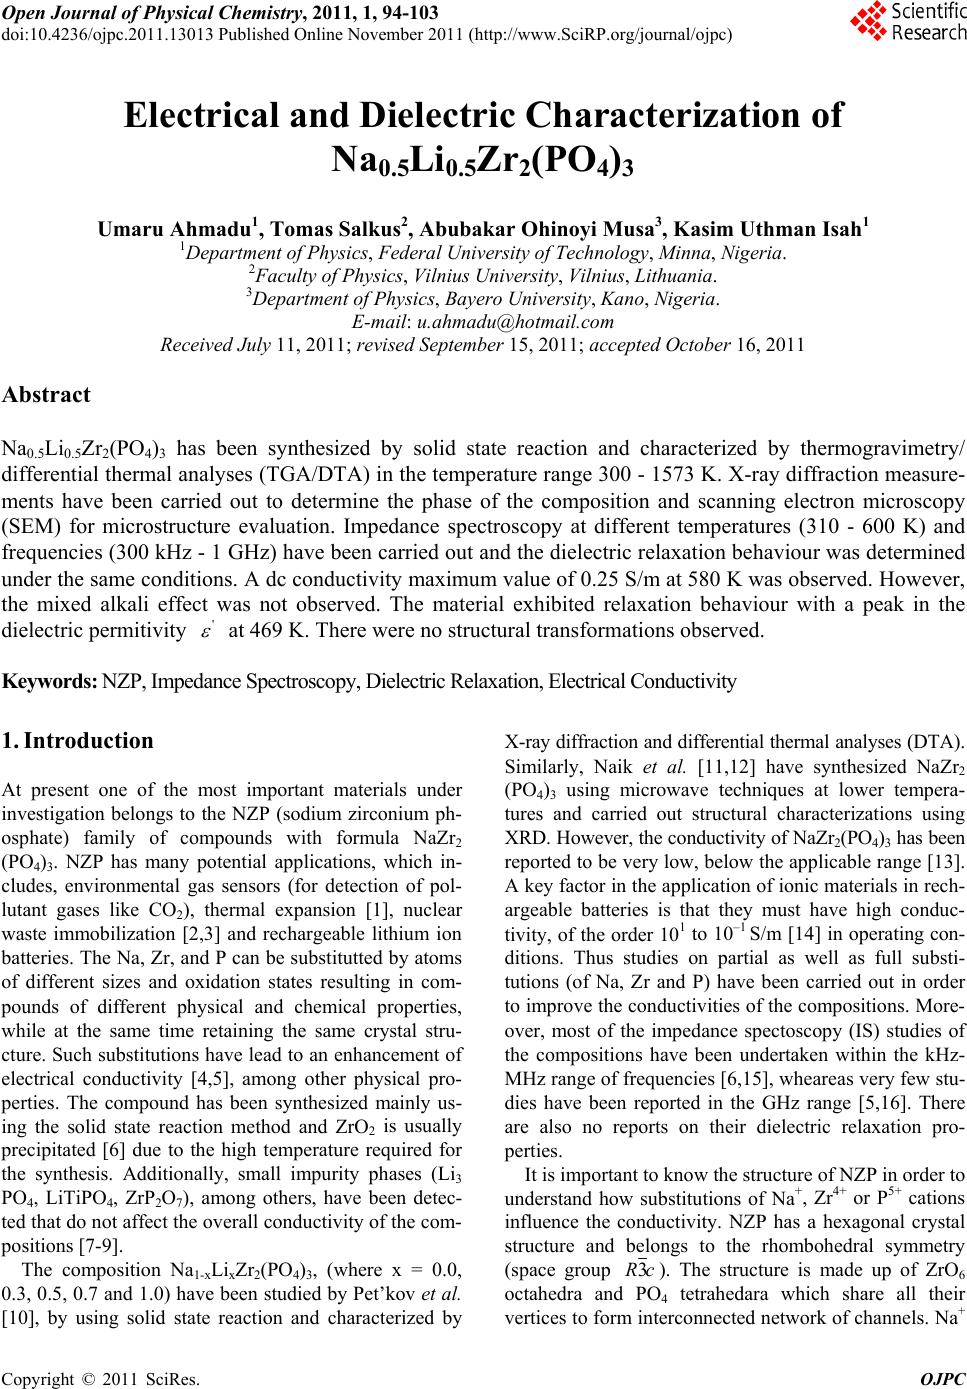
|