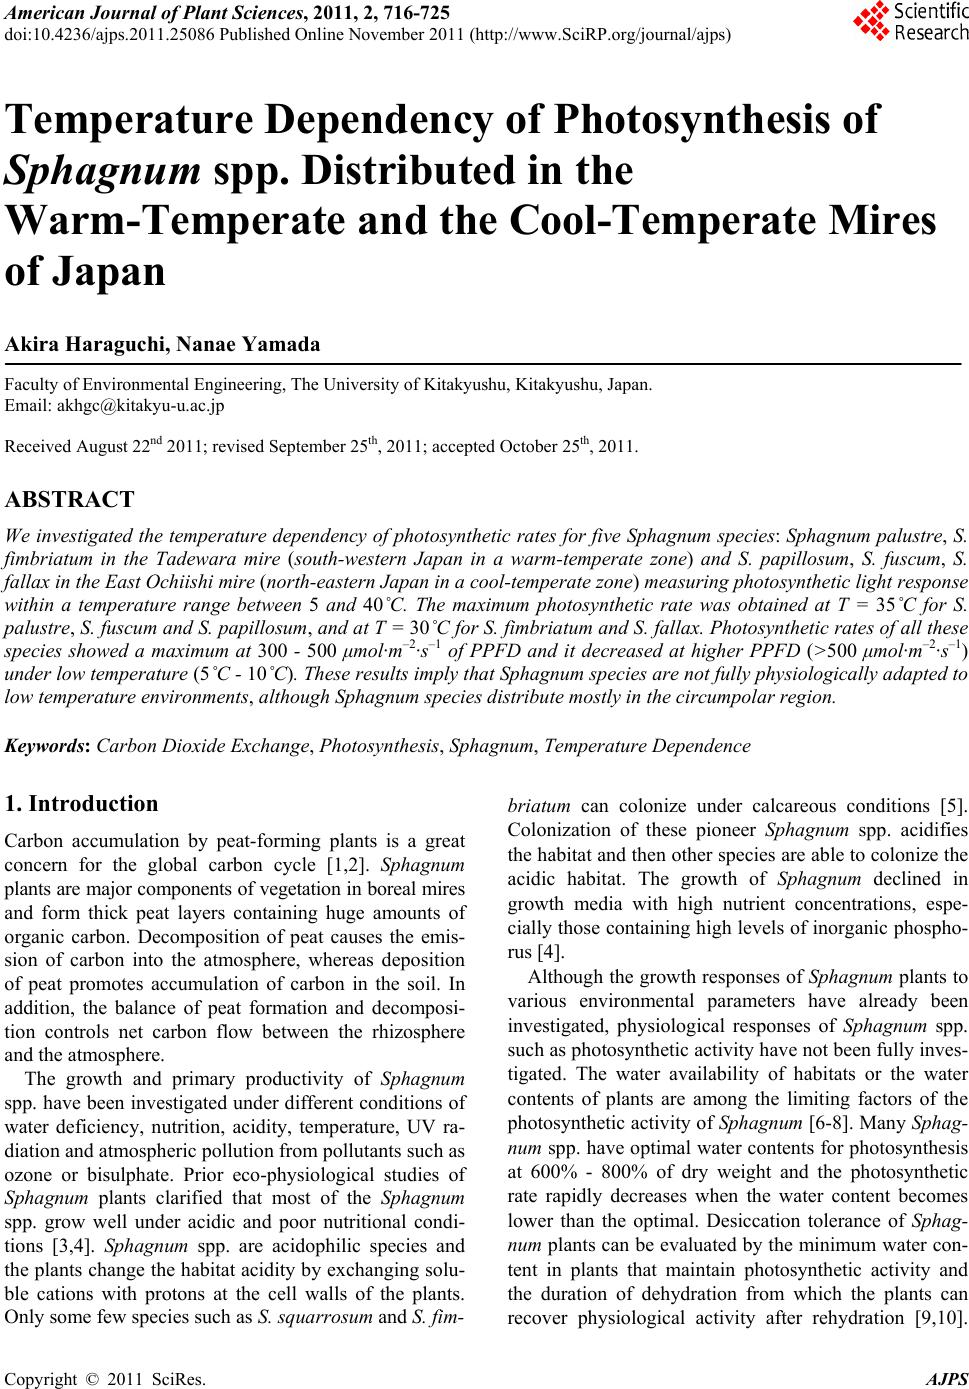
 American Journal of Plant Sciences, 2011, 2, 716-725 doi:10.4236/ajps.2011.25086 Published Online November 2011 (http://www.SciRP.org/journal/ajps) Copyright © 2011 SciRes. AJPS Temperature Dependency of Photosynthesis of Sphagnum spp. Distributed in the Warm-Temperate and the Cool-Temperate Mires of Japan Akira Haraguchi, Nanae Yamada Faculty of Environmental Engineering, The University of Kitakyushu, Kitakyushu, Japan. Email: akhgc@kitakyu-u.ac.jp Received August 22nd 2011; revised September 25th, 2011; accepted October 25th, 2011. ABSTRACT We investigated the temperature dependency of photosynthetic rates for five Sphagnum species: Sphagnum palustre, S. fimbriatum in the Tadewara mire (south-western Japan in a warm-temperate zone) and S. papillosum, S. fuscum, S. fallax in the East Ochiishi mire (north-eastern Japan in a cool-temperate zone) measuring photosynthetic light response within a temperature range between 5 and 40˚C. The maximum photosynthetic rate was obtained at T = 35˚C for S. palustre, S. fuscum and S. papillosum, and at T = 30˚C for S. fimbriatum and S. fallax. Photosynthetic rates of all these species showed a maximum at 300 - 500 μmol·m–2·s–1 of PPFD and it decreased at higher PPFD (>500 μmol·m–2·s–1) under low temperature (5˚C - 10˚C). These results imply that Sphagnum species are not fully physiologically adapted to low temperature environments, although Sphagnum species distribute mostly in the circumpolar region. Keywords: Carbon Dioxide Exchange, Photosynthesis, Sphagnum, Temperature Dependence 1. Introduction Carbon accumulation by peat-forming plants is a great concern for the global carbon cycle [1,2]. Sphagnum plants are major components of vegetation in boreal mires and form thick peat layers containing huge amounts of organic carbon. Decomposition of peat causes the emis- sion of carbon into the atmosphere, whereas deposition of peat promotes accumulation of carbon in the soil. In addition, the balance of peat formation and decomposi- tion controls net carbon flow between the rhizosphere and the atmosphere. The growth and primary productivity of Sphagnum spp. have been investigated und er different conditions of water deficiency, nutrition, acidity, temperature, UV ra- diation and atmospheric pollution from pollutants such as ozone or bisulphate. Prior eco-physiological studies of Sphagnum plants clarified that most of the Sphagnum spp. grow well under acidic and poor nutritional condi- tions [3,4]. Sphagnum spp. are acidophilic species and the plants change the habitat acidity by exchanging solu- ble cations with protons at the cell walls of the plants. Only some few species such as S. squarrosum and S. fim- briatum can colonize under calcareous conditions [5]. Colonization of these pioneer Sphagnum spp. acidifies the habitat and then other sp ecies are able to colonize the acidic habitat. The growth of Sphagnum declined in growth media with high nutrient concentrations, espe- cially those containing high levels of inorganic phospho- rus [4]. Although th e growth responses of Sphagnum plants to various environmental parameters have already been investigated, physiological responses of Sphagnum spp. such as photosynthetic activity h ave not been fully inves- tigated. The water availability of habitats or the water contents of plants are among the limiting factors of the photosynthetic activity o f Sphagnum [6-8 ]. Many Sphag- num spp. have optimal water contents for photosynthesis at 600% - 800% of dry weight and the photosynthetic rate rapidly decreases when the water content becomes lower than the optimal. Desiccation tolerance of Sphag- num plants can be evaluated by the minimum water con- tent in plants that maintain photosynthetic activity and the duration of dehydration from which the plants can recover physiological activity after rehydration [9,10]. 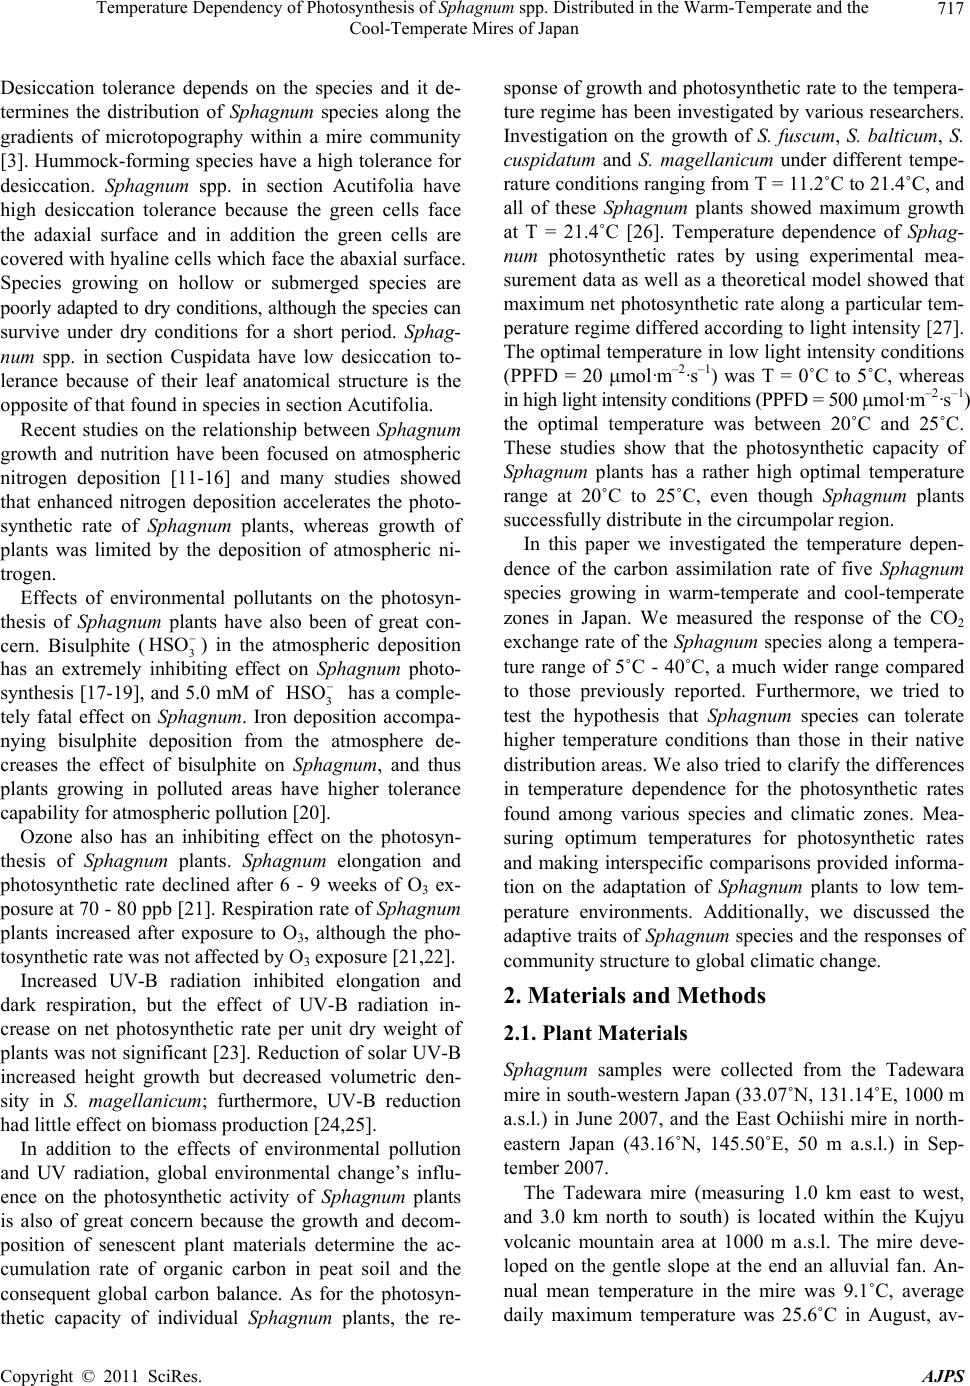 Temperature Dependency of Photosynthesis of Sphagnum spp. Distributed in the Warm-Temperate and the 717 Cool-Temperate Mires of Japan Desiccation tolerance depends on the species and it de- termines the distribution of Sphagnum species along the gradients of microtopography within a mire community [3]. Hummock-forming species have a high tolerance for desiccation. Sphagnum spp. in section Acutifolia have high desiccation tolerance because the green cells face the adaxial surface and in addition the green cells are covered with hyaline cells which face the abaxial surface. Species growing on hollow or submerged species are poorly adapted to dry conditions, although the species can survive under dry conditions for a short period. Sphag- num spp. in section Cuspidata have low desiccation to- lerance because of their leaf anatomical structure is the opposite of that found in species in section Acutifolia. Recent studies on the relationship between Sphagnum growth and nutrition have been focused on atmospheric nitrogen deposition [11-16] and many studies showed that enhanced nitrogen deposition accelerates the photo- synthetic rate of Sphagnum plants, whereas growth of plants was limited by the deposition of atmospheric ni- trogen. Effects of environmental pollutants on the photosyn- thesis of Sphagnum plants have also been of great con- cern. Bisulphite (3) in the atmospheric deposition has an extremely inhibiting effect on Sphagnum photo- synthesis [17-19], and 5.0 mM of 3 has a comple- tely fatal effect on Sphagnum. Iron deposition accompa- nying bisulphite deposition from the atmosphere de- creases the effect of bisulphite on Sphagnum, and thus plants growing in polluted areas have higher tolerance capability for atmospheric pollution [20]. HSO HSO Ozone also has an inhibiting effect on the photosyn- thesis of Sphagnum plants. Sphagnum elongation and photosynthetic rate declined after 6 - 9 weeks of O3 ex- posure at 70 - 80 ppb [21]. Respiration rate of Sphagnum plants increased after exposure to O3, although the pho- tosynthetic rate was not affected by O3 exposure [21,22]. Increased UV-B radiation inhibited elongation and dark respiration, but the effect of UV-B radiation in- crease on net photosynthetic rate per unit dry weight of plants was not significant [23]. Reduction of solar UV-B increased height growth but decreased volumetric den- sity in S. magellanicum; furthermore, UV-B reduction had little effect on biomass production [24,25]. In addition to the effects of environmental pollution and UV radiation, global environmental change’s influ- ence on the photosynthetic activity of Sphagnum plants is also of great concern because the growth and decom- position of senescent plant materials determine the ac- cumulation rate of organic carbon in peat soil and the consequent global carbon balance. As for the photosyn- thetic capacity of individual Sphagnum plants, the re- sponse of growth and photosynth etic rate to the tempera- ture regime has been investigated by various researchers. Investigation on the growth of S. fuscum, S. balticum, S. cuspidatum and S. magellanicum under different tempe- rature conditions rang ing from T = 11.2˚C to 21.4˚C, and all of these Sphagnum plants showed maximum growth at T = 21.4˚C [26]. Temperature dependence of Sphag- num photosynthetic rates by using experimental mea- surement data as well as a theoretical model showed that maximum net photosynthetic rate along a particular tem- perature regime differed according to light intensity [27]. The optimal temperature in low light inten sity conditions (PPFD = 20 mol·m–2·s–1) was T = 0˚C to 5˚C, whereas in high light intensity conditions (PPFD = 500 mol·m–2·s–1) the optimal temperature was between 20˚C and 25˚C. These studies show that the photosynthetic capacity of Sphagnum plants has a rather high optimal temperature range at 20˚C to 25˚C, even though Sphagnum plants successfully distribute in the circum po lar region. In this paper we investigated the temperature depen- dence of the carbon assimilation rate of five Sphagnum species growing in warm-temperate and cool-temperate zones in Japan. We measured the response of the CO2 exchange rate of the Sphagnum species along a tempera- ture range of 5˚C - 40˚C, a much wider range compared to those previously reported. Furthermore, we tried to test the hypothesis that Sphagnum species can tolerate higher temperature conditions than those in their native distribution areas. We also tried to clarify the differences in temperature dependence for the photosynthetic rates found among various species and climatic zones. Mea- suring optimum temperatures for photosynthetic rates and making interspecific comparisons provided informa- tion on the adaptation of Sphagnum plants to low tem- perature environments. Additionally, we discussed the adaptive traits of Sphagnum species and the responses of community structure to global climatic change. 2. Materials and Methods 2.1. Plant Materials Sphagnum samples were collected from the Tadewara mire in south-western Japan (33.07˚N, 131.14˚E, 1000 m a.s.l.) in June 2007, and the East Ochiishi mire in north- eastern Japan (43.16˚N, 145.50˚E, 50 m a.s.l.) in Sep- tember 2007. The Tadewara mire (measuring 1.0 km east to west, and 3.0 km north to south) is located within the Kujyu volcanic mountain area at 1000 m a.s.l. The mire deve- loped on the gentle slope at the end an alluvial fan. An- nual mean temperature in the mire was 9.1˚C, average daily maximum temperature was 25.6˚C in August, av- Copyright © 2011 SciRes. AJPS 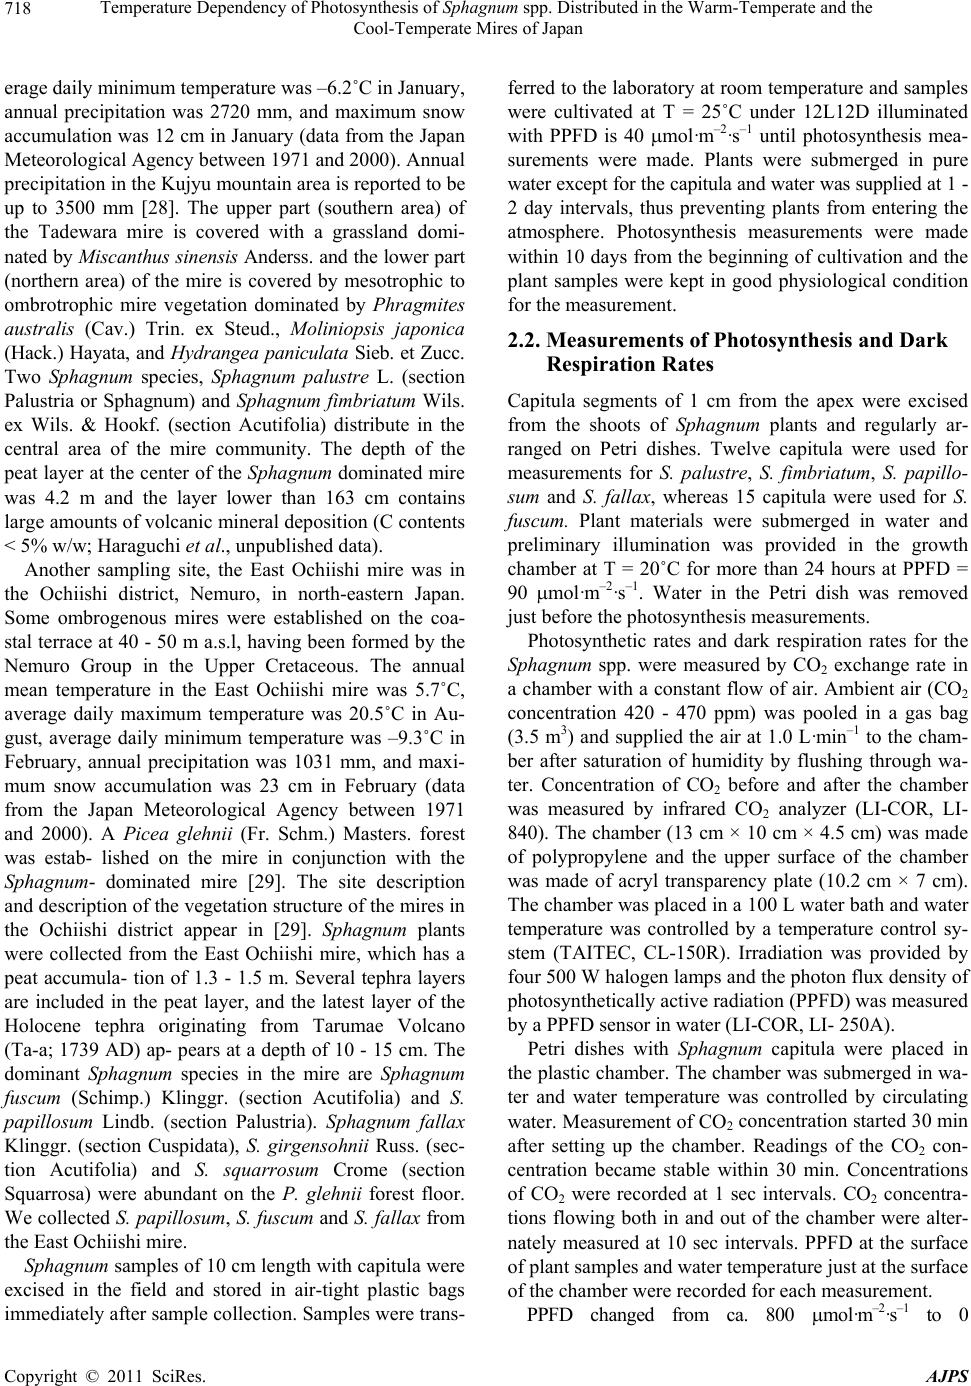 Temperature Dependency of Photosynthesis of Sphagnum spp. Distributed in the Warm-Temperate and the 718 Cool-Temperate Mires of Japan erage daily minimum temperature was –6.2˚C in January, annual precipitation was 2720 mm, and maximum snow accumulation was 12 cm in January (data from the Japan Meteorological Agency between 1971 and 2000). Annual precipitation in the Kujyu mountain area is reported to be up to 3500 mm [28]. The upper part (southern area) of the Tadewara mire is covered with a grassland domi- nated by Miscanthus sinensis Anderss. and the lower part (northern area) of the mire is covered by mesotrophic to ombrotrophic mire vegetation dominated by Phragmites australis (Cav.) Trin. ex Steud., Moliniopsis japonica (Hack.) Hayata, and Hydrangea paniculata Sieb. et Zucc. Two Sphagnum species, Sphagnum palustre L. (section Palustria or Sphagnum) and Sphagnum fimbriatum Wils. ex Wils. & Hookf. (section Acutifolia) distribute in the central area of the mire community. The depth of the peat layer at the center of the Sphagnum dominated mire was 4.2 m and the layer lower than 163 cm contains large amounts of volcanic mineral deposition (C conten ts < 5% w/w; Haraguchi et al. , un p ubl ished data ). Another sampling site, the East Ochiishi mire was in the Ochiishi district, Nemuro, in north-eastern Japan. Some ombrogenous mires were established on the coa- stal terrace at 40 - 50 m a.s.l, having been formed by the Nemuro Group in the Upper Cretaceous. The annual mean temperature in the East Ochiishi mire was 5.7˚C, average daily maximum temperature was 20.5˚C in Au- gust, average daily minimum temperature was –9.3˚C in February, annual precipitation was 1031 mm, and maxi- mum snow accumulation was 23 cm in February (data from the Japan Meteorological Agency between 1971 and 2000). A Picea glehnii (Fr. Schm.) Masters. forest was estab- lished on the mire in conjunction with the Sphagnum- dominated mire [29]. The site description and description of the vegetation structure of the mires in the Ochiishi district appear in [29]. Sphagnum plants were collected from the East Ochiishi mire, which has a peat accumula- tion of 1.3 - 1.5 m. Several tephra layers are included in the peat layer, and the latest layer of the Holocene tephra originating from Tarumae Volcano (Ta-a; 1739 AD) ap- pear s at a depth of 10 - 15 cm. The dominant Sphagnum species in the mire are Sphagnum fuscum (Schimp.) Klinggr. (section Acutifolia) and S. papillosu m Lindb. (section Palustria). Sphagnum fallax Klinggr. (section Cuspidata), S. girgensohnii Russ. (sec- tion Acutifolia) and S. squarrosum Crome (section Squarrosa) were abundant on the P. glehnii forest floor. We collected S. papillosum, S. fuscum and S. fallax from the East Ochiishi mire. Sphagnum samples of 10 cm leng th with capitula were excised in the field and stored in air-tight plastic bags immediately after sample collection. Samples were trans- ferred to the laboratory at room temperature and samples were cultivated at T = 25˚C under 12L12D illuminated with PPFD is 40 mol·m–2·s–1 until photosynthesis mea- surements were made. Plants were submerged in pure water except for the capitula and water was supplied at 1 - 2 day intervals, thus preventing plants from entering the atmosphere. Photosynthesis measurements were made within 10 days fro m the beginn ing of cultivatio n and the plant samples were kept in good physiological condition for the measurement. 2.2. Measurements of Photosynthesis and Dark Respiration Rates Capitula segments of 1 cm from the apex were excised from the shoots of Sphagnum plants and regularly ar- ranged on Petri dishes. Twelve capitula were used for measurements for S. palustre, S. fimbriatum, S. papillo- sum and S. fallax, whereas 15 capitula were used for S. fuscum. Plant materials were submerged in water and preliminary illumination was provided in the growth chamber at T = 20˚C for more than 24 hours at PPFD = 90 mol·m–2·s–1. Water in the Petri dish was removed just before the photosynthesis measurements. Photosynthetic rates and dark respiration rates for the Sphagnum spp. were measured by CO2 exchange rate in a chamber with a constant flow of air. Ambient air (CO2 concentration 420 - 470 ppm) was pooled in a gas bag (3.5 m3) and supplied the air at 1.0 L·min–1 to the cham- ber after saturation of humidity by flushing through wa- ter. Concentration of CO2 before and after the chamber was measured by infrared CO2 analyzer (LI-COR, LI- 840). The chamber (13 cm × 10 cm × 4.5 cm) was made of polypropylene and the upper surface of the chamber was made of acryl transparency plate (10.2 cm × 7 cm). The chamber was placed in a 100 L water bath and water temperature was controlled by a temperature control sy- stem (TAITEC, CL-150R). Irradiation was provided by four 500 W halogen lamps and the photon flux density of photosynthetically active radiation (PPFD) was measured by a PPFD sensor in water (LI-COR, LI- 250A). Petri dishes with Sphagnum capitula were placed in the plastic chamber. The chamber was submerged in wa- ter and water temperature was controlled by circulating water. Measurement of CO2 concentration started 30 min after setting up the chamber. Readings of the CO2 con- centration became stable within 30 min. Concentrations of CO2 were recorded at 1 sec intervals. CO2 concentra- tions flowing both in and out of the chamber were alter- nately measured at 10 sec intervals. PPFD at the surface of plant samples and water temperature just at the surface of the chamber were recorded for each measurement. PPFD changed from ca. 800 mol· m–2·s–1 to 0 Copyright © 2011 SciRes. AJPS 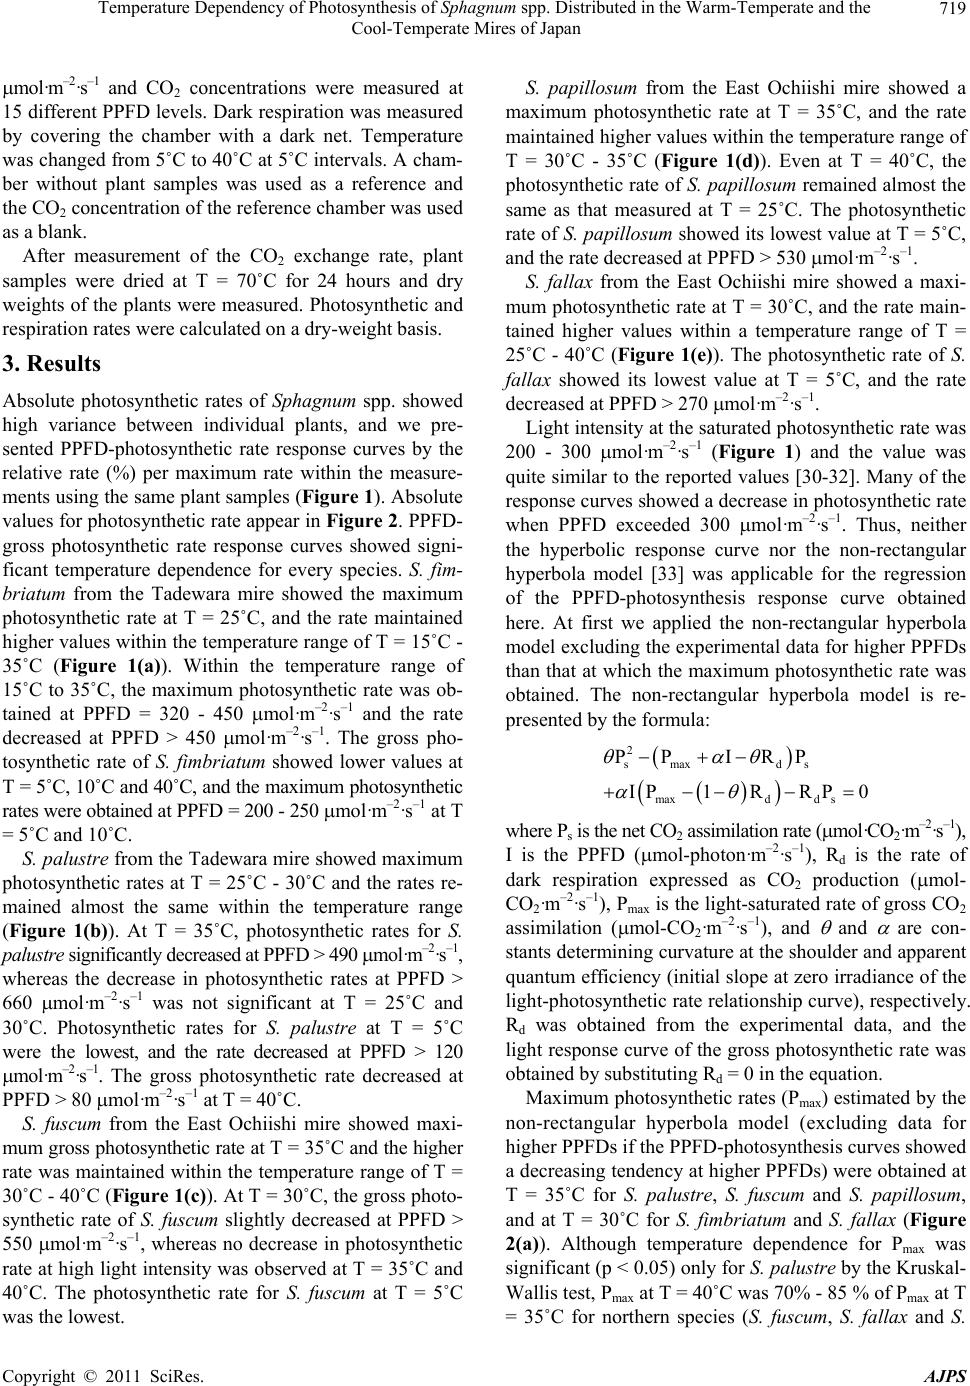 Temperature Dependency of Photosynthesis of Sphagnum spp. Distributed in the Warm-Temperate and the 719 Cool-Temperate Mires of Japan mol·m–2·s–1 and CO2 concentrations were measured at 15 different PPFD levels. Dark respiration was measured by covering the chamber with a dark net. Temperature was ch anged from 5 ˚C to 40˚C at 5˚C intervals. A cham- ber without plant samples was used as a reference and the CO2 concentration of the reference chamber was used as a blank. After measurement of the CO2 exchange rate, plant samples were dried at T = 70˚C for 24 hours and dry weights of the plants were measured. Photosynthetic and respiration rates were calculated on a dry-weight basis. 3. Results Absolute photosynthetic rates of Sphagnum spp. showed high variance between individual plants, and we pre- sented PPFD-photosynthetic rate response curves by the relative rate (%) per maximum rate within the measure- ments using the same plant samples (Figure 1). Absolute values for photosynthetic rate appear in Figure 2. PPFD- gross photosynthetic rate response curves showed signi- ficant temperature dependence for every species. S. fim- briatum from the Tadewara mire showed the maximum photosynthetic rate at T = 25˚C, and the rate maintained higher values with in the temperature range of T = 15˚C - 35˚C (Figure 1(a)). Within the temperature range of 15˚C to 35˚C, the maximum photosynthetic rate was ob- tained at PPFD = 320 - 450 mo l ·m–2·s–1 and the rate decreased at PPFD > 450 mol·m–2·s–1. The gross pho- tosynthetic rate of S. fimbriatum showed lower values at T = 5˚C, 10˚C and 40˚C, and the maximum photosynthetic rates were obtained at PPFD = 200 - 250mol ·m–2·s–1 at T = 5˚C and 10˚C. S. palustre from the Tadewara mire showed maximum photosynthetic rates at T = 25˚C - 30˚C and the rates re- mained almost the same within the temperature range (Figure 1(b)). At T = 35˚C, photosynthetic rates for S. palustre significantly decreased at PPFD > 490 mol·m–2·s–1, whereas the decrease in photosynthetic rates at PPFD > 660 mo l ·m–2·s–1 was not significant at T = 25˚C and 30˚C. Photosynthetic rates for S. palustre at T = 5˚C were the lowest, and the rate decreased at PPFD > 120 mol·m–2·s–1. The gross photosynthetic rate decreased at PPFD > 80 mol·m–2·s–1 at T = 40˚C. S. fuscum from the East Ochiishi mire showed maxi- mum gross photosynthetic rate at T = 35˚C and the higher rate was maintained within the temperature range of T = 30˚C - 40˚C (Figure 1(c)). At T = 30˚C, the gross photo- synthetic rate of S. fuscum slightly decreased at PPFD > 550 mo l·m–2·s–1, whereas no decrease in photosynthetic rate at high light intensity was observ ed at T = 35˚C and 40˚C. The photosynthetic rate for S. fuscum at T = 5˚C was the lowest. S. papillosum from the East Ochiishi mire showed a maximum photosynthetic rate at T = 35˚C, and the rate maintained higher values within the temperature range of T = 30˚C - 35˚C (Figure 1(d)). Even at T = 40˚C, the photosynthetic rate of S. papillosum remained almost the same as that measured at T = 25˚C. The photosynthetic rate of S. papillosum showed its lowest value at T = 5˚C, and the rate decreased at PPFD > 530 mol·m–2·s–1. S. fallax from the East Ochiishi mire showed a maxi- mum photosynthetic rate at T = 30˚C, and the rate main- tained higher values within a temperature range of T = 25˚C - 40˚C (Figure 1(e)). The photosynthetic rate of S. fallax showed its lowest value at T = 5˚C, and the rate decreased at PPFD > 270 mol·m–2·s–1. Light intensity at th e saturated photosynthetic rate was 200 - 300 mol·m–2·s–1 (Figure 1) and the value was quite similar to the reported values [30-32]. Many of the respons e cur ves show ed a de cre ase in pho tosyn the tic ra te when PPFD exceeded 300 mol·m–2·s–1. Thus, neither the hyperbolic response curve nor the non-rectangular hyperbola model [33] was applicable for the regression of the PPFD-photosynthesis response curve obtained here. At first we applied the non-rectangular hyperbola model excluding the experimental data for higher PPFDs than that at which the maximum photosynthetic rate was obtained. The non-rectangular hyperbola model is re- presented by the formula: 2 smaxds maxdd s PP IRP IP1RRP0 where Ps is the net CO2 assimilation rate (mol· C O 2·m–2·s–1), I is the PPFD (mol-photon·m–2·s–1), Rd is the rate of dark respiration expressed as CO2 production (mol- CO2·m–2·s–1), Pmax is the light-saturated rate of gross CO2 assimilation (mol - C O 2·m–2·s–1), and and are con- stants determining curvature at the shoulder and apparent quantum efficiency (initial slope at zero irradiance of the light-photosynthetic rate relation ship curve), respectively. Rd was obtained from the experimental data, and the light response curve of the gross pho tosynthetic rate was obtained by substitu ting Rd = 0 in the equation. Maximum photosynthetic rates (Pmax) estimated by the non-rectangular hyperbola model (excluding data for higher PPFDs if the PPFD-photosynthesis curves showed a decreasing tendency at higher PPFDs) were obtained at T = 35˚C for S. palustre, S. fuscum and S. papillosum, and at T = 30˚C for S. fimbriatum and S. fallax (Figure 2(a)). Although temperature dependence for Pmax was significant (p < 0.05) only for S. palustre by the Kruskal- Wallis test, Pmax at T = 40˚C was 70% - 85 % of Pmax at T = 35˚C for northern species (S. fuscum, S. fallax and S. Copyright © 2011 SciRes. AJPS 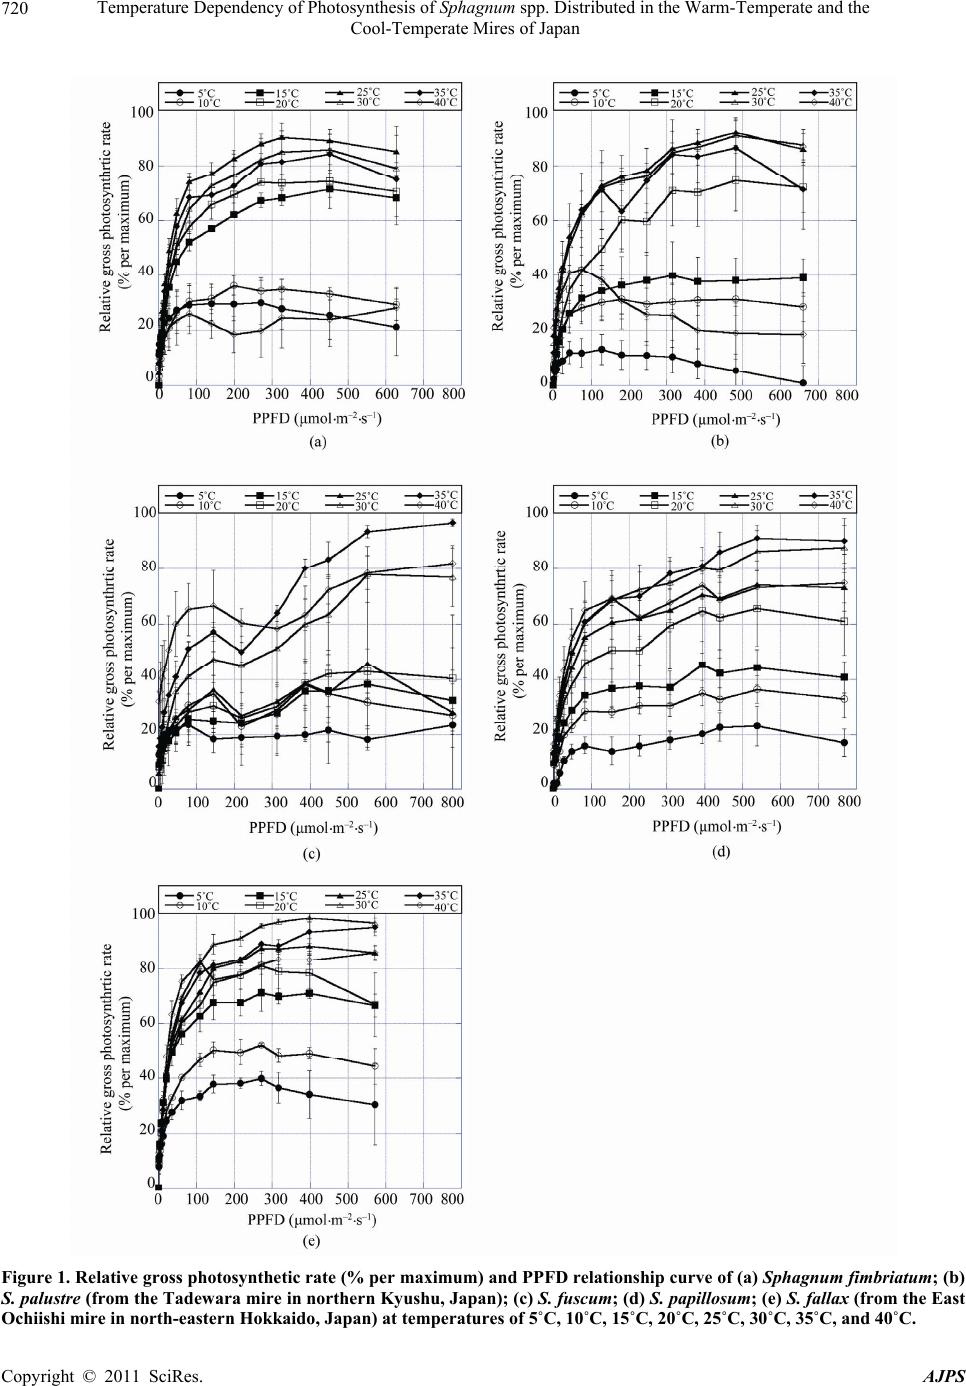 Temperature Dependency of Photosynthesis of Sphagnum spp. Distributed in the Warm-Temperate and the Cool-Temperate Mires of Japan Copyright © 2011 SciRes. AJPS 720 Figure 1. Relative gross photosynthetic rate (% per maximum) and PPFD relationship curve of (a) Sphagnum fimbriatum; (b) S. palustre (from the Tadewara mire in northern Kyushu, Japan); (c) S. fuscum; (d) S. papillosum; (e) S. fallax (from the East Ochiishi mire in north-eastern Hokkaido, Japan) at temperatures of 5˚C, 10˚C, 15˚C, 20˚C, 25˚C, 30˚C, 35˚C, and 40˚C. 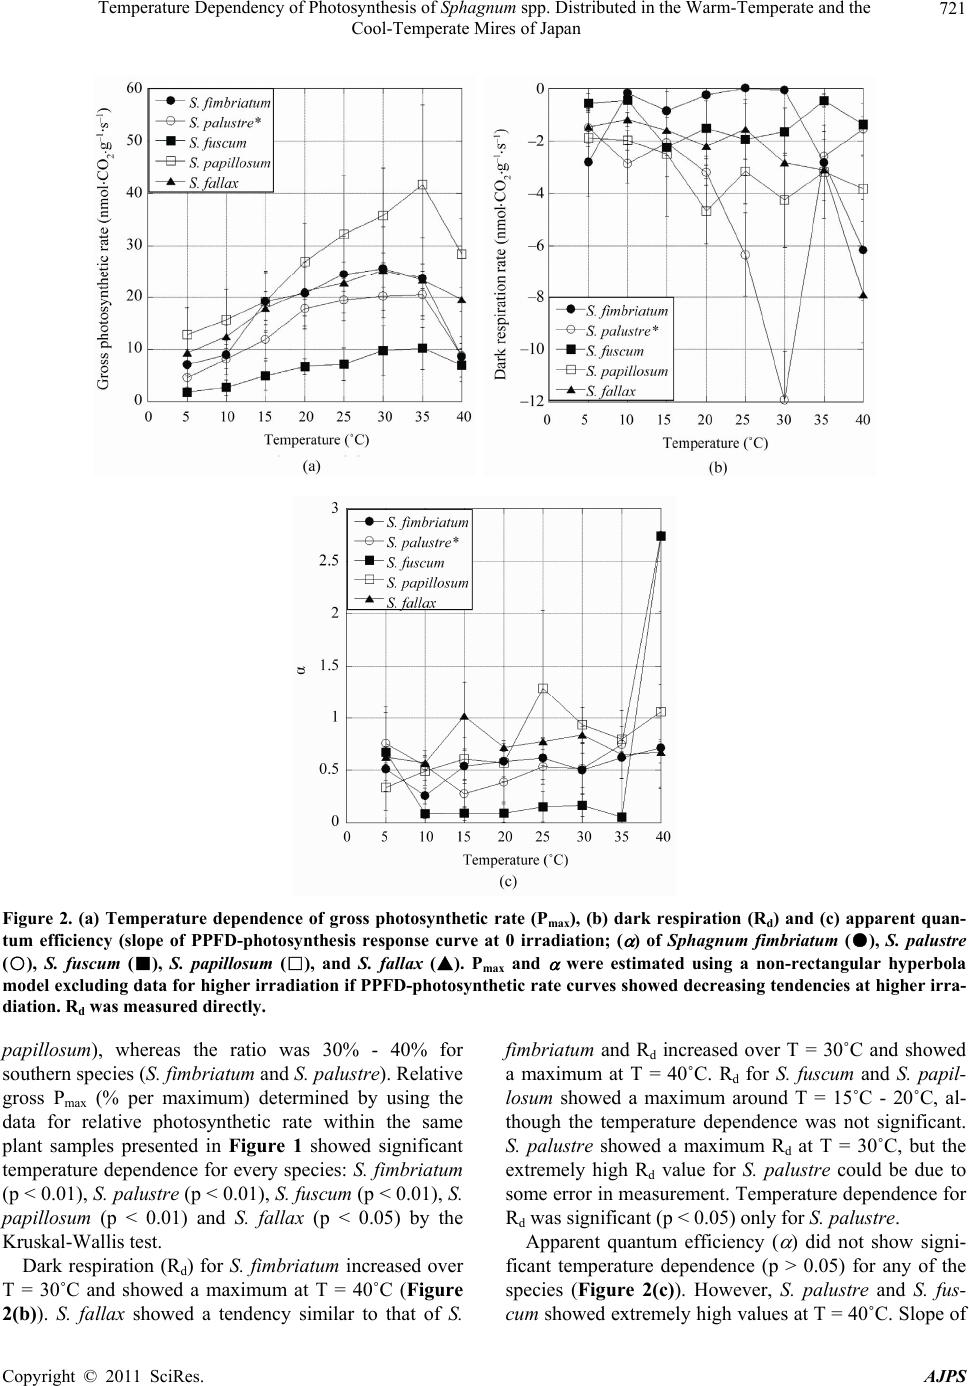 Temperature Dependency of Photosynthesis of Sphagnum spp. Distributed in the Warm-Temperate and the 721 Cool-Temperate Mires of Japan Figure 2. (a) Temperature dependence of gross photosynthetic rate (Pmax), (b) dark respiration (Rd) and (c) apparent quan- tum efficiency (slope of PPFD-photosynthesis response curve at 0 irradiation; ( ) of Sphagnum fimbriatum (●), S. palustre (○), S. fuscum (■), S. papillosum (□), and S. fallax (▲). Pmax and were estimated using a non-rectangular hyperbola model excluding data for higher irradiation if PPFD-photosynthetic rate curves showed decreasing tendencies at higher irra- diation. Rd was measured direc tly. papillosu m), whereas the ratio was 30% - 40% for southern species (S. fimbriatum and S. palustre). Relative gross Pmax (% per maximum) determined by using the data for relative photosynthetic rate within the same plant samples presented in Figure 1 showed significant temperature dependence for every species: S. fimbriatum (p < 0.01), S. palustre (p < 0.01), S. fuscum (p < 0.01), S. papillosu m (p < 0.01) and S. fallax (p < 0.05) by the Kruskal-Wallis test. Dark respiration (Rd) for S. fimbriatum increased over T = 30˚C and showed a maximum at T = 40˚C (Figure 2(b)). S. fallax showed a tendency similar to that of S. fimbriatum and Rd increased over T = 30˚C and showed a maximum at T = 40˚C. Rd for S. fuscum and S. papil- losum showed a maximum around T = 15˚C - 20˚C, al- though the temperature dependence was not significant. S. palustre showed a maximum Rd at T = 30˚C, but the extremely high Rd value for S. palustre could be due to some error in measurement. Temperature dependence for Rd was significant (p < 0.05) only for S. palustre. Apparent quantum efficiency ( ) did not show signi- ficant temperature dependence (p > 0.05) for any of the species (Figure 2(c)). However, S. palustre and S. fus- cum showed extremely high values at T = 40˚C. Slope of Copyright © 2011 SciRes. AJPS 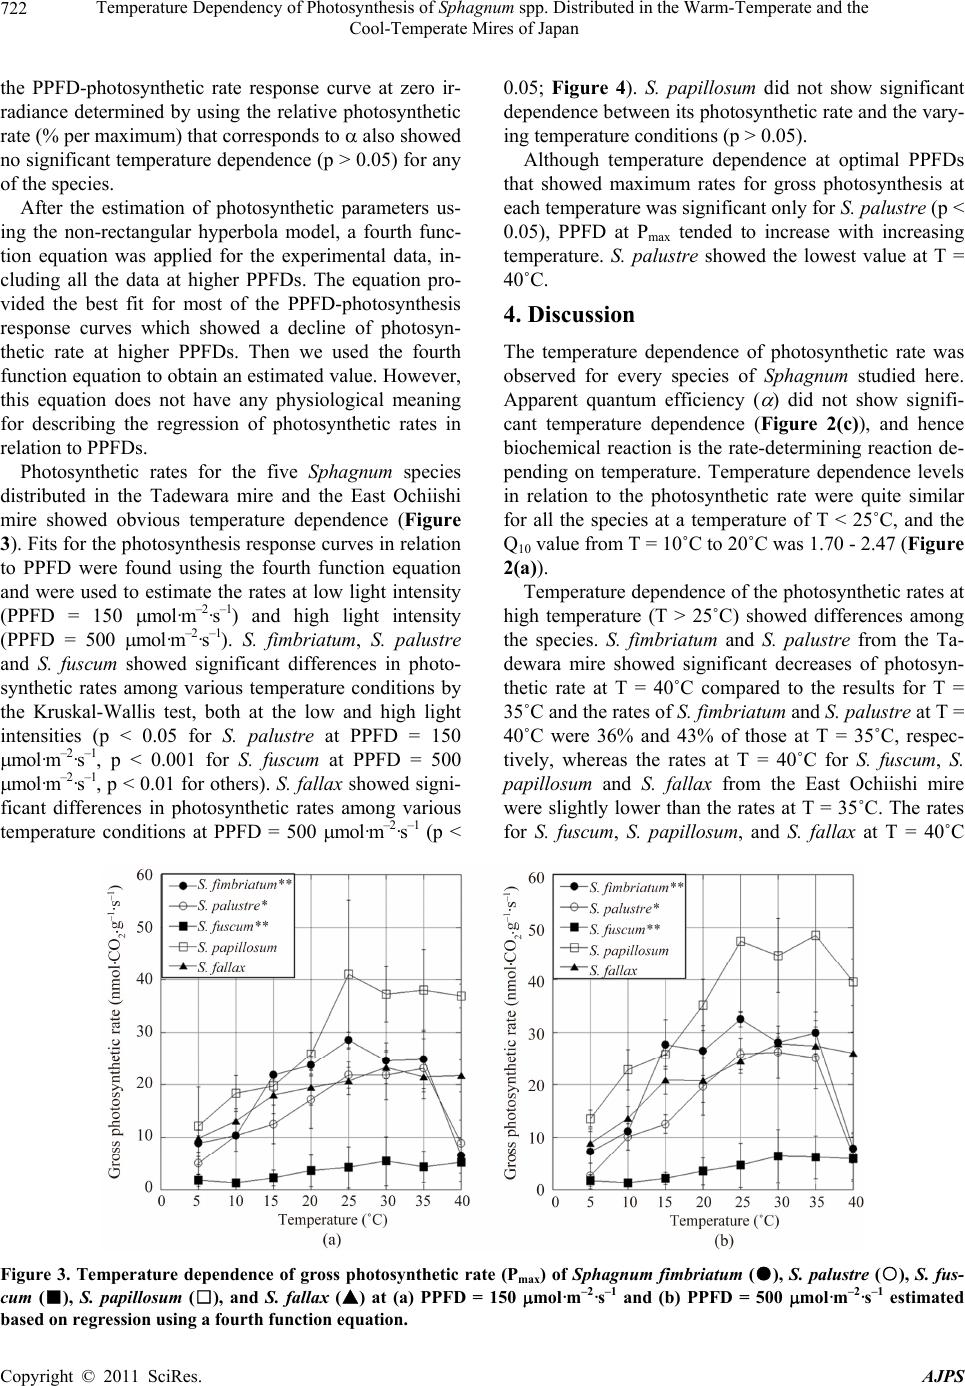 Temperature Dependency of Photosynthesis of Sphagnum spp. Distributed in the Warm-Temperate and the 722 Cool-Temperate Mires of Japan the PPFD-photosynthetic rate response curve at zero ir- radiance determined by using the relative photosynthetic rate (% per maximum) that corresponds to also showed no significant temperature dependence (p > 0.05) for any of the species. After the estimation of photosynthetic parameters us- ing the non-rectangular hyperbola model, a fourth func- tion equation was applied for the experimental data, in- cluding all the data at higher PPFDs. The equation pro- vided the best fit for most of the PPFD-photosynthesis response curves which showed a decline of photosyn- thetic rate at higher PPFDs. Then we used the fourth function equation to obtain an estimated value. However, this equation does not have any physiological meaning for describing the regression of photosynthetic rates in relation to PPFDs. Photosynthetic rates for the five Sphagnum species distributed in the Tadewara mire and the East Ochiishi mire showed obvious temperature dependence (Figure 3). Fits for the photosynth esis response cu rves in relation to PPFD were found using the fourth function equation and were used to estimate the rates at low light intensity (PPFD = 150 mol· m–2·s–1) and high light intensity (PPFD = 500 mol· m–2·s–1). S. fimbriatum, S. palustre and S. fuscum showed significant differences in photo- synthetic rates among various temperature conditions by the Kruskal-Wallis test, both at the low and high light intensities (p < 0.05 for S. palustre at PPFD = 150 mol·m–2·s–1, p < 0.001 for S. fuscum at PPFD = 500 mol·m–2·s–1, p < 0.01 for others). S. fallax showed signi- ficant differences in photosynthetic rates among various temperature conditions at PPFD = 500 mol·m–2·s–1 (p < 0.05; Figure 4). S. papillosum did not show significant dependence between its photosynthetic rate and the vary- ing temperature conditions (p > 0.05). Although temperature dependence at optimal PPFDs that showed maximum rates for gross photosynthesis at each temperature was significant only for S. palustre (p < 0.05), PPFD at Pmax tended to increase with increasing temperature. S. palustre showed the lowest value at T = 40˚C. 4. Discussion The temperature dependence of photosynthetic rate was observed for every species of Sphagnum studied here. Apparent quantum efficiency ( ) did not show signifi- cant temperature dependence (Figure 2(c)), and hence biochemical reaction is the rate-determining reaction de- pending on temperature. Temperature dependence levels in relation to the photosynthetic rate were quite similar for all the species at a temperature of T < 25˚C, and the Q10 value from T = 10˚C to 20˚C was 1.70 - 2.47 (Figure 2(a)). Temperature dependence of the photosynthetic rates at high temperature (T > 25˚C) showed differences among the species. S. fimbriatum and S. palustre from the Ta- dewara mire showed significant decreases of photosyn- thetic rate at T = 40˚C compared to the results for T = 35˚C and the rates of S. fimbriatum and S. palustre at T = 40˚C were 36% and 43% of those at T = 35˚C, respec- tively, whereas the rates at T = 40˚C for S. fuscum, S. papillosum and S. fallax from the East Ochiishi mire were slightly lower than the rates at T = 35˚C. The rates for S. fuscum, S. papillosum, and S. fallax at T = 40˚C Figure 3. Temperature dependence of gross photosynthetic rate (Pmax) of Sphagnum fimbriatum (●), S. palustre (○), S. fus- cum (■), S. papillosum (□), and S. fallax (▲) at (a) PPFD = 150 mol·m–2·s–1 and (b) PPFD = 500 mol·m–2·s–1 estimated based on regression using a fourth function e quation. Copyright © 2011 SciRes. AJPS 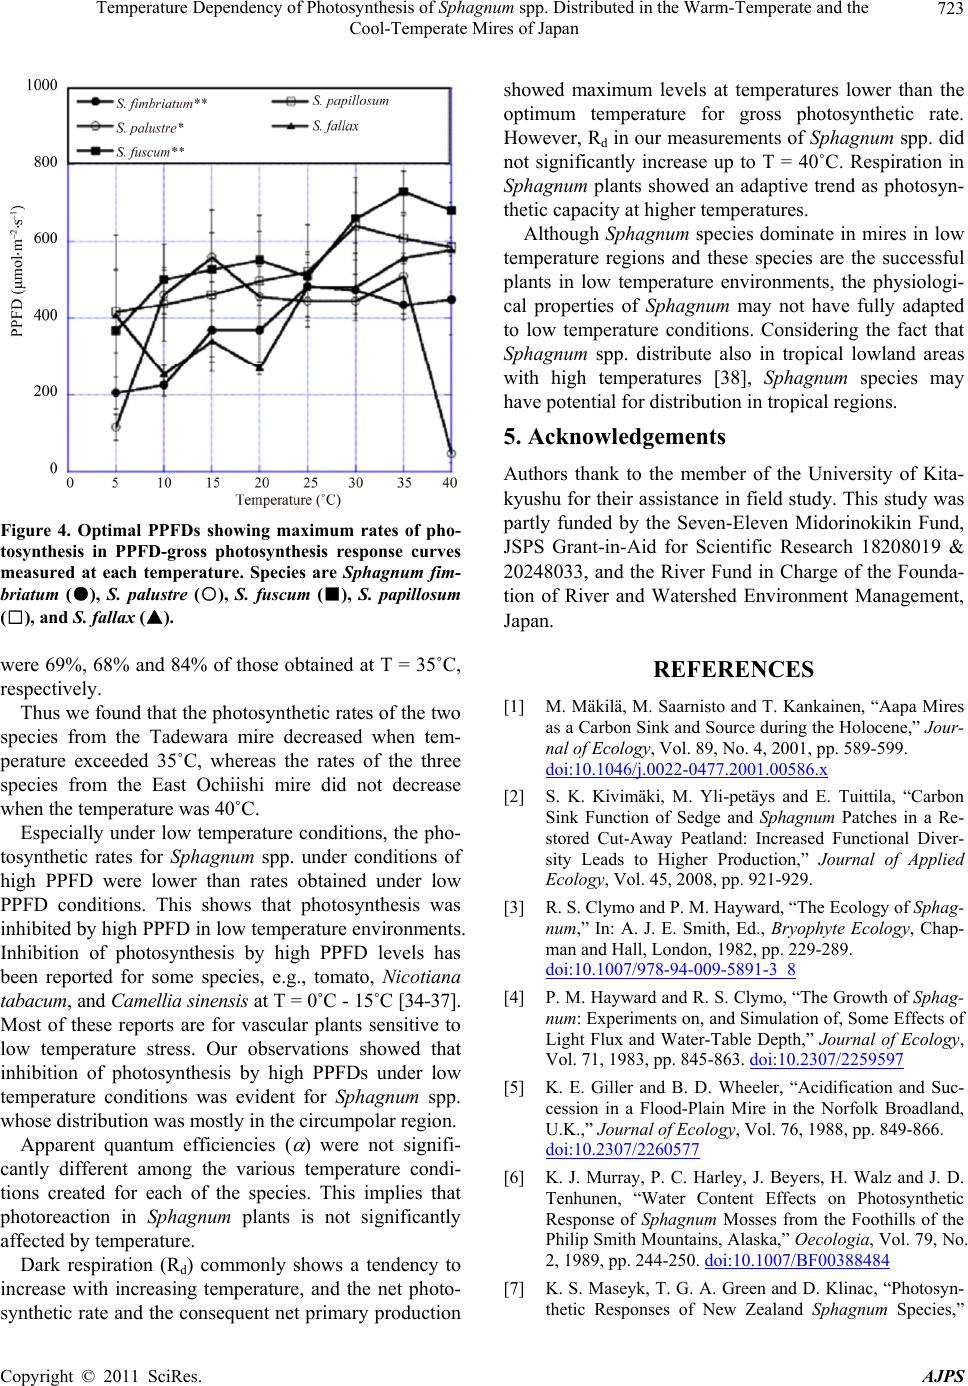 Temperature Dependency of Photosynthesis of Sphagnum spp. Distributed in the Warm-Temperate and the 723 Cool-Temperate Mires of Japan Figure 4. Optimal PPFDs showing maximum rates of pho- tosynthesis in PPFD-gross photosynthesis response curves measured at each temperature. Species are Sphagnum fim- briatum (●), S. palustre (○), S. fuscum (■), S. papillosum (□), and S. fallax (▲). were 69%, 68% and 84% of those obtained at T = 35˚C, respectively. Thus we found that the ph otosynthetic rates of the two species from the Tadewara mire decreased when tem- perature exceeded 35˚C, whereas the rates of the three species from the East Ochiishi mire did not decrease when the temperature was 40˚C. Especially under low temperature conditions, the pho- tosynthetic rates for Sphagnum spp. under conditions of high PPFD were lower than rates obtained under low PPFD conditions. This shows that photosynthesis was inhibited by high PPFD in low temperature environments. Inhibition of photosynthesis by high PPFD levels has been reported for some species, e.g., tomato, Nicotiana tabacum, and Camellia sinensis at T = 0˚C - 15˚C [34-37]. Most of these reports are for vascular plants sensitive to low temperature stress. Our observations showed that inhibition of photosynthesis by high PPFDs under low temperature conditions was evident for Sphagnum spp. whose distribution was mostly in the circumpolar region. Apparent quantum efficiencies ( ) were not signifi- cantly different among the various temperature condi- tions created for each of the species. This implies that photoreaction in Sphagnum plants is not significantly affected by temperature. Dark respiration (Rd) commonly shows a tendency to increase with increasing temperature, and the net photo- synthetic rate and the consequent net primary production showed maximum levels at temperatures lower than the optimum temperature for gross photosynthetic rate. However, Rd in our measurements of Sphagnum spp. did not significantly increase up to T = 40˚C. Respiration in Sphagnum plants showed an adaptive trend as photosyn- thetic capacity at higher temperatures. Although Sphagnum species dominate in mires in low temperature regions and these species are the successful plants in low temperature environments, the physiologi- cal properties of Sphagnum may not have fully adapted to low temperature conditions. Considering the fact that Sphagnum spp. distribute also in tropical lowland areas with high temperatures [38], Sphagnum species may have potential for distribution in tropical regio ns. 5. Acknowledgements Authors thank to the member of the University of Kita- kyushu for their assistance in field study. This study was partly funded by the Seven-Eleven Midorinokikin Fund, JSPS Grant-in-Aid for Scientific Research 18208019 & 20248033, and the River Fund in Charge of the Founda- tion of River and Watershed Environment Management, Japan. REFERENCES [1] M. Mäkilä, M. Saarnisto and T. Kankainen, “Aapa Mires as a Carbon Sink and Source during the Holocene,” Jour- nal of Ecology, Vol. 89, No. 4, 2001, pp. 589-599. doi:10.1046/j.0022-0477.2001.00586.x [2] S. K. Kivimäki, M. Yli-petäys and E. Tuittila, “Carbon Sink Function of Sedge and Sphagnum Patches in a Re- stored Cut-Away Peatland: Increased Functional Diver- sity Leads to Higher Production,” Journal of Applied Ecology, Vol. 45, 2008, pp. 921-929. [3] R. S. Clymo and P. M. Hayward, “The Ecology of Sphag- num,” In: A. J. E. Smith, Ed., Bryophyte Ecology, Chap- man and Hall, London, 1982, pp. 229-289. doi:10.1007/978-94-009-5891-3_8 [4] P. M. Hayward and R. S. Clymo, “The Growth of Sphag- num: Experiments on, and Simulation of, Some Effects of Light Flux and Water-Table Depth,” Journal of Ecology, Vol. 71, 1983, pp. 845-863. doi:10.2307/2259597 [5] K. E. Giller and B. D. Wheeler, “Acidification and Suc- cession in a Flood-Plain Mire in the Norfolk Broadland, U.K.,” Journal of Ecology, Vol. 76, 1988, pp. 849-866. doi:10.2307/2260577 [6] K. J. Murray, P. C. Harley, J. Beyers, H. Walz and J. D. Tenhunen, “Water Content Effects on Photosynthetic Response of Sphagnum Mosses from the Foothills of the Philip Smith Mountains, Alaska,” Oecologia, Vol. 79, No. 2, 1989, pp. 244-250. doi:10.1007/BF00388484 [7] K. S. Maseyk, T. G. A. Green and D. Klinac, “Photosyn- thetic Responses of New Zealand Sphagnum Species,” Copyright © 2011 SciRes. AJPS  Temperature Dependency of Photosynthesis of Sphagnum spp. Distributed in the Warm-Temperate and the 724 Cool-Temperate Mires of Japan New Zealand Journal of Botany, Vol. 37, No. 1, 1999, pp. 155-165. doi:10.1080/0028825X.1999.9512621 [8] K. E. van Gaalen, L. B. Flanagan and D. R.Peddle, “Pho- tosynthesis, Chlorophyll Fluorescence and Spectral Re- flectance in Sphagnum Moss at Varying Water Contents,” Oecologia, Vol. 153, No. 1, 2007, pp. 19-28. doi:10.1007/s00442-007-0718-y [9] R. Gerdol, A. Bonora, R. Gualandri and S. Pancaldi, “CO2 Exchange, Photosynthetic Pigment Composition, and Cell Ultrastructure of Sphagnum Mosses during De- hydration and Subsequent Rehydration,” Canadian Journal of Botany, Vol. 74, No. 5, 1996, pp. 726-734. doi:10.1139/b96-091 [10] B. Schipperges and H. Rydin, “Response of Photosynthe- sis of Sphagnum Species from Contrasting Microhabitats to Tissue Water Content and Repeated Desiccation,” New Phytologist, Vol. 140, No. 4, 1998, pp. 677-684. doi:10.1046/j.1469-8137.1998.00311.x [11] R. Aerts, B. Wallén and N. Malmer, “Growth-Limiting Nutrients in Sphagnum-Dominated Bogs Subject to Low and High Atmospheric Nitrogen Supply,” Journal of Ecology, Vol. 80, 1992, pp. 131-140. doi:10.2307/2261070 [12] U. Gunnarsson and H. Rydin, “Nitrogen Fertilization Reduces Sphagnum Production in Bog Communities,” New Phytologist, Vol. 147, No. 3, 2000, pp. 527-537. doi:10.1046/j.1469-8137.2000.00717.x [13] M. M. P. D. Heijmans, H. Klees, W. de Visser and F. Berendse, “Response of a Sphagnum Bog Plant Commu- nity to Elevated CO2 and N Supply,” Plant Ecology, Vol. 162, No. 1, 2002, pp. 123-134. doi:10.1023/A:1020368130679 [14] U. Gunnarsson, G. Granberg and M. Nilsson, “Growth, Production and Interspecific Competition in Sphagnum: Effects of Temperature, Nitrogen and Sulphur Treatments on a Boreal Mire,” New Phytologist, Vol. 163, No. 2, 2004, pp. 349-359. doi:10.1111/j.1469-8137.2004.01108.x [15] J. Limpens, F. Berendse and H. Klees, “How Phosphorus Availability Affects the Impact of Nitrogen Deposition on Sphagnum and Vascular Plants in Bogs,” Ecosystems, Vol. 7, No. 8, 2004, pp. 793-804. doi:10.1007/s10021-004-0274-9 [16] G. Granath, J. Strengbom, A. Breeuwer, M. M. P. D. Heijmans, F. Berendse and H. Rydin, “Photosynthetic Performance in Sphagnum Transplanted along a Latitu- dinal Nitrogen Deposition Gradient,” Oecologia, Vol. 159, No. 4, 2009, pp. 705-715. doi:10.1007/s00442-008-1261-1 [17] P. Ferguson and J. A. Lee, “The Effects of Bisul phite and Sulphate upon Photosynthesis in Sphagnum,” New Phy- tologist, Vol. 82, No. 3, 1979, pp. 703-712. doi:10.1111/j.1469-8137.1979.tb01665.x [18] P. Ferguson and J. A. Lee, “Some Effects of Bisulphite and Sulphate on the Growth of Sphagnum Species in the Field,” Environmental Polluttion (Series A), Vol. 21, No. 1, 1980, pp. 59-71. doi:10.1016/0143-1471(80)90033-1 [19] R. Baxter, M. J. Emes and J. A. Lee, “Effects of the Bi- sulphite Ion on Growth and Photosynthesis in Sphagnum cuspidatum Hoffm,” New Phytologist, Vol. 111, No. 3, 1989, pp. 457-462. doi:10.1111/j.1469-8137.1989.tb00708.x [20] R. Baxter, M. J. Emes and J. A. Lee, “Short Term Effects of Bisulphite on Pollution-Tolerant and Pollution Sensi- tive Populations of Sphagnum cuspidatum Ehrh. (ex Hoffm.),” New Phytologist, Vol. 118, No. 3, 1991, pp. 425-431. doi:10.1111/j.1469-8137.1991.tb00024.x [21] L. Potter, J. P. Foot, S. J. M. Caporn and J. A. Lee, “The Effects of Long-Term Elevated Ozone Concentrations on the Growth and Photosynthesis of Sphagnum recurvum and Polytrichum commune,” New Phytologist, Vol. 134, No. 4, 1996, pp. 649-656. doi:10.1111/j.1469-8137.1996.tb04930.x [22] R. Niemi, P. J. Martikainen, J. Silvola and T. Holopainen, “Ozone Effects on Sphagnum Mosses, Carbon Dioxide Exchange and Methane Emission in Boreal Peatland Mi- crocosm,” Science of the Total Environment, Vol. 289, No. 1-3, 2002, pp. 1-12. doi:10.1016/S0048-9697(01)01012-9 [23] C. Gehrke, “Effects of Enhanced UV-B Radiation on Production-Related Properties of a Sphagnum fuscum Dominated Subarctic Bog,” Functional Ecology, Vol. 12, No. 6, 1998, pp. 940-947. doi:10.1046/j.1365-2435.1998.00273.x [24] P. S. Searles, S. D. Flint, S. B. Díaz, M. C. Rousseaux, C. L. Ballaré and M. M. Caldwell, “Plant Response to Solar Ultraviolet-B Radiation in a Southern South American Sphagnum Peatland,” Journal of Ecology, Vol. 90, No. 4, 2002, pp. 704-713. doi:10.1046/j.1365-2745.2002.00709.x [25] T. M. Robson, V. A. Pancotto, S. D. Flint, C. L. Ballaré, O. E. Sala, A. L. Scopel and M. M. Caldwell, “Six Years of Solar UV-B Manipulations Affect Growth of Sphag- num and Vascular Plants in a Tirra Del Fuego Peatland,” New Phytologist, Vol. 160, No. 2, 2003, pp. 379-389. doi:10.1046/j.1469-8137.2003.00898.x [26] A. Breeuwer, M. M. P. D. Heijmans, B. J. M. Robroek and F. Berendse, “The Effect of Temperature on Growth and Competition between Sphagnum Species,” Oecologia, Vol. 156, No. 1, 2008, pp. 155-167. doi:10.1007/s00442-008-0963-8 [27] T. G. Williams and L. B. Flanagan, “Measuring and Modeling Environmental Influences on Photosynthetic Gas Exchange in Sphagnum and Pleurozium,” Plant, Cell and Environment, Vol. 21, No. 6, 1998, pp. 555-564. doi:10.1046/j.1365-3040.1998.00292.x [28] H. Kawanishi and M. Nishida, “Meteorology and Hy- drology in the Kujyu-Tadewara Mire,” In: Scientific Re- port on the Kujyu-Tadewara Area, Kokonoe Town and Oita Prefecture, 2002, pp. 9-18. [29] A. Haraguchi, T. Hasegawa, T. Iyobe and H. Nishijima, “The pH Dependence of Photosynthesis and Elongation Copyright © 2011 SciRes. AJPS  Temperature Dependency of Photosynthesis of Sphagnum spp. Distributed in the Warm-Temperate and the Cool-Temperate Mires of Japan Copyright © 2011 SciRes. AJPS 725 of Sphagnum squarrosum and S. girgensohnii in the Picea glehnii Mire Forest in Cape Ochiishi, North-East- ern Japan,” Aquatic Ecology, Vol. 37, No. 1, 2003, pp. 101-104. doi:10.1023/A:1022130622499 [30] Y. Ino, “Photosynthesis of Antarctic Mosses and Li- chens,” Japanese Journal of Ecology, in Japanese, Vol. 41, 1991, pp. 149-158. [31] S. C. Maberly and D. H. N.Spence, “Photosynthetic In- organic Carbon Use by Freshwater Plants,” Journal of Ecology, Vol. 71, 1983, pp. 705-724. doi:10.2307/2259587 [32] P. C. Harley, J. D. Tenhunen, K. J. Murray and J. Beyers, “Irradiance and Temperature Effects on Photosynthesis of Tussock Tundra Sphagnum Mosses from the Foothills of the Philip Smith Mountains, Alaska,” Oecologia, Vol. 79, No. 2, 1989, pp. 251-259. doi:10.1007/BF00388485 [33] J. L. Prioul and P. Chartier, “Partitioning of Transfer and Carboxylation Components of Intracellular Resistance to Photosynthetic CO2 Fixation: A Critical Analysis of the Methods Used,” Annals of Botany, Vol. 41, 1977, pp. 789-800. [34] G. Cornic and G. Louason, “The Effects of O2 on Net Photosynthesis at Low Temperature (5˚C),” Plant, Cell and Environment, Vol. 3, 1980, pp. 149-157. doi:10.1111/j.1365-3040.1980.tb00108.x [35] S. B. Powels, J. A. Berry and O. Björkman, “Interaction between Light and Chilling Temperature on the Inhibition of Photosynthesis in Chilling Sensitive Plants,” Plant, Cell and Environment, Vol. 6, No. 2, 1983, pp. 117-123. doi:10.1111/j.1365-3040.1983.tb01884.x [36] G. Bongi and S. P. Long, “Light-Dependent Damage to Photosynthesis in Olive Leaves during Chilling and High Temperature Stress,” Plant, Cell and Environment, Vol. 10, 1987, pp. 241-249 [37] L. A. Netto, K. M. Jayaram, P. Haridas and J. T. Puthur, “Characterization of Photosynthetic Events and Associ- ated Changes in Various Clones of Tea (Camellia Sinen- sis L.) under Low Temperature Conditions,” Journal of Plant Biology, Vol. 48, No. 3, 2005, pp. 326-331. doi:10.1007/BF03030530 [38] T. Asada and A. Haraguchi, “A New Locality of Sphag- num cuspidatum subsp. subrecurvum var. flaccidifolium (A. Johnson) A. Eddy in Central Kalimantan, Indonesia,” Bryology Research, in Japanese, Vol. 9, 2006, pp. 87-88.
|