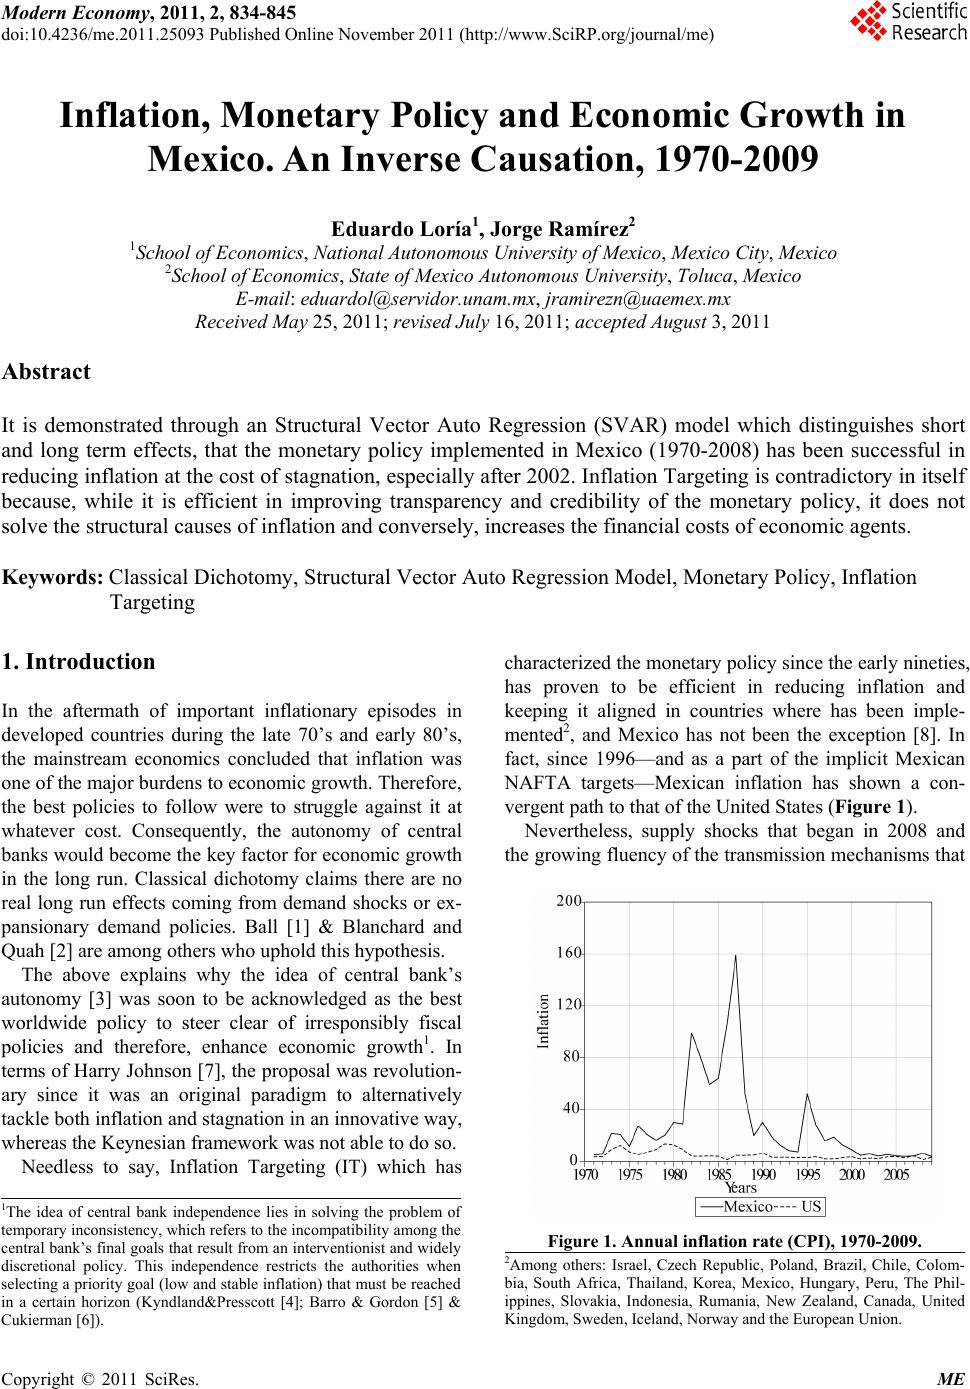
 Modern Economy, 2011, 2, 834-845 doi:10.4236/me.2011.25093 Published Online November 2011 (http://www.SciRP.org/journal/me) Copyright © 2011 SciRes. ME Inflation, Monetary Policy and Economic Growth in Mexico. An Inverse Causation, 1970-2009 Eduardo Loría1, Jorge Ramírez2 1School of Economics, National Autonomous University of Mexico, Mexico City, Mexico 2School of Economics, State of Mexico Autonomous University, Toluca, Mexico E-mail: eduardol@servidor.unam.mx, jramirezn@uaemex.mx Received May 25, 2011; revised July 16, 2011; accepted August 3, 2011 Abstract It is demonstrated through an Structural Vector Auto Regression (SVAR) model which distinguishes short and long term effects, that the monetary policy implemented in Mexico (1970-2008) has been successful in reducing inflation at the cost of stagnation, especially after 2002. Inflation Targeting is contradictory in itself because, while it is efficient in improving transparency and credibility of the monetary policy, it does not solve the structural causes of inflation and conversely, increases the financial costs of economic agents. Keywords: Classical Dichotomy, Structural Vector Auto Regression Model, Monetary Policy, Inflation Targeting 1. Introduction In the aftermath of important inflationary episodes in developed countries during the late 70’s and early 80’s, the mainstream economics concluded that inflation was one of the major burdens to economic growth. Therefore, the best policies to follow were to struggle against it at whatever cost. Consequently, the autonomy of central banks would become the key factor for economic growth in the long run. Classical dichotomy claims there are no real long run effects coming from demand shocks or ex- pansionary demand policies. Ball [1] & Blanchard and Quah [2] are among others who uphold this hypothesis. The above explains why the idea of central bank’s autonomy [3] was soon to be acknowledged as the best worldwide policy to steer clear of irresponsibly fiscal policies and therefore, enhance economic growth1. In terms of Harry Johnson [7], the proposal was revolution- ary since it was an original paradigm to alternatively tackle both inflation and stagnation in an innovative way, whereas the Keynesian framework was not able to do so. Needless to say, Inflation Targeting (IT) which has characterized the monetary policy since the early nineties, has proven to be efficient in reducing inflation and keeping it aligned in countries where has been imple- mented2, and Mexico has not been the exception [8]. In fact, since 1996—and as a part of the implicit Mexican NAFTA targets—Mexican inflation has shown a con- vergent path to that of the United States (Figure 1). Nevertheless, supply shocks that began in 2008 and the growing fluency of the transmission mechanisms that 1The idea of central bank independence lies in solving the problem o temporary inconsistency, which refers to the incompatibility among the central bank’s final goals that result from an interventionist and widely discretional policy. This independence restricts the authorities when selecting a priority goal (low and stable inflation) that must be reached in a certain horizon (Kyndland&Presscott [4]; Barro & Gordon [5] & Cukierman [6]). Figure 1. Annual inflation rate (CPI), 1970-2009. 2Among others: Israel, Czech Republic, Poland, Brazil, Chile, Colom- bia, South Africa, Thailand, Korea, Mexico, Hungary, Peru, The Phil- ippines, Slovakia, Indonesia, Rumania, New Zealand, Canada, United Kingdom, Sweden, Iceland, Norway and the European Union.  835 E. LORÍA ET AL. have encompassed globalization, have proven that this approach resulted in diminishing returns. This is because in order to control inflation, the exchange rate (nominal and real) has to be appreciated, which in turn deteriorates competitiveness and consequently the balance of pay- ments. In sum, we claim that reducing inflation in this manner depresses economic growth both in the short and in the long run. Ball [1] states that in 17 out of 20 developed countries, NAIRU grew during the 1980’s because of a restrictive monetary policy applied to reduce inflation. In this sense, Stiglitz [9] argues that the rise in interest rate reduced inflation but at the cost of restraining the aggregate de- mand and output. In other words, “the cure proved worse than the illness”. In this paper, we show that for 1970-2009, the restric- tive management of the interest rate in Mexico—even before the IT existed—depressed growth, although it may have reduced inflation. This last result is the final balance of several effects. On one hand, the exchange appreciation which is inherent to this policy diminishes production costs (final and intermediate goods) and the costs of final imported consumption goods; but on the other hand, the increase in interest rate raises public debt as well as the financial costs for each individual and therefore, it restricts aggregate spending. As a result, even though economic growth has slowed down, trade deficit has increased, which is not surprising at all. This can be observed in Figure 2 which shows the coefficient of imports to aggregate supply. In order to prove our hypothesis, we estimatean Struc- tural Vector Auto Regression (SVAR) for the short and long run. This paper is divided into five sections. In the second section, historical (1970-2009) inflation and monetary policy in Mexico are analyzed; the third section presents a theoretical framework of the determinants of inflation and the SVAR methodology. The fourth section dis- cusses our main results. The final section presents con- clusions and policy recommendations. Figure 2. Imports to aggregate supply coefficient, 1970-2009. 2. Inflation and Monetary Policy in Mexico, 1970-2009 IT is characterized as an official announcement of a pro- jected inflation range to meet preset temporary horizons. It also claims that the monetary policy is focused on ob- taining an explicit goal of a low and stable inflation. Conventionally, Mishkin [10] considers IT as an eco- nomic policy framework with the following characteris- tics: transparency of the monetary policy, expressing at all times the Central Bank’s primary concern regarding inflation and, rapidly responding (reacting) to inflation- ary shocks. (Bernanke & Mishkin [11]; Ramos-Francia & Torres [8]; Kurczyn [12]). IT is built on two founda- tions: a) the theoretical, which is the real business cycle approach; and b) the empirical, which relies on the linear adjustment of a scatter diagram which illustrates a nega- tive relation of output to inflation3 (see Figure 3). Sch- wartz [13], Castellanos [14], Díaz de León & Greenham [15] and Martínez, Sánchez & Werner [16] claim that a Central Bank’s best contribution to economic growth is inflation reduction and its stabilization; hence, as of 1994 when the Mexican Central Bank (Banco de Mexico) autonomy became effective, its sole mandate has been to fight inflation with IT. The empirical argument, which is also strictly statisti- cal, cannot refer causality but a simple correlation that under an inverse specification has an opposite outcome (as shown in Figure 4). That is to say, economic growth through its positive effects on productivity (economies of scale) reduces inflation. 2.1. Inflation in Mexico. Stylized Facts Five inflationary phases can be detected which are clearly related to specific exchange rate regimes (see Figure 5). The first phase (1970-1975) is of a low and relative Figure 3. Mexico: inflation vs economic growth, 1970-2009. 3To this respect, see Taylor [3], Bernanke & Mishkin [11] and Mishkin [10] y [17]. Copyright © 2011 SciRes. ME  E. LORÍA ET AL. 836 Figure 4. Mexico: inflation vs economic growth, 1970-2009. 123 Figure 5. Mexico: inflation and nominal exchange rate vari- ation, 1970-2009 (normalized series)*. inflationary stability even when it shows increases after 1973, mostly as a result of world shocks in the price of commodities. Afterwards it reduces due to a nominal exchange rate fixation and its subsequent real apprecia- tion. The second phase (1976-1987) is featured by a sys- tematic depreciation of the exchange rate which implied an inflationary burst and was reverted by the implemen- tation of the policy adjustment program on December 1987. The main characteristic of the third phase is the cuasi fixation of the nominal exchange rate and the con- trol of several fundamental prices of goods, services and factors, so a severe and swift inflation reduction was observed until reaching historical minimums in 1994. The external and internal financial imbalances, which were mostly generated by the real exchange rate appre- ciation and by the internal political instability, provoked the end of this exchange and monetary regime with the magni-devaluations that began in December 1994 (Car- stens & Werner [18] and Elizondo [19]). In 1995 a completely different phase began which re- sulted from the monetary policy of accumulated balances or cero average reserve requirements4 that was used as a benchmark and as an instrument of transparency of the Central Bank’s reaction function5. The implementation of a flexible exchange regime proved that inflation was not affected as it had been previously. This monetary and exchange regime, unlike previous experiences, allowed the stabilization of the nominal exchange rate [20]. As inflation progressively decreased, a dirty floating ex- change rate regime was eventually established. Several analyses (among others Galindo & Ros [21]) stated that the pass through, that had been fairly high for decades, noticeably had been reduced. *In order to directly compare the two variables, we applied the follow- ing common normalization procedure: According to the Banco de Mexico, the explicit use (formal announcement) of IT began in 2001, although the pragmatism of that approach had been applied most likely since 1996 [22]. Subsequently, in 2003 the Mexi- can Central Bank officially established a three percent annual rate inflationary target allowing one point plus/ minus of variability. Without affecting the basics mentioned above, some changes occurred since 2003 with the substitution of the accumulated balances regime for the daily balances re- gime (April 10th, 2003), following a similar logic with the difference that banking accounts needed to be ad- justed daily, thus reinforcing the contractionary monetary policy it t x SD t , where SD = standard deviation and = arithmetic mean. In any case, the active and explicit management of the interest rates since 1996 has been the disinflationary in- strument by excellence with the argument that inflation- ary pressures—regardless of their origin—are in this manner mitigated. Upon evaluating the inflationary outcome and its goal (Table 1), the evidence shows that the Central Bank only achieved (and even exceeded) it only in 1999-2001, but at the expense of exchange rate appreciations, growth reduction and unemployment increases afterwards. (see able 1 and Figure 6). T 4This regime had the objective of decreasing volatility in interest rates and prices. It was called cero average reserve requirements because at the end of the operation, commercial banks could not have positive balances in their current account with the central bank. Otherwise, it would be punished with twice the 28 day Cetes interest rate (Schwartz, 1998). 5For Martínez, Sánchez & Werner (2000) the “corto” (money with- drawn from circulation) was used because the targeted interest rate could not be used due to high volatility in Mexican government bonds in foreign currency, which at the time affected the domestic money market performance and the high pass-through. If the authority at the time would have used an objective interest rate as its main policy in- strument, the economy would have gotten through high uncertainty and therefore macroeconomic instability. Copyright © 2011 SciRes. ME  E. LORÍA ET AL. Copyright © 2011 SciRes. ME 837 Table 1. Mexico: some macroeconomic variables, 1995-2009. Inflation CETES Exchange rate1 Unemployment Year Objective Actual Difference GDP (%) 28 days 1995 42.0 51.97 9.97 –6.1 48.6 1.35 6.2 1996 20.5 27.70 7.20 5.1 27.6 1.28 5.5 1997 15.0 15.72 0.72 6.8 18.9 1.18 3.7 1998 12.0 18.61 6.61 4.9 33.7 1.17 3.2 1999 13.0 12.32 –0.68 3.9 16.5 1.11 2.5 2000 10.0 8.96 –1.04 6.6 17.1 1.04 2.2 2001 6.5 4.40 –2.10 –0.2 6.3 1.00 2.4 2002 4.5 5.70 1.20 0.8 6.9 1.01 2.7 2003 3.0 3.98 0.98 1.4 6.1 1.10 3.3 2004 3.0 5.19 2.19 4.2 8.5 1.13 3.8 2005 3.0 3.33 0.33 3.0 8.2 1.09 3.6 2006 3.0 4.05 1.05 4.8 7.0 1.07 3.6 2007 3.0 3.76 0.76 3.2 7.4 1.08 3.7 2008 3.0 6.11 3.53 1.5 7.7 1.09 4.0 2009 3.0 3.57 0.57 –6.08 5.4 1.26 5.5 Source: Own calculations with dates from Banxico & INEGI. 1. RER = NER (PUS/PMX). 1993 = 1; PUS, PMX: Consumer Price Index US and Mexico, respec- tively; NER: Nominal Exchange Rate, pesos per 1 $ US. Figure 6. Mexico: inflation and unemployment, 1980-2009 (normalized series) This figure clearly demonstrates how between 1987 and 2000 inflation and unemployment grossly evolved in the same direction. Afterwards, the social cost (measured by the unemployment rate) in keeping in check increased, suggesting diminishing returns in IT. Our main and alternative argument to this approach proposes that the relation of interest rate to inflation has an inverse effect. That is, the interest rate reduction (28 day CETES) decreases inflation by reducing multiple financial costs of which, based on importance and impact, are public (domestic debt service) and enterprise costs6. This improves supply and effective demand and as a re- sult, scale economies emerge reducing average and mar- ginal costs which in due course increase economic growth. This means that the disinflationary effects aris- ing from the interest rate decrease are doubled through financial costs and productive efficiency. Thus, our Post- Keynesian interpretation of the relation between GDP growth and inflation corresponds to Figure 4. 3. Some Considerations about Inflation 3.1. Theoretical Issues Our approach starts out from a very traditional specifica- tion that determines the enterprise equilibrium under imperfect competition which accepts expectations in price formation7. We know—as a benchmark—that in perfect competi- tion, the equilibrium is attained where the enterprise maximizes its profit and that is where: P = MC = MR (1) also, MLC = W/P = MLP (2) The price can be expressed in terms of labor cost: P = W/MLP (3) which expressed in variations turns to: π = w – mlp (4) 6The latter in terms of debt and payment which enterprises usually incurred to finance their current activities, namely work capital, as well as innovation and investment. 7What follows is based on Perloff [23] and Carlin & Soskice [24].  E. LORÍA ET AL. 838 where: P = Price; MC = Marginal Cost; MR = Marginal Revenue; W = Monetary Wages; π = Inflation (∆P/P); MLC = Marginal Labor Costs; MLP = Marginal Labor Productivity. Under imperfect competition, enterprises set prices to maximize profits. There is an important relation between their market shares and their marginal revenue. If their market share decreases, they lose monopolistic power and therefore, they get closer to competitive equilibrium. Thus, their elasticity of demand (ε) determines their mo- nopolistic power: = f( ), ε > . Under these terms, their marginal revenue is defined as: MR = (ΔP/ΔQ) × Q + P (5) Multiplying the first member on the right hand side by (P/P) and solving: MR = P((1 + ε)/ε) = MC (6) and the price: P = MC × (ε/(1 + ε)) (7) Enterprises face several types of costs besides wages so we can generalize and reach a wider expression of inflation than Equation (4) by applying variations to Equation (7) and expressing ε/(1 + ε) = θ. ˆ πtMC (8) When incorporating inflationary expectations we fi- nally get a functional expression. In Equation (9) we introduce regressive expectations or inflationary inertia. On the other hand, the marginal costs here also include those that usually have a greater impact on inflation. 1ˆ ππ|π tttt EMC t (9) This equation is used for our estimation and econo- metric analysis. Due to lack of information, we were not able to incorporate θ in the econometric specification. 3.2. Econometric Issues To prove our main hypothesis, we estimated an SVAR by selecting variables that are usually accepted as deter- minants for inflation in our Post-Keynesian approach. Empirically speaking, the most significant production costs for the Mexican economy are the following: gaso- line prices (g) real minimum wages (w), nominal ex- change rate (n), nominal interest rate (r) and GDP (see Figure 1A in appendix)8. All the variables are expressed in the first difference of their logarithm, which not only avoids unit root problems but also allows a readily eco- nomic interpretation. The correct specification of a VAR demands a proper selection of variables and lags. According to the usual criteria9, we initially estimated an unrestricted VAR (2). Our specification did not change with different restric- tions on short and long run models10. To test the robust- ness of the relations found in the unrestricted VAR, we identified the contemporaneous innovations through the methodology used by Bernanke [25], Sims [26] and Stock & Watson [27]. The SVAR can evaluate causality, sensitivity and dy- namic responses by eliminating the undesired distur- bances as a result of a proper identification which comes from a correct identification of the stochastic process behind each variable and from a relevant economic the- ory. As a result, the sensitivity coming from the con- temporaneous transmission mechanisms are accurately detected. An unrestricted VAR is estimated on the basis of the lagged endogenous and exogenous variables: 1ttt ydCy (10) where yt is a vector of endogenous variables dt is a vector of deterministic components (constant, trend and dummy variables) and t is the vector of innovations. In Equation (10) the contemporaneous effects among the variables are explained but they are contained in the variance and covariance matrix generated in vector t. An analysis of a primitive VAR leads us to a better understanding. Let us consider the following expression [28]: Byt = dt + Ayt–1 + t (11) The VAR in its reduced form (10) is just a reparame- trization of the most general specification of (11). In fact, it is easy to observe since C = B–1A and t = B–1 t. The above implies that the residuals of (10) are linear combinations of the non-correlated shocks t. To recover the contemporary interactions contained in matrix B, Cholesky’s [29] triangular procedure is usually applied. Nevertheless, a proper identification coming from the economic theory and from the own structure of the data requires ad hoc restrictions to compute more accurately the IR functions. Furthermore, it allows the identification of the system11. 4. Discussion The SVAR ordering and specification were made in con- 9Final Prediction Error, Akaike, Schwarz, Hannan-Quinn & LR. 10When estimating with 1 or 3 lags, the impulse response (IR) tests did not register important changes. Regarding the VAR (1), sensitivity weakened but not in the sense of responses, although the results of the variance decomposition changed. More lags dramatically reduced the degrees of freedom to the point that it was not possible to calculate heteroskedasticity. In all cases, the assumptions of correct specification were accomplished (see Table 2A in the statistical appendix). 11This states that the number of non-cero elements in the B matrix must be equal to or less than (n2 – n)/2 [28]. 8The latter is only incorporated to contrast the neoclassic hypothesis that claims that economic growth may turn out to be inflationary. Copyright © 2011 SciRes. ME  E. LORÍA ET AL. 839 g gruence with the theoretical and statistical causal rela- tions, going from the most exogenous to the endogenous variables. We obtained a final and correct statistical specification12 which is over identified (with one degree of freedom) (Figure 7). Considering only the equations of interest, we have: D(pt) = 1.646 × εD(n) + 0.471 × εD(g) + 0.069 × εD(r) + εD(p) D(yt) = –1.051 × εD(n) + 0.477 × εD(g) + 0.835 × εD(p) + εD(y) The signs and relations found are consistent with our theoretical approach and allow us to make the following statements: 1) Prices are positively influenced by all variables with the exception of GDP and real wages14. Therefore, the hypothesis thatclaims that economic growth and wages are naturally—and by themselves—inflationary is re- jected. In any case, we should refer to a specification of the modern Phillips Curve that expresses inflation as a function of the GDP gap and not of its level and varia- tions (Galí [30]; Carlin & Soskice [26]). 2) The positive effect of interest rate on inflation is proven which is in line with the main hypothesis of this paper. 3) GDP growth is positively affected by gasoline costs and most remarkably suffers the recessive effect of no- minal exchange rate devaluations. Gasoline’s positive effect is remarkable and could be indirectly explained in the sense that gasoline tax is very important to finance public budget. This way, we suggest that the VAR may capture this final effect which is higher than that result- ing from household income reduction derived from gaso- line price increases. Now considering Figure 8 where the short run IR of the SVAR is depicted, the following analysis can be de- () () 21 () 31 323536 () 41 4346 () 51 5254 51 5253() 100000 () 10000 () 10 () 010 () 010() 001 () Dn t Dg t Dw t Dr t Dp t tDy Dn bD bbbb Dw bb bDr bb bDp bbb Dy Figure 7. Short run identification matrix13. rived:15 1) In Figure 8 we observe a strong and immediate in- flationary effect coming from the exchange rate. 2) The positive effect of gasoline prices to inflation is not very significant and only lasts one period. 3) The effects of interest rate shocks to inflation rate shocks are not immediate since they start in the second period and have an easily observed positive effect with an approximate duration of two periods (years). The variance decomposition analysis shows useful and interesting insights in terms of our main hypothesis (see Table 2). With this purpose, we only analyze the shocks on inflation and on GDP. Regarding the first variable we noted that: 1) The greatest effect is generated by the exchange rate followed by the interest rate. From the beginning and up to period 20, they altogether represent approxi- mately 70% of the inflation variation. 2) Unlike other works, there is no great inflation iner- tia. The opposite would probably occur in series of greater frequency or for different historical periods (i.e. the 1980s). 3) It has been previously noted that the price of gaso- line and wages have insignificant weight on inflation which would require a deeper analysis and, at the mo- ment, surpasses the purpose of the present research. 4) The effect of GDP growth is more important on prices than that of wages, although it was noticed that the first effect is statistically non-significant. Table 2. Variance decomposition. Variance Decomposition of D(p): PeriodS.E.D(n) D(g)D(w) D(r) D(p)D(y) 1 0.12869.4005.6640.000 0.159 24.7780.000 5 0.27249.6532.0910.790 22.674 11.83412.958 10 0.28946.5622.2010.801 24.633 10.93114.871 15 0.29046.5102.2100.806 24.637 10.93514.903 20 0.29046.5052.2090.806 24.641 10.93414.905 Variance Decomposition of D(y): PeriodS.E.D(n) D(g)D(w) D(r) D(p)D(y) 1 0.02436.1747.4310.000 0.000 21.68534.710 5 0.03442.8117.4677.332 3.559 18.94919.882 10 0.03541.4648.2867.230 5.517 18.01219.491 15 0.03641.3048.3267.216 5.709 17.92019.525 20 0.03641.3018.3307.217 5.710 17.92119.522 12LR Test: χ2 (1) = 2.647 (0.104). See Tables 1A and 2A in the appen- dix. 13D(nt) = first difference of logarithm of nominal exchange rate; D(gt) = first difference of logarithm of gasoline prices; D(wt) = first differ- ence of logarithm of real minimum wages; D(rt) = first difference o logarithm of nominal interest rate and D(yt) = first difference of loga- rithm of GDP. 14The non-statistical insignificance of GDP shocks to inflation – evalu- ated by the confidence bands – and the scarce specific weight in the variance decomposition of wages are notorious. 15All responses to the shocks disappear before 20 periods which dem- onstrate the system’s dynamic stability. Only at 95% of confidence IR might be considered significant according to the range determined by the confidence bands for ±2 standard errors. In this sense, the validity of the shocks only cover up when one of the bands reaches zero, which means that statistically, the response disappears (Valdés [31]; Gulli [32 and Calderón & Méndez [33]). Copyright © 2011 SciRes. ME  E. LORÍA ET AL. Copyright © 2011 SciRes. ME 840 Figure 8. SVAR impulse-response (short run). 5) Unlike inflation, GDP growth shows a higher auto- regressive feature. 6) The exchange rate is the most important variable af- fecting GDP. To analyze the long run effects, we applied the proce- dures developed by Blanchard & Watson [34] and Blanchard & Quah [2] and we imposed the correspond- ing restrictions now in matrix C. Blanchard & Quah’s [2] methodology specifically consists in representing the variables of study through moving averages and then finding its temporary path with transitory and permanent components: Byt = A(L)yt + et (14) yt = B*(L)yt + t (15) where B* = B–1A; t = B–1et; L is the lag operator and e refers to the residuals of the transitory and permanent effects. The SVAR representation in moving averages (MA) is described as: yt = [I – B*(L)]–1 t (16) yt = C(L) t (17) Vector t = B–1et represents the independent innova- tions that have the property of being white noise and the matrix of coefficients Cij(L) represents the polynomial of the lag operator L. From the matrix representation (17) inflation and output paths with permanent effects are derived, considering that the transitory effects must fol- low a stochastic process that is strictly stationary, et N(0, 2), unlike the permanents. We obtained a correct over- identified specification—once again—with one degree of freedom ( 2(1) = 2.691(0.1009)) (Figure 9). The results shown in Figure 10 lead to the following introspective suggestions: 1) In the long run exchange rate and inflation shocks have positive and permanent effects on inflation which confirms the existence of the pass through effect and inflationary inertia. 2) The increase in interest rate affects inflation posi- tively and permanently, which is coherent with the short run results previously obtained. 3) Figure 10(d) shows that even though there are posi- tive contemporary effects (in the short run) of GDP to inflation, after one period they turn negative and disap- pear, which again is consistent with our post-Keynesian framework. Finally, Figure 11 presents the structural response of GDP growth in the long run and can be summarized as follows: 1) Exchange depreciations have a negative impact on 1113 14 15 16 21 2223 242526 33 34 35 36 44 45 46 55 66 0 00 000 0000 0 00000 C CCCC CCCCCC CCCC CCC C C Figure 9. Long run identification matrix.  841 E. LORÍA ET AL. Figure 10. SVAR impulse-response (long run). Figure 11. SVAR impulse-response (long run). output (for 3 periods-years) due to the foreign depend- ency (imported components) on production; this also explains why the authorities have always tried by all means to anchor the exchange rate-both nominal and real. 2) Interest rate shocks negatively impact output and for a much longer time (5 years), compared to those coming from the exchange rate (3 years). 3) Against what is consistently argued by main stream economics, inflation has a “positive effect” on output. Although this result deserves a deeper investigation, we could say that inflation (at a low and stable level) plays the role of a system lubricant, and therefore expands output. 5. Conclusions Once the evolution of growth and inflation related to the monetary policy in Mexico (1970-2009) has been studied, we concluded that—in general terms—the Banco de Mexico stabilization strategy has followed a restrictive monetary policy even before IT was implemented. Since the nineties, Inflation Targeting has been effective in reducing inflation but at the cost of depressing economic Copyright © 2011 SciRes. ME  E. LORÍA ET AL. 842 activity. This is reflecting that inflation in Mexico is not mainly a monetary phenomenon, but that conversely, it is responding to production costs where the exchange rate is very important due to the huge productive dependency on imports. Therefore, depreciations are highly infla- tionary and recessive, at least in the short run. That ex- plains why the monetary authority acts “managing” the exchange rate through changes in monetary aggregates and interest rates to anchor nominal and real exchange rates. Nevertheless, by raising interest rates, there are huge costs for businesses and families along with raising the public debt (payment) and consequently, depresses economic growth and increases unemployment. This outcome is very clear after 2000. This is why it is essential for the monetary authority to search for new mechanisms to provide the Banco de Mexico with multiple targets, not only with the objective of restraining inflation but also dealing with unemploy- ment as well as assigning growth objectives for the monetary policy and the exchange rate. This additional mandate must be based on the “success” of IT. That is, to continue in terms of transparency, reputation and credi- bility that have been achieved. There is no doubt that economic growth must be the most important goal to reach since inflation (high and unstable rate, like those of the 1980s) has been defeated. 6. Acknowledgements This article received financial support from the research project Determinants of Output and Employment in Mexico, 1985.1-2006.4: A Multivariate Econometric Approach, IN305208 DGAPA, UNAM. Javier Galan’s participation was crucial in the elaboration of the paper. We thank the comments of Guadalupe Mántey and Nora Ampudia which improved the initial version, and also, the assistance of Ariadna Díaz. The usual disclaimer applies. 7. References [1] L. Ball, “Hysteresis in Unemployment,” Johns Hopkins University, Preliminary, 2008. [2] O. Blanchard and D. Quah, “The Dynamic Effects of the Aggregate Demand and Supply Disturbances,” American Economic Review, Vol. 79, No. 4, 1989, pp. 655-673. [3] J. Taylor, “Discretion Versus Policy Rules in Practice,” Carnegie-Rochester Conference Series on Public Policy 39, North-Holland, 1993, pp. 195-214. [4] F. Kydland and E. Prescott, “Rules Rather than Discre- tion: The Inconsistence of Optimal Plans,” Journal of Po- litical Economy, Vol. 85, No.3, 1977, pp. 473-492. [5] R. Barro and D. Gordon, “Rules, Discretion and Reputa- tion in a Model of Monetary Policy,” Journal of Mone- tary Economics, Vol. 12, 1983, pp. 101-121. [6] A. Cukierman, “Central Bank Strategy, Credibility and Independence: Theory and Evidence,” MIT Press, Cam- bridge, 1993. [7] H. Johnson, “Revolution and Counter-Revolution in Economics from Lord Keynes to Milton Friedman,” En- counter, Vol. XL, No. 10, 1971, pp. 1883-1946. [8] M. Ramos-Francia and A. Torres, “Inflation Dynamics in Mexico: A Characterization Using the New Phillips Curve,” The North American Journal of Economics and Finance, Vol. 19, No. 3, 2006, pp. 274-289. [9] J. Stiglitz, “The Failure of Inflation Targeting. Project Syndicate,” Columbia University, 2008. www.project-syndicate.org [10] F. S. Mishkin, “Inflation Targeting in Emerging Market Countries,” American Economic Review, Vol. 90, No. 2, 2000, pp. 105-109. doi:10.1257/aer.90.2.105 [11] B. Bernanke and F. S. Mishkin, “Inflation Targeting: A New Framework for Monetary Policy?” Journal of Eco- nomic Perspectives, Vol. 11, No. 2, 1997, pp. 97-116. doi:10.1257/jep.11.2.97 [12] S. Kurczyn, “Transparencia de la Política Monetaria y Democracia en México,” In: F. Chávez,, Ed., Moneda y régimen cambiario en México, UAM-Azcapotzalco, 2003. [13] M. Schwartz, “Consideraciones sobre la instrumen- tación práctica de la política monetaria. Banco de Mexico,” Banco de México, Working Paper: 9804, 1998,. [14] S. Castellanos, “El efecto del corto sobre la estructura de tasas de interés,” Banco de México, Working Paper: 2000-01, 2000,. [15] A. Díaz de León and L. Greenham, “Política Monetaria y Tasas de Interés: Experiencia Reciente para el Caso de México,” Banco de México, Working Paper: 2000-08, 2000. [16] L. Martínez; O. Sánchez and A. Werner, “Considera- ciones Sobre la Conducción de la Política Monetaria y el Mecanismo de Transmisión en México,” Banco de Mexico, Working Paper: 2001-02, 2001. [17] F. S. Mishkin, “Does Stabilizing Inflation Contribute to Sta- bilizing Economic Activity?” National Bureau of Economic Resear c h , Working Paper: 13970, 2008. [18] A. Carstensand and A. Werner, “.Mexico’s Monetary Policy Framework under a Floating Exchange Rate Re- gime,” Banco de México, Working Paper: 1999-05, 1999. [19] E. Elizondo, “Aspectos Diversos del Régimen Cambiario de México, 1994-2002,” In: F. Chávez, Ed., Moneda y régimen cambiario en México, UAM-Azcapotzalco, 2003. [20] F. Rubli, “En Búsqueda del Régimen Monetario más Eficiente,” In: F. Chávez, Ed., Moneda y Régimen Cam- biario en México, UAM-Azcapotzalco, 2003. [21] L. M. Galindo and J. Ros, “Alternatives to Inflation Tar- geting in Mexico,” International Review of Applied Eco- nomics, Vol. 22, No. 2, 2008, pp. 201-214. [22] H. Contreras and O. Amador, “México: El Proceso Copyright © 2011 SciRes. ME  E. LORÍA ET AL. Copyright © 2011 SciRes. ME 843 Inflacionario 2008. Una revisión del primer cuatrimestre,” Economía Informa, Vol. 142, No. 352, 2008, pp. 127-146. [23] J. Perloff, “Microeconomics,” Addison-Wesley, Reading, 1999. [24] W. Carlin and D. Soskice, “Macroeconomics Imperfec- tions, Institutions and Policies,” Oxford University Press, Oxford, 2006. [25] B. Bernanke, “Alternative Explanations of Money— Income Correlation,” NBER Working Paper No. 1842, Vol. 18, No. 1, 1986, pp. 50-70. [26] C. Sims, “Are Forecasting Models Usable for Policy Analysis?” Quarterly Review of the Federal Reserve Bank of Minneapolis, No. Winter, 1986, pp. 1-16. [27] J. H. Stock and M. W. Watson, “Vector Autoregression,” Journal of Economic Perspectives, Vol. 15, 2001, pp. 101- 115. [28] W. Enders, “Applied Econometric Time Series,” 2nd Edition, Wiley & Sons Inc, New York, 2004. [29] C. Sims, “Macroeconomics and Reality,” Econometrica, Vol. 48, No. 1, 1980, pp. 1-48. [30] J. Galí, “Monetary Policy, Inflation, and the Business Cycle. An Introduction to the New Keynesian Frame- work,” Princeton University Press, Princeton, 2008. [31] R. Valdés, “Transmisión de la Política Monetaria en Chile,” Central Bank of Chile Working Paper: 16, 1997. [32] I. Gulli, “Ley de Okun descomposición de las fluctuaciones económicas,” Documento de trabajo, Asociación Ar- gentina de Economía Política, 2005. www.aaep.org.ar/espa/ anales/works05/gulli.pdf [33] G. A. Calderón and J. J. Méndez, “Relación del Ciclo de Crecimiento de los Estados Unidos de América con el Ciclo de Crecimiento Económico de Guatemala,” Notas monetarias Banco de Guatemala, 2009. http://www.banguat.gob.gt/inveco/notas/articulos/envolve r.asp?karchivo=3201&kdisc=si [34] O. Blanchard and M. Watson, “Are Business Cycles All Alike?” National Bureau of Economic Research (NBER), Working Paper: 1392, 1984. [35] Banco de Mexico, “Informes anuales de política monetaria,” (several years). http://www.banxico.org.mx [36] INEGI, “Sistema de Cuentas Nacionales de México,” (several years). http://200.23.8.5/est/contenidos/espanol/proyectos/metad atos/derivada/scnmsa_41.asp?c=4610 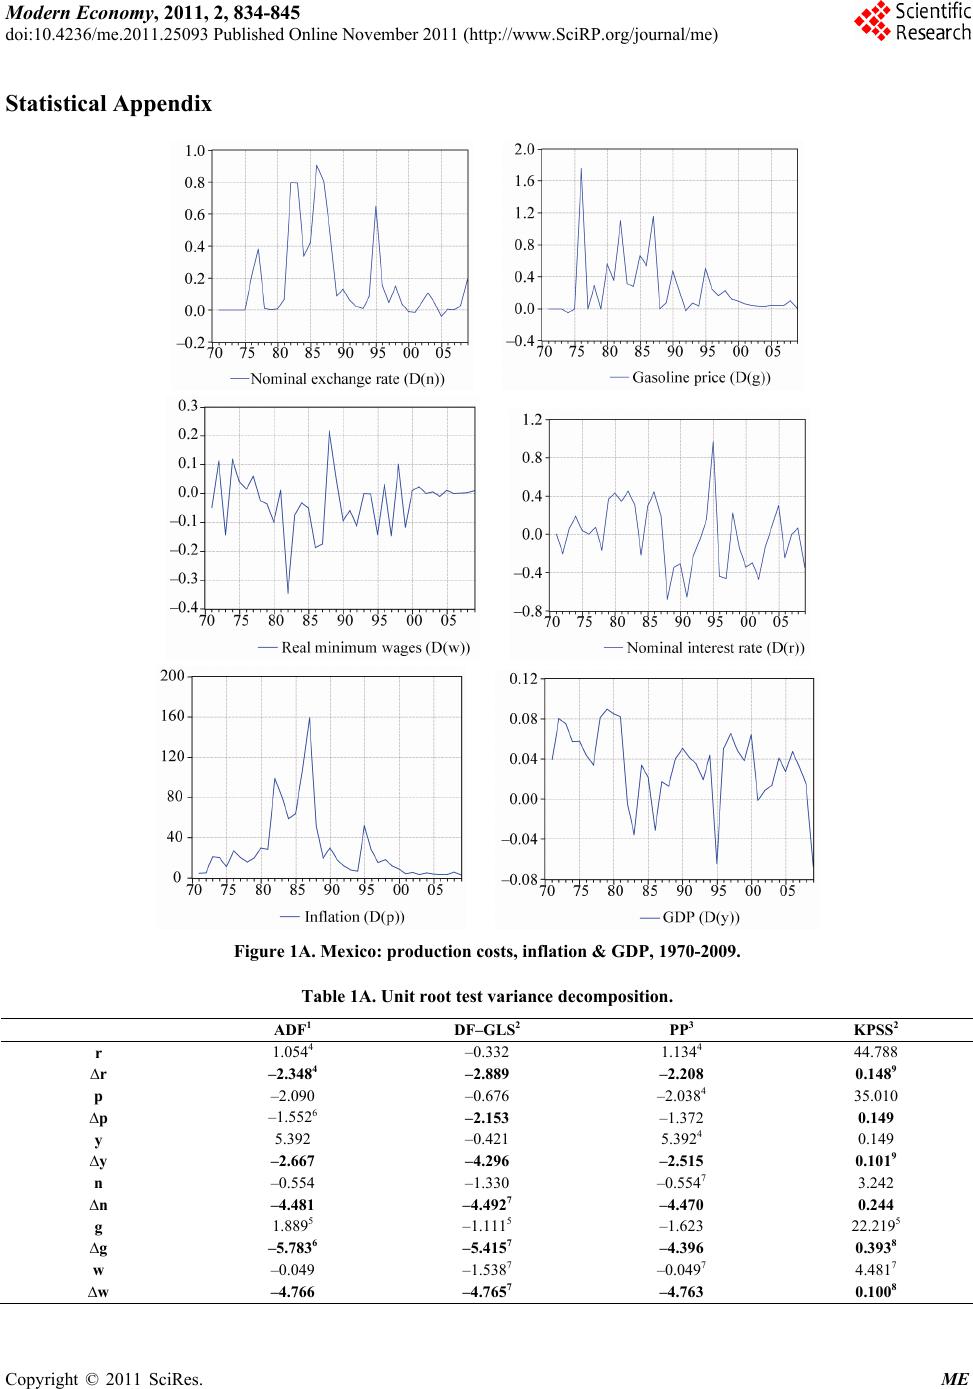 Modern Economy, 2011, 2, 834-845 doi:10.4236/me.2011.25093 Published Online November 2011 (http://www.SciRP.org/journal/me) Copyright © 2011 SciRes. ME Statistical Appendix Figure 1A. Mexico: production costs, inflation & GDP, 1970-2009. Table 1A. Unit root test variance decomposition. ADF1 DF–GLS2 PP3 KPSS2 r 1.0544 –0.332 1.1344 44.788 ∆r –2.3484 –2.889 –2.208 0.1489 p –2.090 –0.676 –2.0384 35.010 ∆p –1.5526 –2.153 –1.372 0.149 y 5.392 –0.421 5.3924 0.149 ∆y –2.667 –4.296 –2.515 0.1019 n –0.554 –1.330 –0.5547 3.242 ∆n –4.481 –4.4927 –4.470 0.244 g 1.8895 –1.1115 –1.623 22.2195 ∆g –5.7836 –5.4157 –4.396 0.3938 w –0.049 –1.5387 –0.0497 4.4817 ∆w –4.766 –4.7657 –4.763 0.1008 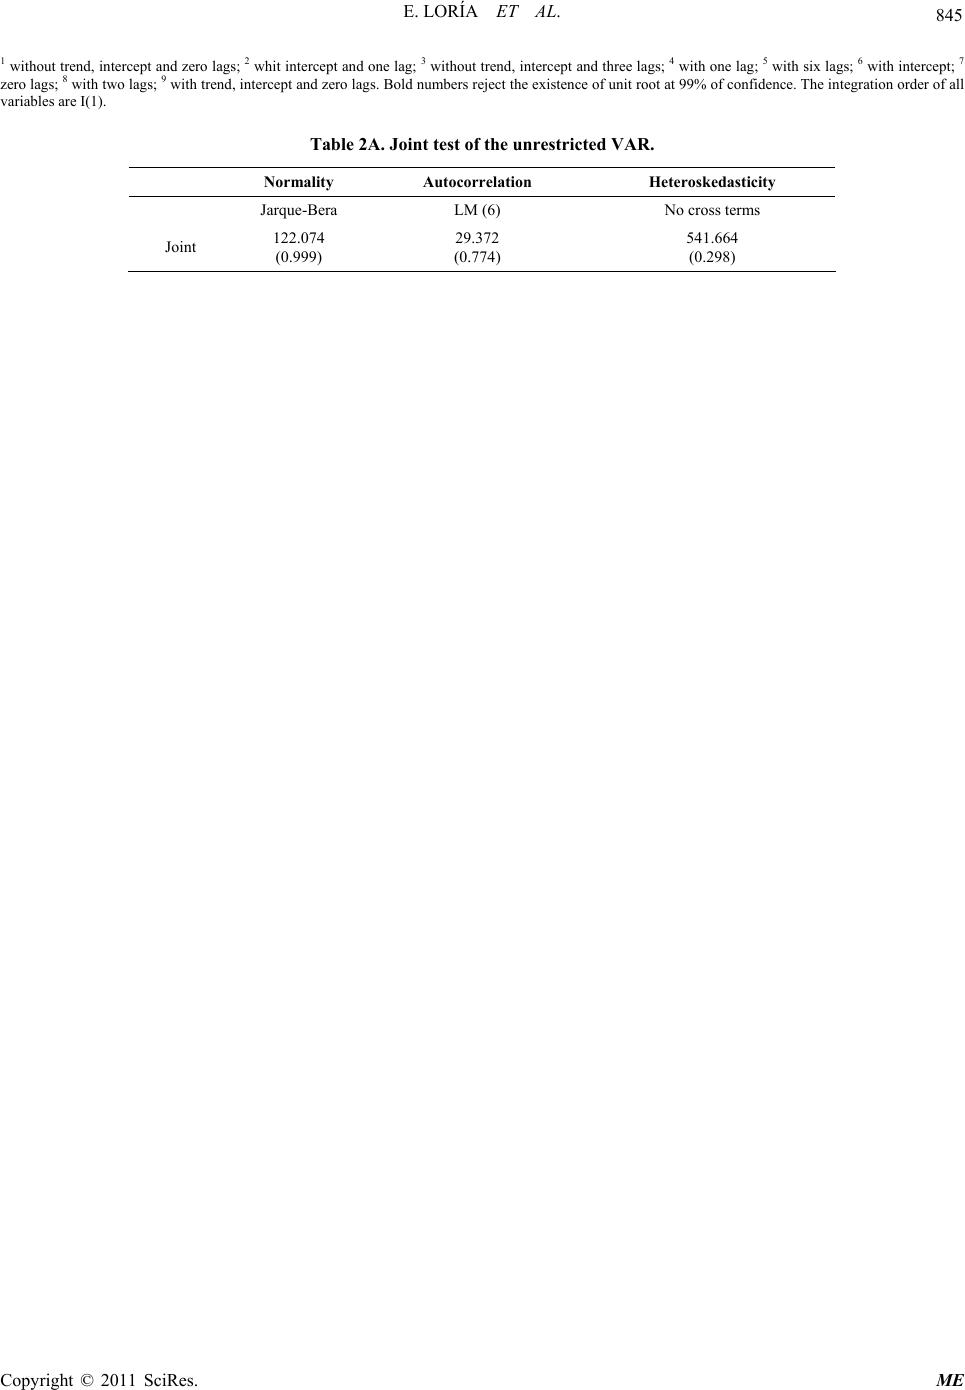 E. LORÍA ET AL. Copyright © 2011 SciRes. ME 845 1 without trend, intercept and zero lags; 2 whit intercept and one lag; 3 without trend, intercept and three lags; 4 with one lag; 5 with six lags; 6 with intercept; 7 zero lags; 8 with two lags; 9 with trend, intercept and zero lags. Bold numbers reject the existence of unit root at 99% of confidence. The integration order of all variables are I(1). Table 2A. Joint test of the unrestricted VAR. Normality Autocorrelation Heteroskedasticity Jarque-Bera LM (6) No cross terms Joint 122.074 (0.999) 29.372 (0.774) 541.664 (0.298)
|