 Modern Economy, 2011, 2, 814-822 doi:10.4236/me.2011.25090 Published Online November 2011 (http://www.SciRP.org/journal/me) Copyright © 2011 SciRes. ME The Impacts of Foreign Bank Entry on Credit Scale and Business Structure of Chinese Commercial Banks* Xiaoyan Huang, Yong Zeng School of Management and Economics, University of Electronic Science and Technology of China, Chengdu, China E-mail: xiaoyan20071015@yahoo.cn, zengy@uestc.edu.cn Received May 16, 201 1; revised June 29, 2011; accepted July 18, 2011 Abstract We employ a data set comprising 31 banks for the period 2002-2009 to investigate the impacts of foreign bank entry on credit scale and business structure in China. In this paper, foreign bank entry means the entry of both greenfield and strategic investment. The empirical results show that the foreign bank entry is not as- sociated with the growth of credit scale, but significantly improves domestic banks’ business structure. Fur- thermore, the network and informational advantages are the main considerations of foreign banks when en- tering into China through the mode of “minority equity stake”. Keywords: Foreign Bank Entry, Credit Scale, Business Structure, Chinese Commercial Banks, Foreign Strategic Investors, Spillover Effect 1. Introduction The banking system, as an essential part of Chinese fi- nancial system, has experienced unceasing reforms over the last three decades. It evidenced significant policy shifts around 1990, and 2001 when China joined WTO [1]. Before reforms begun in 1978, China had been very conservative in allowing the entry of foreign banks. In 1979, the Export-Import Bank of Japan become the first foreign bank allowed to open a representative office in Beijing, which is the prologue to the reform and open- ing-up of Chinese banking system [2]. In 1981, foreign banks were allowed to open operational branches in Spe- cial Economic Zones of China, which indicates the Chi- nese banking system had made substantial progresses. Then, Nanyang Commercial Bank, the first foreign bank opening operational branches in China, opened an opera- tional branch in Shenzhen. In a word, there were not many foreign banks in China before 1990 because of the strict policy. Since 1990, Chinese government has begun to allow foreign banks to enter more cities and to do business with Chinese enterprises by taking deposits and making loans in RMB. According to the Almanac of China’s Finance and Banking, 190 operational branches had been opened by the end of 20011. Besides, regulatory permis- sion for foreign strategic investors to hold “minority eq- uity stakes”2 in Chinese banks was forthcoming. The first case was in 1996, when Asian Development Bank (ADB) bought a 3.29% stake in China Everbright Bank [2,3]. In 1999, International Finance Corporation (IFC) bought a 5% stake in Bank of Shangh ai. This was followed by the purchase of a 15% stake of Bank of Nanjing (Nanjing City Commercial Bank) by IFC and acquisition of an 8% stake in Bank of Shanghai by The Hong Kong and Shanghai Banking Corporation Limited (HSBC) at the end of 2001. To sum up, more foreign banks entered into China through varying entry modes at a relatively slow speed from 1990 to 2001. On December 11, 2001, China gained entry into the World Trade Organization (WTO). New policies at- tracted more and more foreign banks and accelerated the 1Operational branches are defined by China Banking Regulatory Com- mission (CBRC), including head offices, branches, sub- ranches and subsidiaries of stand-alone holding companies, and branches, sub-bran- ches of foreign banks. 2“Administration of equity investment of overseas financial institutions in Chinese-funded financial institutions procedures Foreign”issued by CBRC rules that the percentage of equity investment of a signal over- seas foreign institution in a Chinese-funded financial institution may not exceed 20%, and the aggregate percentage of equity investment o multiple overseas financial institutions may not exceeds 25%. We regard this situation as “minority equity stake”. *Supported by National Natural Science Foundation of China under Grant No. 70872016.  X. Y. HUANG ET AL. 815 reform and opening-up of Chinese banking system. Ac- cording to the Almanac of China’s Finance and Banking, the number of greenfield banks had almost increased up to 600 by the end of 2009, almost three times of that in 2001. The total assets of foreign banks reached RMB 1.35 trillion, accounting for 1.71 percent of total banking assets in China. Meanwhile, according to the Annual Report of China Banking Regulatory Commission (CBRC), 31 Chinese commercial banks had introduced foreign strategic investors by the end of 2009. After 1979, especially after WTO entry, policy shift accelerates the opening-up of Chinese banking system. More and more foreign banks have entered. However, the impacts of foreign bank entry are debatable. There are three kinds of viewpoints as follows. Firstly, foreign banks are regarded as “wolves” which will threat the existence of Chinese banks. Secondly, some people be- lieve that the increasing number of foreign banks can intensify the banking competition, and spillover effects can be generated with the foreign bank entry. Both com- petition and spillover effects can improve the efficiency of Chinese banks. Thirdly, some people argue that, com- pared with Chinese banks, foreign banks are still small in scale, having little impact on China’s banking industry. Aiming at this debatable situation, we make an empirical study to test the impact of foreign banks. Our main empirical focuses are on credit scale and business structure. China’s credit market attracts foreign banks because of its high interest spread. In addition, credit scale has significant impacts on macroeconomic and commercial banks. From the macroeconomic per- spective, the flexible and controllable credit scale is the key of monetary policy. From the financing perspective, indirect financing accounts for a big share in China at present, that is to say bank loans are the main funds for enterprises. From the bank income str ucture, the shar e of non-interest income ha d been low for a long time and the income of banks mainly came from the interest spread. In summary, it is significant to study the impact of for- eign bank entry on credit scale and business structure. Loans are the main parts of both businesses and assets of Chinese commercial banks. However, with the devel- opment of banking system, the fast developing interme- diate businesses are more important to banks. Business structure is defined as the ratio of credit to assets in this paper, and will affect the profitability, risk status and sustainability of banks. Therefore, we will also study the impact of foreign bank entry on bu siness structur e. The remainder of the paper is organized as follows. Section 2 reviews literature. Section 3 discusses the de- sign of our empirical study. Section 4 presents the em- pirical results and analysis. Section 5 provides conclu- sions. Section 6 and 7 are acknowledgement and refer- ences, respectively. 2. Literature Review Based on credit scale studies, there are two different views on the impact of foreign bank entry on credit scale. Reference [4] shows that the entry of foreign banks can enlarge the total credit for 38 developing countries and long-term loans are less rate-constrained in countries with high fo reign bank pr esence. Reference [5] finds that for East European countries the credit scales increase quickly with the entry of foreign banks and foreign bank entry improves access to credit for private sectors. Also, reference [6] finds that for Central European and Baltic countries, with the fierce competition on limited large enterprises and the promotion of screening ability on small and medium sized enterprises (SMEs), foreign banks improve access to credit for SMEs and even retail market. Reference [7] figures out that for countries with high presence of foreign banks, both large companies and SMEs face low financing obstacles. However, the theoretic and empirical studies in [8] show that the entry of fo reign banks reduces credit scale. Reference [9] finds that foreign banks tend to lend to big enterprises but not SMEs. Reference [10] shows that for East Europe, Latin America, Middle East and Asia coun- tries that multinational banks only lend to multinational enterprises and high quality clients, and domestic banks are not able to lend to SMEs in order to avoid risk. As for business structure studies, References [11,12] find that the entry of foreign banks reduces the ratio of non-interest income to whole income. Reference [13] shows that the same results based on panel data available for the 1994-2004 period of 14 banks in China. These studies suggest that for eign ban k entr y is no t good for th e adjustment of business structure. However, [14] makes an empirical test using monthly data available for the 1993-1995 period and finds that the ratio of loan to as- sets decreases with the increase of fo rei gn bank presence, that is to say, foreign bank entry improves the business structure of domestic banks. Reference [15] finds that the foreign bank entry makes Chinese banks pay more atten- tion to businesses besides deposits and loans. To sum up, foreign bank entry has ambiguous effects on credit scale and business structure. Owing to a few studies on China’s banking system, we make an empiri- cal study on Chinese commercial banks. 3. Empirical Analysis 3.1. Sample Since our focus is on China, we restrict our analysis to C opyright © 2011 SciRes. ME  X. Y. HUANG ET AL. Copyright © 2011 SciRes. ME 816 the Chinese commercial banks. The number of samples is 31. We divide the samples into two types, namely do- mestic banks with and without foreign investment. Table 1 gives the abbreviations for sa mples and the years of the first entry of foreign investment. More than 99 percent of commercial banks’ assets are in the 31 samples, so the samples can stand for the whole commercial banks. The data set for the period from 2002 to 2009 in this paper is provided by Bank-scope database, Almanac of China’s Finance and Banking, China Statistical Year- book and Annual Report of CBRC. Test indicators are credit scale and business structure, measured by the growth of loan and the ratio of loan to assets, respec- tively. We compare the difference of credit scale and busi- ness structure between the Chinese banks with or without foreign investment using the method of [1]. Table 2 gives the results of descriptive statistics. It can be found that there is no significant difference in credit scale and business structure between the two types of banks. 3.2. Variables and Models In order to investigate the effects of foreign bank entry on credit scale and business structure of domestic banks, we need variables that measure the greenfield and strate- gic investment. In line with [11], we use two different variables to measure the presence of foreign banks th- rough greenfield investment. First, we take the share of foreign bank assets to total ban k assets of China ( BA). This measure takes into account the size of foreign banks as compared to their domestic counterparts. Second, we adopt the ratio of the number of foreign banks to th e total number of banks in China ( BN ). This measure basi- cally looks at the sheer presence of foreign banks. Both variables are calculated based on the data set provided by the Almanac of China’s Finance and the Banking and Annual Report of CBRC. Finally, we take a dummy variable to measure foreign strategic invest- ment. POST Some foreign banks enter into China through green- field approach as well as by “minority equity stake”. That is to say, some of greenfield banks may be not only greenfield banks but also foreign strategic investors. Table 1. List of sample banks. The abbreviations for banks with for eign investm ent and the years of the first entry of foreign investment Abbr.TimeAbbr.TimeAbbr. Time Abbr.Time BSH2001BNJ2001SPDB 2002 CIB2003 BOCOM2004SDB2004QLB 2004 HZB2005 BOC2005BOB2005CCB 2005 HXB2005 CQB2006ICBC2006GDB 2006 NBB2006 CITIC2006BQD2007YTB 2008 XMB2008 The abbreviations for banks without f orei gn investm e nt ABC PAB BNC QSB CMBC BODG BODL CEB CMB HKB BOW Note: Foreign investment is regarded as strategic one when the percentage of equity investment of foreign institution(s) in a Chinese financial institu- tion is eq ual to or exceeds 5 % in thi s paper. BS H is Bank of Shan ghai. BNJ is Bank of Nanjing Co., LTD. SPDB is Shanghai Pudong Development Bank Co., Ltd. CIB is Industrial Bank Co., LTD. BOCOM is Bank of Com- munication. SDB is Shenzhen Development Bank Co., Ltd. QLB is Qilu Bank. HZB is Bank of Hangzhou. BOC is Bank of China. BOB is Bank of Beijing Co., Ltd. CCB is China Construction Bank. HXB is Huaxia Bank Co., Ltd. CQB is Bank of Chongqing. ICBC is Industrial and Commercial Bank of China Limited. GDB is Guangdong Development Bank. NBB is Bank of Ningbo Co., Ltd. CITIC is China CITIC Bank. BQD is Qingdao Bank. YTB is Yantai Bank. XMB is Xiamen Bank. ABC is Agricultural Bank of China. PAB is Pingan Bank. BNC is Bank of Nanchang. QSB is Qishang Bank. CMBC is China Minsheng Banking Corp., Ltd. BODG is Bank of Dongguan. BODL is Bank of Dalian. CEB is China Everbright Bank. CMB is China Merchants Bank Co., Ltd. HKB is Hankou Bank. BOW is Bank of Wenzhou. Table 2. Descriptive statistics. Indicator Variable Mean Median SE Maximum Minimum Samples All 24.01 21.89 17.11 83.50 –36.61 233 First type 24.36 21.64 17.63 83.50 –24.27 154 Second type 23.34 22.09 16.15 70.69 –36.62 79 Loan growth The difference 1.02 (0.67) –0.45 (0.91) All 53.72 53.45 7.57 71.1989 31.99 237 First type 53.41 52.48 7.58 71.198 9 31.99 156 Second type 54.31 55.80 7.55 68.9186 37.22 81 Loans/assets The difference –0.90 (0.39) –3.32 (0.27) Note: The difference statistical tests of mean and median are analyzed by T test and Wilcoxon/Mann-Whitney rank test, respectively. The values i n brackets ar e corresponding P values. “All” is the whole sample. “First type” is banks with foreign investment. “Second type” is banks without foreign investment. “The difference” is the difference between the two types of bank.  X. Y. HUANG ET AL. 817 Thus, in order to separate the effect of foreign strategic entry from that of the greenfield entry, and avoid multi- colinearity, we use the residual () of the variable Resid B regressed on the dummy to replace POST B in the multinomial regression. We first study the impact of foreign bank entry on the credit scale and model the growth of credit as a function of the presence of foreign banks or foreign strategic in- vestors, as well as control for ownership, bank character- istics, and macroeconomic environment. We construct the following two random effect (RE) panel data models: ,12 3,4 itt ii itti it LFB FSIOwnership Bank characteristicsMacro , ,t (1) ,1,23, 12 3, itit iit ii tiit LResidFSIPOST OwnershipBank characteristics Macro (2) where ,it is the credit scale—the credit growth of bank i in year t; t L B is the presence of foreign banks, and includes t BA and t BN ; i SI is a dummy variable that captures the difference of the two types of domestic banks; ,it is a dummy variable that captures the effect of foreign strategic investors; i are dummy variables (i POST Ownership SCB acteristics SIZE and i CCB ) that capture the effect of bank ownership (state-owned, joint-stock or city); , are variables that control for bank assets scale (), risk level (), business model (), capital constraint (), and growth of deposit ( TD ) for bank i at t. i char it Bank NI NPL MREG ac 2ro are variables that control for money supply ( —the growth of money supply), the degree of market competition () at time t. ,it is the substitution of the presence of foreign banks, and includes ,it 4CR Resid BAResid and ,it BNResid . i is the panel-level random effect. ,it is the random error term. Before conducting the test on the effect of foreign en- try on business structure, we make a Granger Causality Estimation between the presence of foreign banks and the ratio of loans to assets to grasp the relationship be- tween the greenfield banks and business structure. We adopt a unit root test of the variables, and the results in- dicate that they are stationary. Table 3 gives the results Table 3. The results of Granger causality estimation. Null hypothesis\P value Lag 1 Lag 2 Lag 3 S d oes not Granger Cause BN 0.1867 0.6181 0.0620* BN does not Granger Cause S0.0798* 0.0223** 0.0022*** S does not G ranger Cause FBA 0.0139** 0.5666 0.5468 FBA does not Granger Cause S0.0000*** 0.0001*** 0.0003*** Note: *** Significant at the 0.01 level. ** Significant at the 0.05 level. * Sig- nificant at the 0.10 level. of Granger Causality Estimation. The results of Granger Causality Estimation show that the entry of greenfield banks is the Granger cause of business structure. We use one period lag of variables and BS B, and construct the following models: ,1211 23 45,1i, itt ti ii tit it BSFB FBFSI OwnershipBankcharacteristics Macro BS ,t (3) ,1,2,13 4,1 2, 4,1 i, ititit i it i it t it it BSResid ResidFSI POST Ownership Bank characteristicsMacro BS 3 (4) where is the business structure—the ratio of loans to assets; 1t ,it BS B , ,1it BS and ,1it are lagged vari- ables by one period of t Resid B, and ,, respec- tively. In Equations (3) and (4), ,it , i ,it BSResid it Resid SI SIZE , ,it and are the same as t he ones in Equations (1) and (2). ,it includes , , , and . POST NPL i rship nk REG Owne Ba ch Maracteristics i NI acro refers to 2 . i is the panel-level random effect. ,it is the random error term. All the variables in this paper are given in Table 4. 4. Empirical Results We estimate Equations (1)-(4) using Eviews 6.0. Table 5 shows the estimation resu lts. Compared with other Chinese banks, 5 state-owned banks have such features as large size, high market share and historical problems left behind. Therefore, we make a robust test using samples except 5 state-owned banks, and the results are consistent with Table 5. Therefore, the empirical analysis is robust. Table 5 suggests that the presence of foreign banks is not associated with credit scale. The reason is that for- eign banks have some competitive disadvantages in China’s credit market. Although foreign banks have de- veloped fast since China entered WTO, the assets scale and number of foreign banks are small compared with domestic banks, and foreign banks lack branch networks and funds. According to the 2010 Report of Price Waterhouse Coopers (PwC) “Foreign banks in China”, the funds of foreign banks in China mainly come from their parent banks, deposits and interbank lending. That is to say, foreign banks’ funds are limited. For example, according to the Shanghai Statistical Yearbook, during 2002-2009 the deposit market share of all foreign banks in Shanghai, the city with the highest presence of foreign banks in China, is still less than 10%. Branch networks nd funds are the basement to engage in loans for banks. a C opyright © 2011 SciRes. ME 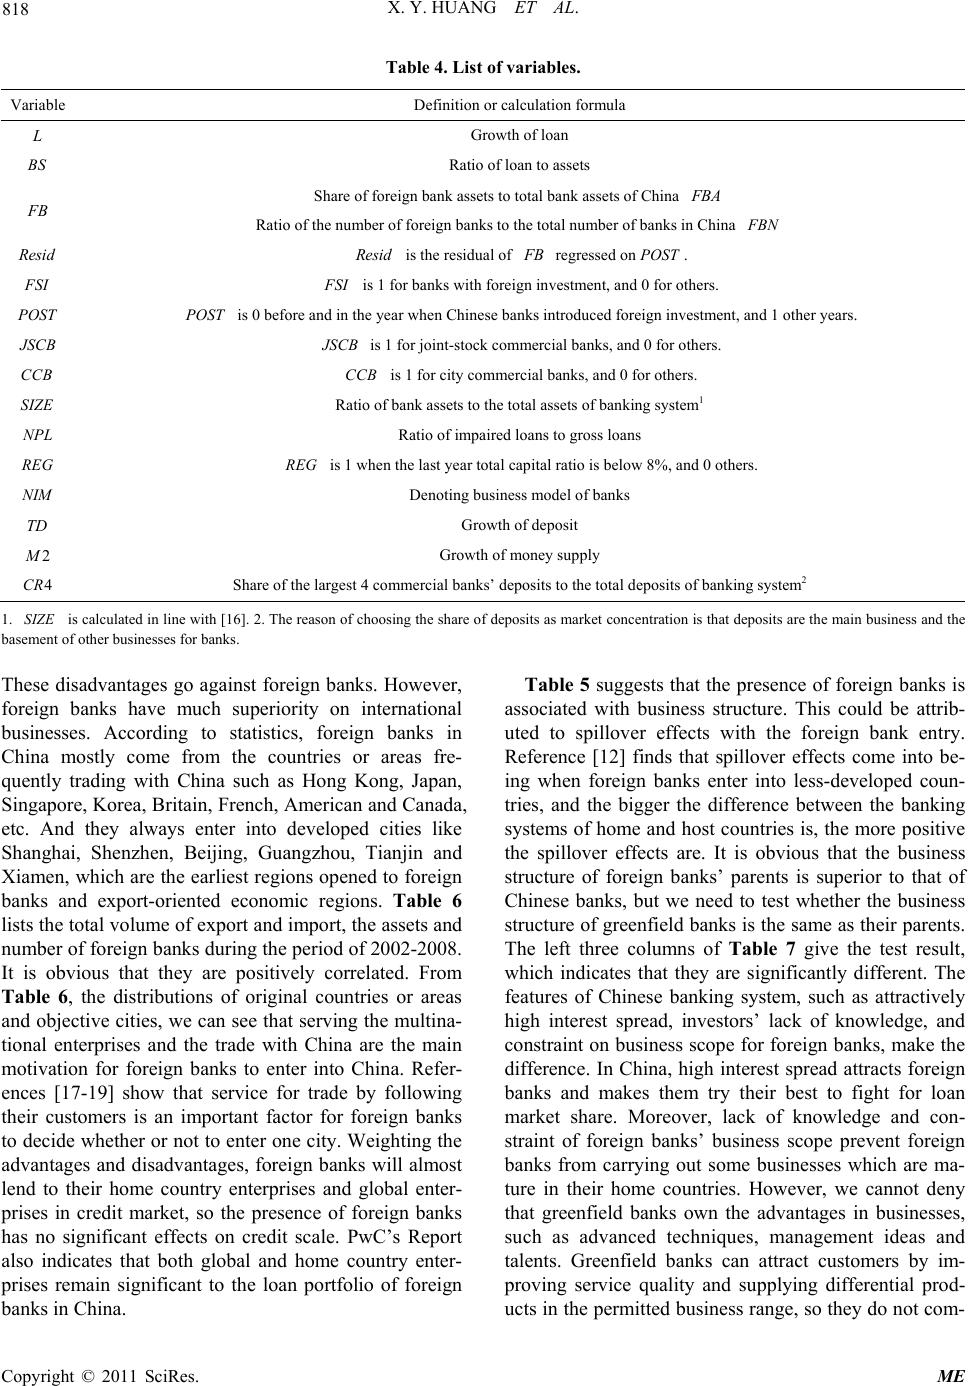 818 X. Y. HUANG ET AL. Table 4. List of variables. Variable Definition or calculation formula Growth of loan S Ratio of loan to assets Share of foreign bank a ss et s to t ot al bank assets of C hina FBA FB Ratio of the number of foreign banks to the total number of banks in China BN Resid Resid is the residual of regressed on. FB POST SI SI is 1 for banks with foreign investment, and 0 for other s. POST POST is 0 be fore and in the year when Chinese banks intro duced foreign investment, and 1 other years. SCB SCB is 1 for joint-stock commercial banks, and 0 for others. CCB CCB is 1 for city commercial banks, and 0 for others. SIZE Ratio of bank assets t o the total assets of banking system1 NPL Ratio of impaired loans to gross l oans EG EG is 1 when the last year total capital ratio is below 8%, and 0 others. NIM Denoting business model of banks TD Growth of deposit 2 Growth of money supply 4CR Share of the largest 4 commercial banks’ deposits to the total deposits of banking sy s tem2 1. is calcul ated in line wit h [16]. 2 . The reaso n of ch oosing t he shar e of depo sits as market co ncent ration is that d eposits are the main business and the basement of other businesses for banks. SIZE These disadvantages go against foreign banks. However, foreign banks have much superiority on international businesses. According to statistics, foreign banks in China mostly come from the countries or areas fre- quently trading with China such as Hong Kong, Japan, Singapore, Korea, Britain, French, American and Canada, etc. And they always enter into developed cities like Shanghai, Shenzhen, Beijing, Guangzhou, Tianjin and Xiamen, which are the earliest regions opened to foreign banks and export-oriented economic regions. Table 6 lists the total volume of exp ort and import, the assets and number of for eign banks durin g the per iod of 2002-2008. It is obvious that they are positively correlated. From Table 6, the distributions of original countries or areas and objective cities, we can see that serving the multina- tional enterprises and the trade with China are the main motivation for foreign banks to enter into China. Refer- ences [17-19] show that service for trade by following their customers is an important factor for foreign banks to decide whether or not to enter on e city. Weighting the advantages and disadvantages, foreign banks will almost lend to their home country enterprises and global enter- prises in credit market, so the presence of foreign banks has no significant effects on credit scale. PwC’s Report also indicates that both global and home country enter- prises remain significant to the loan portfolio of foreign banks in Chin a. Table 5 suggests that the presence of foreign banks is associated with business structure. This could be attrib- uted to spillover effects with the foreign bank entry. Reference [12] finds that spillover effects come into be- ing when foreign banks enter into less-developed coun- tries, and the bigger the difference between the banking systems of home and host countries is, th e more positive the spillover effects are. It is obvious that the business structure of foreign banks’ parents is superior to that of Chinese banks, but we need to test whether the business structure of greenfield banks is the same as their parents. The left three columns of Table 7 give the test result, which indicates that they are significantly different. The features of Chinese banking system, such as attractively high interest spread, investors’ lack of knowledge, and constraint on business scope for foreign banks, make the difference. In China, high interest spread attracts foreign banks and makes them try their best to fight for loan market share. Moreover, lack of knowledge and con- straint of foreign banks’ business scope prevent foreign banks from carrying out some businesses which are ma- ture in their home countries. However, we cannot deny that greenfield banks own the advantages in businesses, such as advanced techniques, management ideas and talents. Greenfield banks can attract customers by im- proving service quality and supplying differential prod- cts in the permitted busine ss range, so they do not com- u C opyright © 2011 SciRes. ME 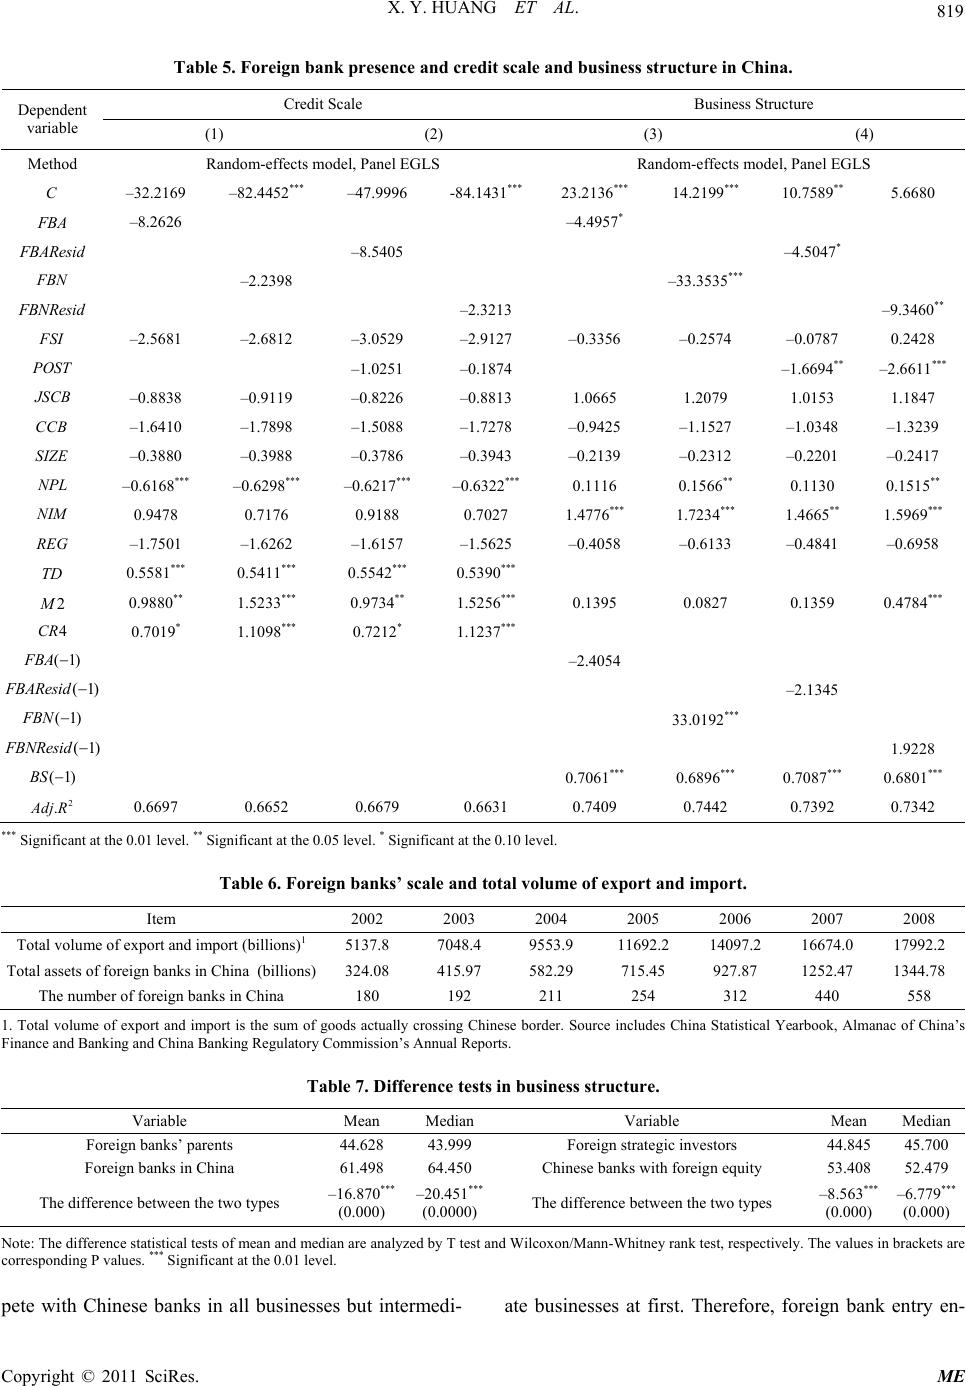 X. Y. HUANG ET AL. 819 Table 5. Foreign bank presence and credit scale and business structure in China. Credit Scale Business Structure Dependent variable (1) (2) (3) (4) Method Random-effects model, Panel EGLS Random-effects model, Pan e l EGLS C –32.2169 –82.4452*** –47.9996 -84.1431*** 23.2136*** 14.2199*** 10.7589** 5.6680 FBA –8.2626 –4.4957* FBAResid –8.5405 –4.5047* BN –2.2398 –33.3535*** FBNResid –2.3213 –9.3460** SI –2.5681 –2.6812 –3.0529 –2.9127 –0.3356 –0.2574 –0.0787 0.2428 POST –1.0251 –0.1874 –1.6694** –2.6611*** SCB –0.8838 –0.9119 –0.8226 –0.8813 1.0665 1.2079 1.0153 1.1847 CCB –1.6410 –1.7898 –1.5088 –1.7278 –0.9425 –1.1527 –1.0348 –1.3239 SIZE –0.3880 –0.3988 –0.3786 –0.3943 –0.2139 –0.2312 –0.2201 –0.2417 NPL –0.6168*** –0.6298*** –0.6217*** –0.6322*** 0.1116 0.1566** 0.1130 0.1515** NIM 0.9478 0.7176 0.9188 0.7027 1.4776*** 1.7234*** 1.4665** 1.5969*** EG –1.7501 –1.6262 –1.6157 –1.5625 –0.4058 –0.6133 –0.4841 –0.6958 TD 0.5581*** 0.5411*** 0.5542*** 0.5390*** 2 0.9880** 1.5233*** 0.9734** 1.5256*** 0.1395 0.0827 0.1359 0.4784*** 4CR 0.7019* 1.1098*** 0.7212* 1.1237*** (1)FBA –2.4054 (1)FBAResid –2.1345 (1)FBN 33.0192*** (1)FBNResid 1.9228 (1)BS 0.7061*** 0.6896*** 0.7087*** 0.6801*** 2 . dj R 0.6697 0.6652 0.6679 0.6631 0.7409 0.7442 0.7392 0.7342 *** Significant at the 0.01 level. ** Significant at the 0.05 level. * Signific ant at the 0.10 level. Table 6. Foreign banks’ sc ale and total volume of e xport and import. Item 2002 2003 2004 2005 2006 2007 2008 Total volume of export and import (billions)1 5137.8 7048.4 9553.9 11692.2 14097.2 16674.0 17992.2 Total assets of foreign banks in Chi na (billions) 324.08 415.97 582.29 715.45 927.87 1252.47 1344.78 The number of foreign banks in China 180 192 211 254 312 440 558 1. Total volume of export and import is the sum of goods actually crossing Chinese border. Source includes China Statistical Yearbook, Almanac of China’s Finance and B anking and China Banking R egulatory Commission’s Annual Reports. Table 7. Difference tests in business structure. Variable Mean Median Variable Mean Median Foreign banks’ parents 44. 628 43.999 Foreign strategic investor s 44.845 45.700 Foreign banks in China 61.498 64.450 Chinese banks with foreign equity 53.408 52.479 The difference between th e two types –16.870*** (0.000) –20.451*** (0.0000) T he difference between the t wo types –8.563*** (0.000) –6.779*** (0.000) Note: The difference statistical tests of mean and median are analyzed by T test and Wilcoxon/Mann-Whitney rank test, respectively. The values i n brackets ar e correspondin g P values. *** Significa nt at the 0.01 level. pete with Chinese banks in all businesses but intermedi-ate businesses at first. Therefore, foreign bank entry en- C opyright © 2011 SciRes. ME  820 X. Y. HUANG ET AL. hances the quantity and diversity of financial product supply. Advanced techniques and management ideas enter into market with new financial service and products, and then Chinese banks can learn and use them to speed up financial product innovation and improve business structure. Reference [20] shows that the ratio of non- interest income to total operating income has been in- creased during 2002-2007. That is to say, the income structure of Chinese commercial banks has greatly changed. And according to the annual reports of 4 state- owned banks in 2009, the ratio of Bank of China (BOC) is the highest among Chinese banks and reaches 31.58%. PwC’s 2010 report also mentions that it is difficult to distinguish the products between foreign banks and Chi- nese banks. Thus, the development speed of intermediate businesses and the adjustment effect of business structure are fast and obvious, respectively. We can see that dummy variable SI is not signifi- cantly correlative with dependen t variables from Table 5. That means foreign strategic investors do not care the credit scale and business structure of their partners. On December 11, 2001, China joined WTO and promised to open banking industry to foreign banks without limita- tion from December 11, 2006. During the 5 transitional years there are many advantages in “equity stake” entry mode. Firstly, foreign strategic investors can avoid the limitation of customers, geographical and operational scope, and utilize the networks of domestic banks to in- terfere in some areas not open to them yet in advance. For example, the Pacific Credit Card Center of BOCOM established according to the cooperation agreement be- tween BOCOM and HSBC, makes HSBC avoid the con- straint on customers and location in RMB, and enter RMB retail market ahead of time. Secondly, foreign banks enter into eastern developed regions at first through greenfield investment. However, other regions are also amazing, so they share domestic banks’ profit through “minority equity stake”. Moreover, foreign stra- tegic investors can gain the informational advantage by cooperating with domestic banks, which is an important factor researched by references such as [21]. To sum up, foreign strategic investors consider the advantages of the “minority equity stake” entry mode rather than the credit scale and business structure of their copartners, so the coefficient of dummy variable SI is not significant naturally. We can also see that dummy variable is not significantly correlative with credit scale from Table 5. The coefficients of for credit scale are not sig- nificant, that means the credit scale of Chinese banks does not change significantly after foreign investment. The reason is that the strategic cooperation agreements, signed by Chinese banks and their foreign strategic in- vestors, do not refer to loan. For instance, the strategic cooperation agreement between CCB and Bank of America (BOA) required BOA to provide strategic sup- ports in risk management, corporate governance, credit card, private bank, global service, information technol- ogy, and so on. Obviously, foreign strategic investors are not helpful in loans. Therefore, it is natural that th e credit scale has no significant change after the cooperation. POST POST From Table 5 we can know that dummy variable is significantly correlative with business struc- ture. Consistent findings are reported by [22]. The right three columns of Ta b le 7 indicate that the business struc- ture of foreign strategic investors is significantly better than that of Chinese banks. It is the foreign strategic in- vestors that affect the innovation ability and even busi- ness structure of domestic banks through their strategic cooperation agreements. According to the cooperation agreements, foreign investors provide managers, experts, resources and technology, etc., to their cooperators. On the one hand, resources and technology can directly push the innovation of domestic banks. On the other hand, managers from foreign investors may shift management ideas and business strategy of domestic banks by par- ticipating in their management and decision. This indi- rectly promotes the innovation ability o f domestic banks. In short, the entry of foreign strategic investors is helpful in improving the business structure of domestic banks. POST Finally, we analyze capital adequacy ratio, money sup- ply and market concentration. If capital adequacy ratio is below 8%, banks will feel pressure and limit the bu siness scope to improve the capital adequacy ratio, so regula- tory pressure is not good for the adjustment of business structure or the gr owth of loan. Reference [23] also indi- cates that capital constraint has negative effect on loan. Money supply and market concentration both have sig- nificantly positive co rrelation with credit scale. That is to say, the factors affecting the credit scale are macro-eco- nomic and bank characteristics rather than foreign bank entry. According to the empirical analysis above, we know the impacts of greenfield banks and foreign strategic investors are consistent. From the way of greenfield, none of foreign or domestic banks have absolute advan- tage. The comparative advantages of greenfield banks make themselves avoid the fierce competition on credit market and develop their advantage on other businesses. From the way of “minority equity stake”, the strategic cooperation between foreign strategic investors and do- mestic banks is helpful to the promotion of business structure of domestic banks. Summarily, Chinese banks are not impacted in traditional credit market but they can get help and learn from foreign banks in other markets. Therefore, foreign bank entry is helpful in the improve- C opyright © 2011 SciRes. ME  X. Y. HUANG ET AL. 821 ment of innovatio n ability an d the adj ustment of bu siness structure of domestic banks. 5. Conclusions This paper investigated the impacts of two different ways of foreign bank entry on credit scale and business struc- ture of Chinese commercial banks, based on the bank- level panel data available for the 2002-2009 period. The empirical results show that the foreign bank entry is not associated with the growth of credit scale, but signifi- cantly improves domestic banks’ business structure. In short, the foreign bank entry is useful to the improve- ment of innovatio n ability an d the adj ustment of bu siness structure of Chinese commercial banks. This conclusion also partially indicates the effect of the reform and opening-u p of C hinese banking system. 6. Acknowledgements This research has been supported by grants from the Na- tional Natural Science Foundation of China (No. 70872- 016). 7. References [1] A. N. Berger, I. Hasan and M. M. Zhou, “Bank Owner- ship and Efficiency in China: What Lies ahead in the World’s Largest Nation,” Bank of Finland Research Dis- cussion Paper, No. 16, 2007. [2] H. J. Song, “Research of China’s Strategy to Cope with Entry of Foreign Banks (Chinese),” Master Thesis, East China Normal University, Shanghai, 2010. [3] Y. Y. Zhu, Y. Zeng, P. Li and J. He, “Introducing the Overseas Strategic Investors into Chinese Banks: Back- grounds, Disputes and Reviews (Chinese),” Management World, Vol. 1, 2008, pp. 21-56. [4] G. R. G. Clarke, R. Cull and M. S. M. Peria, “Does For- eign Bank Penetration Reduce Access to Credit in De- veloping Countries? Evidence form Asking Borrowers,” World Bank Policy Research Working Paper, Vol. 2716, 2001, pp. 22-25. [5] S. Claeys and C. Hainz, “Foreign Banks in Eastern Europe: Mode of Entry and Effects on Bank Interest Rates,” Go v- ernance and the Efficiency of Economic Systems Discus- sion Paper, No. 95, 2006. [6] R. De Haas and I. Naaborg, “Foreign Banks in Transition Countries: To Whom do They Lend and How are They Financed,” Finance Markets, Institutions & Instruments, Vol. 15, No.4, 2006, pp. 159-199. doi:10.1111/j.1468-0416.2006.00116.x [7] G. R. G. Clarke, R. Cull and M. S. M. Peria, “Foreign Bank Participation and Access to Credit across Firms in Developing Countries,” Journal of Comparative Eco- nomics, Vol. 34, No. 4, 2006, pp. 774-795. doi:10.1016/j.jce.2006.08.001 [8] E. Detragiache, T. Tressel and P. Gupta, “Foreign Banks in Poor Countries: Theory and Evidence,” The Journal of Finance, Vol. 63, No. 5, 2008, pp. 2123-2160. doi:10.1111/j.1540-6261.2008.01392.x [9] R. Sengupta, “Foreign Entry and Bank Competition,” Jour- nal of Financial Economics, Vol. 84, No. 2, 2007, pp. 502-528. doi:10.1016/j.jfineco.2006.04.002 [10] C. E. Weller and M. J. Scher, “Multinational Banks and Dev elop ment Finance,” ZEI Working Pape r B99-16, Cen- ter for European Integration Studies, University of Bonn, 1999. [11] S. Claessens, A. Demirguc-Kunt and H. Huizinga, “How does Foreign Entry Affect the Domestic Banking Mar- ket,” Journal of Banking and Finance, Vol. 25, No.5, 2001, pp. 891-911. doi:10.1016/S0378-4266(00)00102-3 [12] R. Lensink and N. Hermes, “The Short-Term Effects of Foreign Bank Entry on Domestic Bank Behaviour: Does Economic Development Matter,” Journal of Banking & Finance, Vol. 24, No. 3, 2004, pp. 553-568. doi:10.1016/S0378-4266(02)00393-X [13] X. F. Li, W. Wang and J. J. Yan, “The Effect of Foreign Entry on the Efficiency of Domestic Banking in China: Empirical Analysis (Chinese),” Finance & Economics, Vol. 8, 2006, pp. 16-23. [14] C. E. Weller, “Financial Liberalization, Multinational Banks and Credit Supply: The Case of Poland,” Interna- tional Review of Applies Economics, Vol. 14, No.2, 2000, pp. 193-211. doi:10.1080/02692170050024741 [15] D. F. Xu and Q. S. Feng, “The Effect of Foreign Bank Entry on Domestic Banking in China: Empirical Analysis (Chinese),” Contemporary Economics, Vol. 1, 2009, pp. 152-153. [16] Y. Y. Zhu, Y. Zeng, P. Li and J. He, “Foreign Strategic Investors’ Participation, Bank Restructuring and Chinese Banks’ Credit Risk (Chinese),” 2009 China International Conference in Finance (CICF2009), Guangzhou, 7-10 July 2009. [17] H. J. Zhang and Z. J. Yang, “Reason Analysis on Loca- tion Distribution of Foreign Banks in China’s Market (Chinese),” Journal of Finance, Vol. 9, 2007, pp. 160- 172. [18] Q. H. Miao and H. P. Wang, “An Empirical Study of Investment Motivation of Foreign Banks in China (Chi- nese),” Shanghai Finance, Vol. 8, 2004, pp. 9-11. [19] H. J. Zhang and Z. L. Zheng, “Study on the Reasons of For eig n Bank Entering Chinese Market—Based on Phase s Panel Data (Chinese),” Finance & Trade Economics, Vol. 4, 2009, pp. 45-51. [20] D. H. Yang, “Development Process of Intermediary Busi- ness of Chinese Commercial Banks from the Perspective of the Profit Structure (Chinese),” Financial Accounting, Vol. 8, 2009, pp. 40-45. [21] B. Zhang, Y. Zeng and Q. Li, “Market Characteristics and the Entry Modes of Foreign Banks,” The 8th Interna- tional Conference on Risk Management & Financial Sys- C opyright © 2011 SciRes. ME  X. Y. HUANG ET AL. Copyright © 2011 SciRes. ME 822 tems Engineering (RMFSE2010), Beijing, 16-17 October 2010. [22] Y. Y. Zhu, P. Li, Y. Zeng and J. He, “Capital, Know- How and Systems: An Empirical Study on Introducing Foreign Strategic Investors into Chinese Banks (Chi- nese),” China Soft Science, Vol. 8, 2010, pp. 70-80. [23] B. Liu, “Empiric al Analysis of the Impact of Capital Ade- quacy Ratio on Bank Loans and Economic (Chinese),” Journal of Finance, Vol. 11, 2005, pp. 18-30.
|