 J. Biomedical Science and Engineering, 2011, 4, 719-733 doi:10.4236/jbise.2011.411089 Published Online November 2011 (http://www.SciRP.org/journal/jbise/ JBiSE ). Published Online November 2011 in SciRes. http://www.scirp.org/journal/JBiSE Structural features of the nucleotide sequences of virus and organelle genomes Masaharu Takeda Department of Materials and Biological Engineering, Tsuruoka National College of Technology, Tsuruoka, Japan. Email: mtakeda@tsuruoka-nct.ac.jp Received 8 July 2011; revised 9 September 2011; accepted 9 October 2011. ABSTRACT The four nucleotides (bases), A, T (U), G and C in small genomes, virus DNA/RNA, organelle and plas- tid genomes were also arranged sophisticatedly in the structural features in a single-strand with 1) reverse- complement symmetry of base or base sequences, 2) bias of four bases, 3) multiple fractality of the distri- bution of each four bases depending on the distance in double logarithmic plot (power spectrum) of L (the distance of a base to the next base) vs. P (L) (the probability of the base-distribution at L), although their genomes were composed of low numbers of the four bases, and the base-symmetry was rather lower than the prokaryotic- and the eukaryotic cells. In t he case of the genomic DNA composed of less than 10,000 nt, it was better than to be partitioned at 10 of the L-value, and the structural features for the bio- logically active genomic DNA were observed as the large genomes. As the results, the base sequences of the genomic DNA including the genomic-RNA might be universal in all genomes. In addition, the rela- tionship between the structural features of the ge- nome and the biological complexity was discussed. Keywords: Structural Features of Small Genome; Virus; Organelle 1. INTRODUCTION Watson and Crick deduced that DNA had a double- helical structure with complementary and anti-paralleled strands [1] based on the equal amounts of adenine (A) and thymine (T), and guanine (G) and cytosine (C) by Chargaff [2], and the X-ray diffraction patterns of DNA fibers by R. Franklin and M. Wilkins [3,4]. After that, Chargaff and co-workers also observed that a sin- gle-strand of Bacillus subtilis DNA had the same amount of A + T and G + C ([5]; Chargaff ’s second parity-rule, 1968). About fifty years later, the genome base sequences of many organisms described below have been determined, and an artificial bacterial genome (582,970 bp) was chemically synthesized based on Mycoplasma genital- ium [6], although partial unreadable regions still re- mained in each genome. The structural analysis of the DNA based on the entire genome base sequence was necessary to understand living organisms. To do this, we had to characterize the structural features of genomic DNA. Genome projects had been completed so far to obtain the base sequences of prokaryotic organisms, and eu- karyotic organisms and so many organisms [7-9]. The base sequences of many viruses, plastids and organelle genomes were also revealed. Their genomes were essen- tially small and were diverse because in a part of viruses, RNA or a single-strand DNA/RNA was used as ge- nomes. As the Genome Project revealed, an individual gene was an integral part of a genome. There were many genes in a genome, and the associated regulatory regions that were expressed, replicated, transcribed and trans- lated into proteins, and all participated in biological phenomena. Each gene could be converted to respective protein according to the maturation of mRNA and “Cen- tral Dogma” [10]. They might be organized based on the support the other regions in chromosome, so called, the non-coding region for the regulation of the gene-ex- pression in living cells as a biological system. If so, we should be to face up to the entire genome as a molecule with three dimensions, not only the coding region, but also the non-coding regions. The genome might be or- ganized in living cells as a biological system, including the coding- and the non-coding regions, which had grown with the passage of time. Therefore, we would have reported the entire genome as a systematized molecule to understand living cells [11]. The study for the entire genomic base sequences were not so much, because we had few effective tools, in- 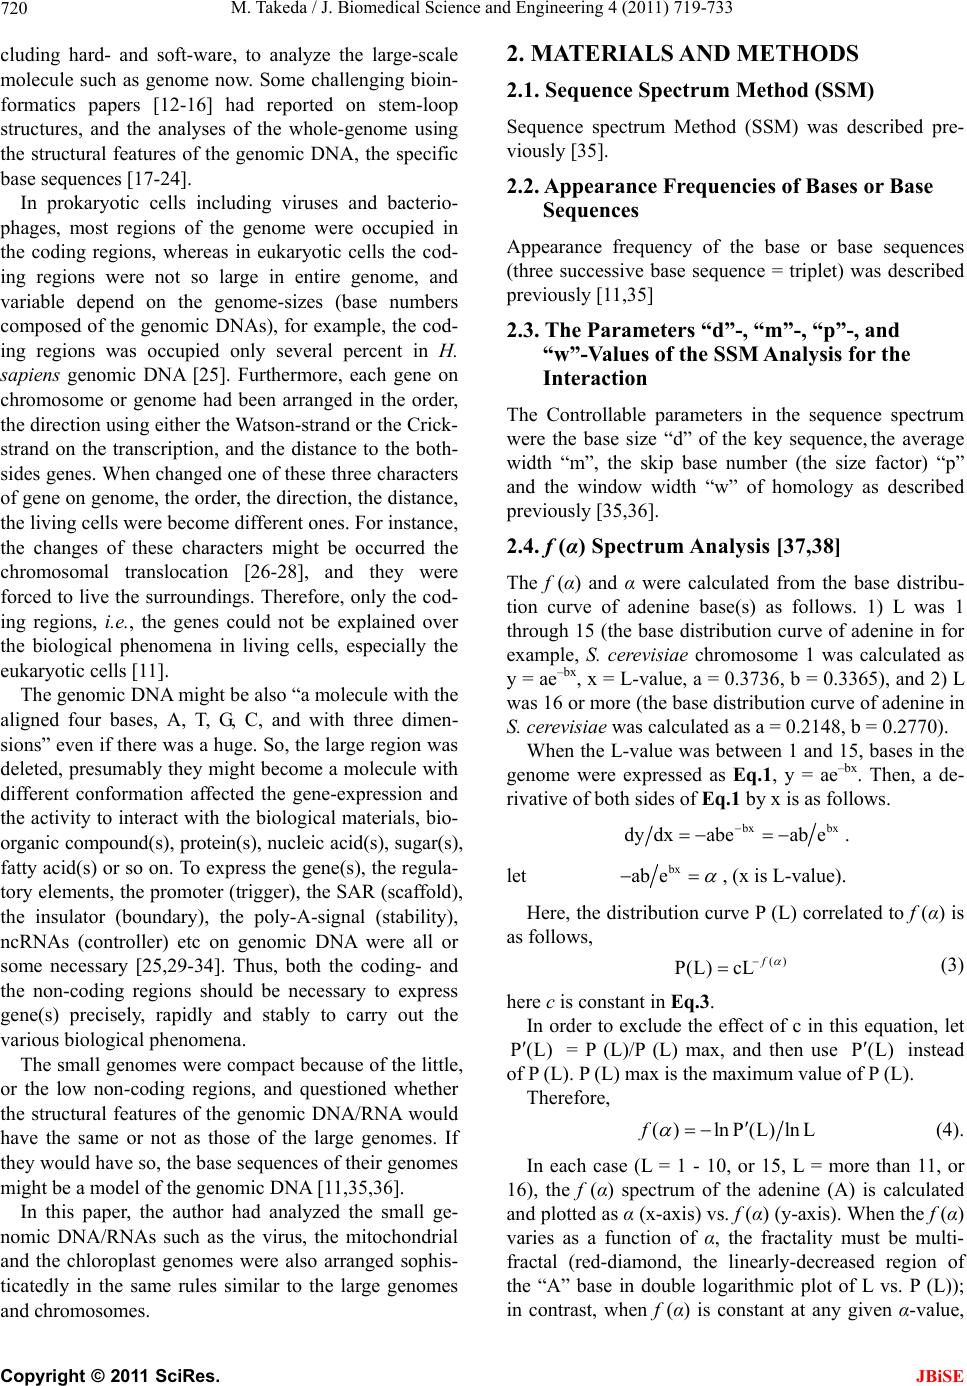 M. Takeda / J. Biomedical Science and Engineering 4 (2011) 719-733 720 cluding hard- and soft-ware, to analyze the large-scale molecule such as genome now. Some challenging bioin- formatics papers [12-16] had reported on stem-loop structures, and the analyses of the whole-genome using the structural features of the genomic DNA, the specific base sequences [1 7-24]. In prokaryotic cells including viruses and bacterio- phages, most regions of the genome were occupied in the coding regions, whereas in eukaryotic cells the cod- ing regions were not so large in entire genome, and variable depend on the genome-sizes (base numbers composed of the genomic DNAs), for example, the cod- ing regions was occupied only several percent in H. sapiens genomic DNA [25]. Furthermore, each gene on chromosome or genome had been arranged in the order, the direction using either th e Watson-strand or the Crick- strand on the transcription, and the distance to the both- sides genes. When changed one of these three characters of gene on genome, the order, the direction, the distance, the living cells were become different ones. For instance, the changes of these characters might be occurred the chromosomal translocation [26-28], and they were forced to live the surroundings. Therefore, only the cod- ing regions, i.e., the genes could not be explained over the biological phenomena in living cells, especially the eukaryotic cells [11]. The genomic DNA might be also “a molecule with the aligned four bases, A, T, G, C, and with three dimen- sions” even if there was a huge. So, the large region was deleted, presumably they migh t become a molecule with different conformation affected the gene-expression and the activity to interact with the biological materials, bio- organic compound(s), protein(s), nucleic acid(s), sugar(s), fatty acid(s) or so on. To express the gene(s), the regula- tory elements, the promoter (trigger), the SAR (scaffold), the insulator (boundary), the poly-A-signal (stability), ncRNAs (controller) etc on genomic DNA were all or some necessary [25,29-34]. Thus, both the coding- and the non-coding regions should be necessary to express gene(s) precisely, rapidly and stably to carry out the various biological phenomena. The small genomes were compact because of the little, or the low non-coding regions, and questioned whether the structural features of the genomic DNA/RNA would have the same or not as those of the large genomes. If they would have so, the base sequences of their genomes might be a model of the genomic DNA [11,35,36]. In this paper, the author had analyzed the small ge- nomic DNA/RNAs such as the virus, the mitochondrial and the chloroplast genomes were also arranged sophis- ticatedly in the same rules similar to the large genomes and chromosomes. 2. MATERIALS AND METHODS 2.1. Sequence Spectrum Method (SSM) Sequence spectrum Method (SSM) was described pre- viously [35]. 2.2. Appearance Frequencies of Bases or Base Sequences Appearance frequency of the base or base sequences (three successive base sequence = triplet) was described previously [11,35] 2.3. The Parameters “d”-, “m”-, “p”-, and “w”-Values of the SSM Analysis for the Interaction The Controllable parameters in the sequence spectrum were the base size “d” of the key sequence, the average width “m”, the skip base number (the size factor) “p” and the window width “w” of homology as described previously [35,36]. 2.4. f (α) Spectrum Analysis [37,38] The f (α) and α were calculated from the base distribu- tion curve of adenine base(s) as follows. 1) L was 1 through 15 (the base distribution curve of adenine in for example, S. cerevisiae chromosome 1 was calculated as y = ae–bx, x = L-value, a = 0.3736, b = 0.3365), and 2) L was 16 or more (the base distribution curve of adenine in S. cerevisiae was calculated as a = 0.2148, b = 0.2770). When the L-value was between 1 and 15, bases in the genome were expressed as Eq.1, y = ae–bx. Then, a de- rivative of both sides of Eq.1 by x is as follows. xb dy dxabeab e x . let bx ab e , (x is L-value). Here, the distribution curve P (L) correlated to f (α) is as follows, () P(L) cL f (3) here c is constant in Eq.3. In order to exclude the effect of c in this equation, let P(L) = P (L)/P (L) max, and then use instead of P (L). P (L) max is the maximum value of P (L). P(L) Therefore, ()ln P(L)ln L f (4). In each case (L = 1 - 10, or 15, L = more than 11, or 16), the f (α) spectrum of the adenine (A) is calculated and plotted as α (x-axis) vs. f (α) (y-axis). When the f (α) varies as a function of α, the fractality must be multi- fractal (red-diamond, the linearly-decreased region of the “A” base in double logarithmic plot of L vs. P (L)); in contrast, when f (α) is constant at any given α-value, C opyright © 2011 SciRes. JBiSE 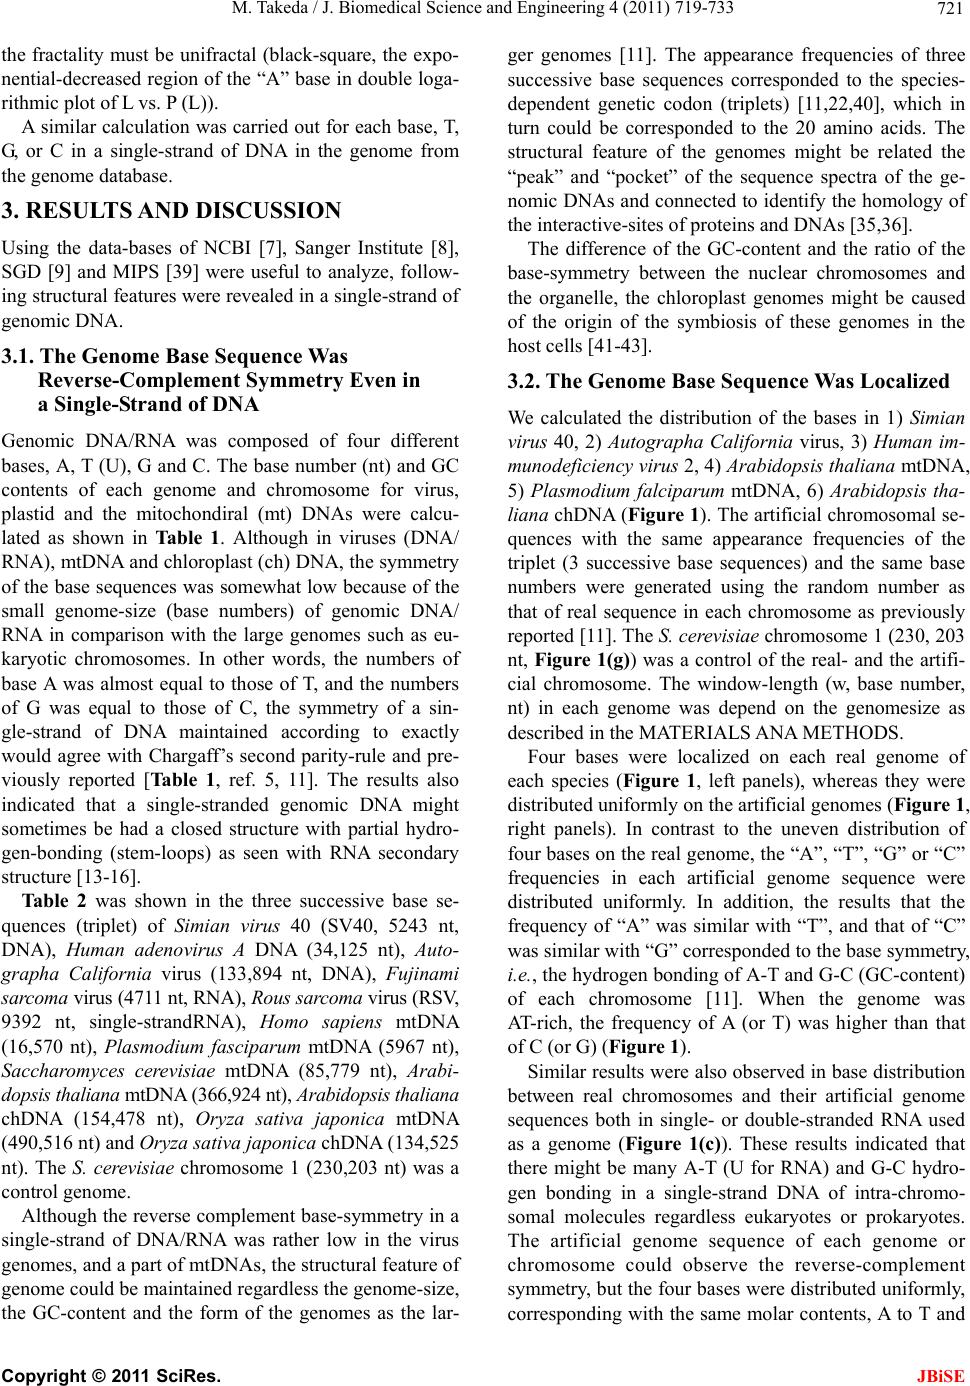 M. Takeda / J. Biomedical Science and Engineering 4 (2011) 719-733 721 the fractality must be unifractal (black-square, the expo- nential-decreased region of the “A” base in double loga- rithmic plot of L vs. P (L)). A similar calculation was carried out for each base, T, G, or C in a single-strand of DNA in the genome from the genome database. 3. RESULT S AND DISCUSSION Using the data-bases of NCBI [7], Sanger Institute [8], SGD [9] and MIPS [39] were useful to analyze, follow- ing structural features were revealed in a single-strand of genomic DNA. 3.1. The Genome Base Sequence Was Reverse-Complement Symmetry Even in a Single-Strand of DNA Genomic DNA/RNA was composed of four different bases, A, T (U), G and C. The base number (nt) and GC contents of each genome and chromosome for virus, plastid and the mitochondiral (mt) DNAs were calcu- lated as shown in Ta ble 1. Although in viruses (DNA/ RNA), mtDNA and chloroplast (ch) DNA, the symmetry of the base sequences was somewhat low because of the small genome-size (base numbers) of genomic DNA/ RNA in comparison with the large genomes such as eu- karyotic chromosomes. In other words, the numbers of base A was almost equal to those of T, and the numbers of G was equal to those of C, the symmetry of a sin- gle-strand of DNA maintained according to exactly would agree with Chargaff ’s second parity-rule and pre- viously reported [Table 1, ref. 5, 11]. The results also indicated that a single-stranded genomic DNA might sometimes be had a closed structure with partial hydro- gen-bonding (stem-loops) as seen with RNA secondary structure [13-16]. Table 2 was shown in the three successive base se- quences (triplet) of Simian virus 40 (SV40, 5243 nt, DNA), Human adenovirus A DNA (34,125 nt), Auto- grapha California virus (133,894 nt, DNA), Fujinami sarcoma virus (4711 nt, RNA), Rous sarcoma virus (RSV, 9392 nt, single-strandRNA), Homo sapiens mtDNA (16,570 nt), Plasmodium fasciparum mtDNA (5967 nt), Saccharomyces cerevisiae mtDNA (85,779 nt), Arabi- dopsis thaliana mt DNA (366,924 nt), Arabidopsis thaliana chDNA (154,478 nt), Oryza sativa japonica mtDNA (490,516 nt) and Oryza sativa japonica chDNA (134,525 nt). The S. cerevisiae chromosome 1 (230,203 nt) was a control genome. Although the reverse complement base-symmetry in a single-strand of DNA/RNA was rather low in the virus genomes, and a part of mtDNAs, the structural feature of genome could be maintained regardless the genome-size, the GC-content and the form of the genomes as the lar- ger genomes [11]. The appearance frequencies of three successive base sequences corresponded to the species- dependent genetic codon (triplets) [11,22,40], which in turn could be corresponded to the 20 amino acids. The structural feature of the genomes might be related the “peak” and “pocket” of the sequence spectra of the ge- nomic DNAs and connected to identify the homology of the interactive-sites of proteins and DNAs [35,36]. The difference of the GC-content and the ratio of the base-symmetry between the nuclear chromosomes and the organelle, the chloroplast genomes might be caused of the origin of the symbiosis of these genomes in the host cells [41-43]. 3.2. The Genome Base Sequence Was Localized We calculated the distribution of the bases in 1) Simian virus 40, 2) Autographa California virus, 3) Human im- munodeficiency virus 2, 4) Arabidopsis thaliana mtDNA, 5) Plasmodium falciparum mtDNA, 6) Arabidopsis tha- liana chDNA (Figure 1). The artificial chromosomal se- quences with the same appearance frequencies of the triplet (3 successive base sequences) and the same base numbers were generated using the random number as that of real sequence in each chromosome as previously reported [11]. The S. cerevisiae chromosome 1 (230, 203 nt, Figure 1(g)) was a control of the real- and the artifi- cial chromosome. The window-length (w, base number, nt) in each genome was depend on the genomesize as described in the MATERIALS ANA METHODS. Four bases were localized on each real genome of each species (Figure 1, left panels), whereas they were distributed un iformly on th e artificial genomes ( Figure 1, right panels). In contrast to the uneven distribution of four bases on the real genome, the “A”, “T”, “G” or “C” frequencies in each artificial genome sequence were distributed uniformly. In addition, the results that the frequency of “A” was similar with “T”, and that of “C” was similar with “G” corresponded to the base symmetry, i.e., the hydrogen bonding of A-T and G-C (GC-content) of each chromosome [11]. When the genome was AT-rich, the frequency of A (or T) was higher than that of C (or G) (Figure 1). Similar results were also observed in base distribution between real chromosomes and their artificial genome sequences both in single- or double-stranded RNA used as a genome (Figure 1(c)). These results indicated that there might be many A-T (U for RNA) and G-C hydro- gen bonding in a single-strand DNA of intra-chromo- somal molecules regardless eukaryotes or prokaryotes. The artificial genome sequence of each genome or chromosome could observe the reverse-complement symmetry, but the four bases were distributed uniformly, corresponding with the same molar contents, A to T and C opyright © 2011 SciRes. JBiSE  M. Takeda / J. Biomedical Science and Engineering 4 (2011) 719-733 Copyright © 2011 SciRes. 722 JBiSE Genome Table 1. Nucleotide (base) contents of small genomes. Form Base number ntA T (U) C G GC (%) A/T (U)C/G (Virus) SV40 DNA circular 5243 1518 1586 1100 1039 40.8 0.96 1.06 H.adenoA DNA linear 34,125 9330 8919 8012 7864 46.5 1.05 1.02 APSE-1 DNA circular 36,524 10,357 10,138 7567 8462 43.9 1.02 0.89 Phage933 DNA linear 61,670 15,964 15,261 14,057 16,388 49.4 1.05 0.86 Acid-two-tail DNA circular 62,730 17,978 18,891 13,166 12,695 41.2 0.95 1.04 S/Pnecro DNA linear 111,362 25,250 25,112 30,919 30,,08154.8 1 1.03 A.calif. DNA circular 133,894 39,195 40,201 27,151 27347 40.7 0.97 0.99 HParvoV B19 DNA (ss) linear 5594 1658 1482 1177 1277 43.8 1.12 0.91 V. phageVf12 DNA (ss) circular 7965 2028 2299 1851 1787 45.6 0.88 1.03 Enterophage If1 DNA (ss) circular 8454 2324 2435 1747 1948 43.7 0.95 0.9 Fujinami RNA linear 4788 1072 856 1302 1558 59.7 1.25 0.84 OSendornaV RNA linear 13,952 5209 4019 3541 3472 33.8 1.29 0.79 Newcastle RNA linear 15,186 4425 3748 3541 3472 46.2 1.18 1.02 VicfabaV RNA linear 17,635 5816 3421 4117 4281 47.6 1.7 0.96 RSV RNA(ss) linear 9392 2230 2080 2378 2704 54.1 1.07 0.88 HIV.ty2 RNA(ss) linear 10,359 3506 2123 2132 2598 45.7 1.65 0.82 Nipah RNA(ss) linear 18,246 6176 5106 3326 3638 38.2 1.21 0.91 (Organelle) P. know. Mt DNA circular 5957 1968 2171 916 902 30.5 0.91 0.98 P. falc. Mt DNA linear 5967 1933 2149 936 949 28.2 0.9 0.99 C. elegans Mt DNA circular 13,794 4335 6179 1225 2055 23.8 0.7 0.6 H.sapiens Mt DNA circular 16,570 5123 4094 5182 2170 44.4 1.25 2.39 S. pombe Mt DNA circular 19,431 6652 7022 2783 3064 30 0.93 0.91 D. melano. Mt DNA circular 19,517 8152 7883 2003 1479 17.8 1.03 1.35 S. cerev. Mt DNA circular 85,779 36,169 34,934 6863 7813 17.1 1.03 0.88 A. thaliana Mt DNA circular 366,924 102,464100,19082,661 81,609 44.7 1.02 1.01 O. sativa Mt DNA linear 490,516 136,863 138,,549 107,346107,75843.8 0.99 1 O. sativa Ch DNA circular 134,525 41,248 40831 26,126 26,320 39 1.01 1 Zea mays Ch DNA circular 140,384 43,281 43,108 26,908 27,087 38.4 1 0.99 A. thaliana Ch DNA circular 154,478 48,546 49,866 28,496 27,570 36.3 0.97 0.97  M. Takeda / J. Biomedical Science and Engineering 4 (2011) 719-733 723 Table 2. Appearance frequency of three successive base sequences. SV40 (5243 nt) Hadeno-A (34,125 nt) A.calif (133,894 nt)Fujinami (4711 nt) RSV (9392 nt) HS mtDNA (16,570 nt)Pfal mtDNA (5967 nt) SC mtDNA (85,779 nt)AT mtDNA (36,6924 nt)AT chDNA (154,478 nt) OSJ mtDNA (490,516 nt) OSJ chDNA (134,525 nt)SC chr.1 (230,203 nt) Triplet Frequency ratio* Frequency ratio* Frequency ratio*Frequency ratio* Frequency ratio*Frequency ratio*Frequency ratio*Frequency ratio*Frequency ratio*Frequency ratio* Freque ncy ratio* Frequency ratio*Frequency ratio* AAA 212 1086 5746 59 141 524 157 4982 10260 7118 14279 5586 8576 TTT 240 0.88 1044 1.04 5762 126 2.27 119 1.18251 2.09282 0.564326 1.15 9605 1.07 7604 0.94 14815 0.96 5408 1.03 8845 0.97 AAT 111 633 4160 23 102 376 206 6950 6745 5449 9920 4180 6306 ATT 128 0.87 648 0.98 4161 142 0.55 128 0.8330 1.14280 0.736620 1.01 6731 15390 1.01 10316 0.96 4158 1.016383 0.99 AAG 106 630 1680 95 180 209 80 1117 9714 3017 12173 2932 4960 CTT 113 0.94 668 0.94 1869 0.948 1.98 139 1.29319 0.66100 0.8874 1.28 9514 1.023190 0.95 12280 0.99 2920 14727 1.05 AAC 103 683 3079 52 122 494 105 689 5705 2324 7342 2058 4105 GTT 98 1.05 556 1.23 3135 0.9836 1.44 119 1.03104 4.75101 1.04806 0.85 5329 1.072449 0.95 7277 1.01 1994 1.03 4195 0.98 ATA 71 438 2654 25 99 367 247 9734 6185 4621 8980 3378 5243 TAT 84 0.85 438 1 2716 0.9826 0.96 114 0.87324 1.13310 0.89427 1.03 5994 1.03 4400 1.05 9050 0.99 3366 15187 1.01 ATG 83 593 2217 60 151 162 157 878 5057 2468 7439 2155 4294 CAT 104 0.8 584 1.02 2201 1.0180 0.75 120 1.26416 0.39127 1.24703 1.25 5254 0.962634 0.94 7580 0.98 2201 0.98 4264 1.01 ATC 67 383 1955 64 102 371 84 752 6312 3032 8257 2564 3849 GAT 50 1.14 407 0.94 1910 1.0262 1.03 144 0.71114 3.25125 0.67904 0.83 6292 13027 1 8442 0.98 2504 1.024012 0.96 AGA 67 485 1507 69 160 178 100 947 8611 3080 10394 2992 4537 TCT 94 0.71 488 0.99 1564 0.9638 1.82 128 1.25307 0.5887 1.15755 1.25 8512 1.013368 0.91 10884 0.95 2954 1.014424 1.03 AGT 87 502 1576 68 115 161 78 836 5963 2098 7910 1843 3697 ACT 104 0.84 555 0.9 1608 0.9837 1.84 115 1412 0.39114 0.68660 1.27 5990 12041 1.03 7813 1.01 1834 13534 1.05 AGG 95 532 674 133 227 174 54 555 6543 1769 8146 1916 2707 CCT 102 0.93 495 1.07 781 0.8688 1.51 179 1.27543 0.3253 1.02483 1.15 6482 1.011934 0.91 8114 1 1882 1.022456 1.1 AGC 96 604 1423 141 170 282 50 265 6368 1459 7766 1452 2684 GCT 101 0.95 563 1.07 1582 0.9121 1.16 183 0.93179 1.5853 0.94233 1.146.0491.05 1453 1 7607 1.02 1429 1.02 2698 0.99 ACA 130 683 3602 72 155 448 119 574 4652 1932 6114 1629 3924 TGT 104 1.25 581 1.18 3336 1.0850 1.44 133 1.17100 4.48128 0.93555 1.03 4355 1.072057 0.94 6201 0.99 1601 1.02 4181 0.94 ACG 5 352 2529 40 105 119 38 193 2878 1056 3959 1015 2186 CGT 5 1 312 1.13 2630 0.9647 0.85 92 1.1478 1.5235 1.09169 1.142840 1.011149 0.92 4044 0.98 1000 1.022105 1.04 ACC 53 523 1163 91 158 516 63 416 4776 1692 6054 1559 2849 GGT 61 0.87 445 1.18 1210 0.9664 1.42 150 1.0580 6.4570 0.9631 0.66 4561 1.051622 1.04 6296 0.96 1557 12955 0.96 TAA 106 647 3169 37 93 414 202 7171 5915 3888 7821 2803 4787 TTA 122 0.87 644 1 3105 1.0231 1.19 125 0.74329 1.26262 0.776765 1.06 5838 1.013638 1.05 7793 1 2812 14693 1.02 TAG 66 361 1196 26 105 258 103 843 6186 2350 8187 2240 2925 CTA 73 0.9 444 0.81 1172 1.0227 0.96 108 0.97523 0.49100 1.03701 1.42 6136 1.012342 1 8187 1 2213 1.012755 1.06 TAC 66 535 1804 36 111 377 139 654 4536 2021 6482 1820 3282 GTA 56 1.18 455 1.18 1955 0.9242 0.86 91 1.22154 2.45134 1.04895 0.734472 1.012058 0.98 6580 0.99 1831 0.993490 0.94 TTG 107 649 3877 62 152 116 103 638 6566 3130 9626 2651 5451 CAA 132 0.81 702 0.92 3659 1.0653 1.17 139 1.09465 0.25104 0.99618 1.03 7031 0.933044 1.03 9355 1.03 2698 0.98 5147 1.06 TTC 110 579 2183 33 108 308 116 898 9169 4261 12454 3609 5161 GAA 82 1.34 597 0.97 2091 1.0480 0.41 172 0.63200 1.5484 1.38967 0.93 9218 0.993858 1.1 12259 1.02 3669 0.985437 0.95 C opyright © 2011 SciRes. JBiSE  M. Takeda / J. Biomedical Science and Engineering 4 (2011) 719-733 Copyright © 2011 SciRes. 724 JBiSE TGA 89 529 2157 82 137 190 82 776 6382 2854 8781 2189 4800 TCA 103 0.86 470 1.13 2129 1.0164 1.28 126 1.09415 46102 0.8714 1.096489 0.982819 1.01 8606 1.02 2176 1.014611 1.04 TGG 93 620 1643 114 232 99 94 444 5099 1949 7269 1975 3691 CCA 98 0.95 662 0.94 1578 1.04114 1 176 1.32464 0.2174 1.27287 3.48 5538 0.922144 0.91 7219 0.99 1997 0.99 3696 1 TGC 104 590 2241 121 166 123 53 196 4383 1314 6345 1322 2945 GCA 94 1.11 609 0.97 2130 1.05122 0.99 149 1.11207 0.5948 1.1188 1.04 4644 0.941264 1.04 6239 1.02 1360 0.972993 0.98 TCG 4 275 2173 47 86 121 36 198 4411 1711 5775 1566 2200 CGA 2 2 309 0.89 2077 1.0547 1 105 0.82122 0.9925 1.44214 0.934479 0.981654 1.03 5899 0.98 1576 0.992158 1.02 TCC 94 469 1145 63 86 361 61 573 6748 2501 8460 2338 2786 GGA 81 1.16 570 0.82 1003 1.14148 0.43 254 0.34122 2.9691 0.67635 0.96614 1.022231 1.12 8356 1.01 2343 12983 0.93 GAG 61 472 1056 136 189 129 46 450 6482 1714 7828 1792 2645 CTC 81 0.75 391 1.21 1123 0.9459 2.31 142 1.33419 0.3150 0.92352 1.28 6463 11876 0.91 7763 1.01 1752 1.022556 1.03 GAC 46 417 1688 68 151 170 43 251 4094 1220 4901 1135 2384 GTC 37 1.24 349 1.19 1750 0.9656 1.21 131 1.15106 1.636 1.19238 1.05 4216 0.971231 0.99 5251 0.93 1109 1.022455 0.97 GTG 66 480 1912 95 149 55 40 251 3676 1188 5343 1067 2798 CAC 77 0.86 478 1 1791 1.0785 1.12 149 1454 0.1247 0.85249 1.01 3961 0.931156 1.03 5215 1.02 1024 1.042722 1.03 GGG 77 419 729 159 285 73 25 741 4934 1532 6573 1745 1592 CCC 41 1.88 480 0.87 685 1.06102 1.56 206 1.38624 0.1217 1.47724 1.02 5007 0.991685 0.91 6416 1.02 1589 1.11620 0.98 GGC 57 486 1569 139 208 151 12 228 4124 966 5354 1009 1905 GCC 59 0.97 514 0.95 1446 1.08120 1.16 194 1.07271 0.5633 0.36252 0.94077 1.011023 0.94 5454 0.98 1002 1.011960 0.97 GCG 12 523 2181 110 135 54 8 142 2827 734 3997 774 1259 CGC 8 1.5 529 0.99 2106 1.0471 1.55 116 1.16155 0.3527 0.3126 1.13 2722 1.04735 1 3832 1.04 782 0.991380 0.91 CAG 112 660 1248 154 198 199 65 193 5077 1325 6028 1239 3091 CTG 134 0.84 598 1.1 1371 0.91150 1.03 216 0.92180 1.1157 1.14204 0.95 4920 1.031388 0.95 6188 0.97 1214 1.02 3074 1.01 CGG 11 350 1465 104 153 80 25 495 3656 1101 4591 1018 1446 CCG 6 1.83 350 1 1395 1.0572 1.44 140 1.09141 0.5730 0.83471 1.05 3581 1.021138 0.97 4635 0.99 1021 11444 1 G to C, as in the genomic DNA molecule [11]. The low symmetry of A/T and G/C such as HIVtype2 (Ta b l e 1 ) or three successive base-sequences such as SV40 (Table 2) were affected on the distribution of the four bases (Figure 1). In addition, the low symmetry of four bases in HIVtype2-genome (Tab l e 1) was affected to the dis- tribution of bases (Figure 1(c)). Other small RNA-ge- nome such as Fujinami sarcoma virus (RNA, 4788 nt) and RSV (ss-RNA, 9392 nt) maintained the base sym- metry and the base distribution (Table 1 and data not shown), therefore, the low symmetry of four bases in HIVtype2-genome might be not only reason that the genome was RNA, but also related to the origin and the evolution of the genome. 3.3. The Genome Bases Had Multiple Fractality Figure 2 showed the distribution curve of adenine bases “A” in small genomes. Most genomes should be parti- tioned the “L” value at 15 to observe the multiple frac- tality, but in the very small genomes composed of 10,000 - 15,000 nt such as SV40 (a), HIV (c), and P. fal- cipu arum mtDNA (e) the linearly decreased region (power law-tail) at long distances could be observed when the L-value of the partition was favorable at 10, i.e., L = 1 - 10, and more than 10 in double logarithmic plot of L vs. P (L). Real chromosomes had the base-symmetry (the re- verse-complement symmetry) as well as the base bias, whereas the artificial genome sequences had only the reverse-complement symmetry, but not the bias of the base-distribution. Based on the above results, how are the four bases, A, T (U), G, and C placed on a single- strand of DNA in a genome? In order to understand this issue we investigated the fractality characteristics of the real genomes and the artificial genomes based on the distribution of the b ase-distance (L). Each base-distribu- tion curve P (L) expresses the distribution of the distance L between a base and the nextor the base “A”, the base, f 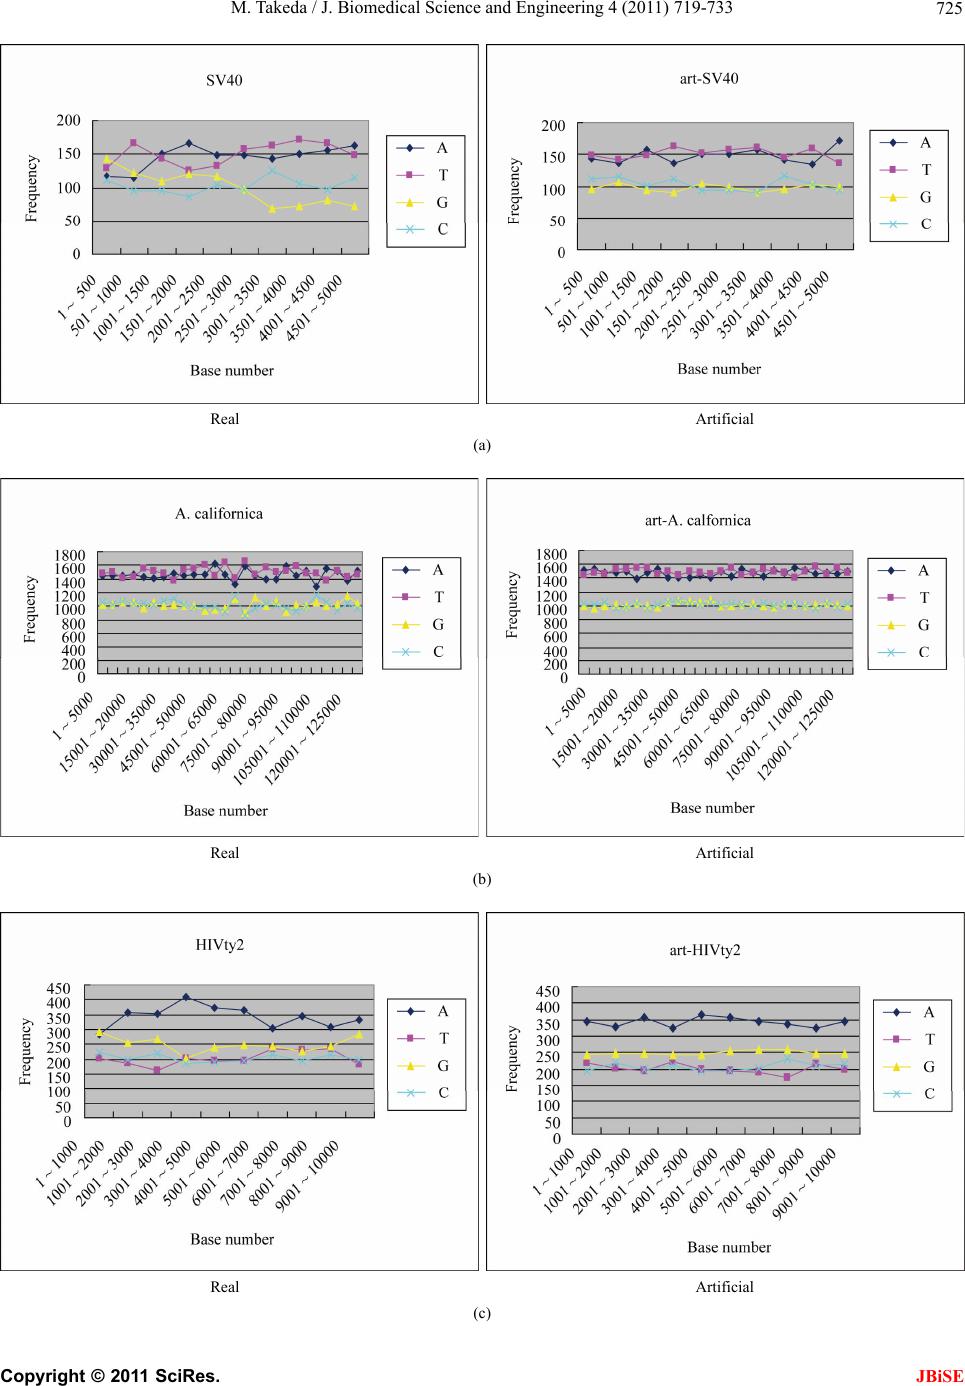 M. Takeda / J. Biomedical Science and Engineering 4 (2011) 719-733 725 Real Artificial (a) Real Artificial (b) Real Artificial (c) C opyright © 2011 SciRes. JBiSE 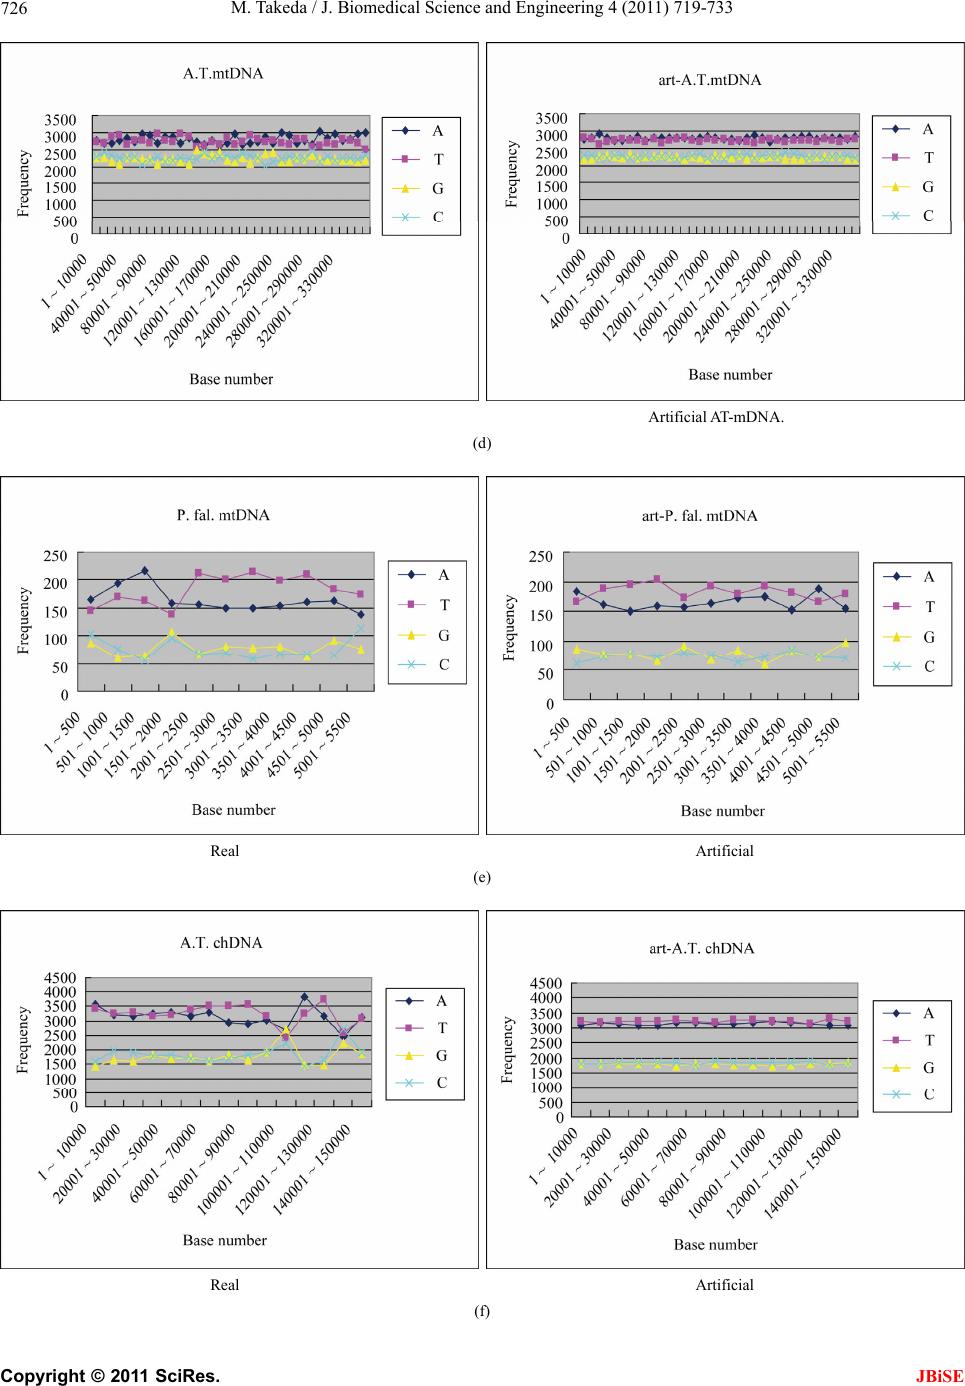 M. Takeda / J. Biomedical Science and Engineering 4 (2011) 719-733 726 Artificial AT-mDNA. (d) Real Artificial (e) Real Artificial (f) C opyright © 2011 SciRes. JBiSE 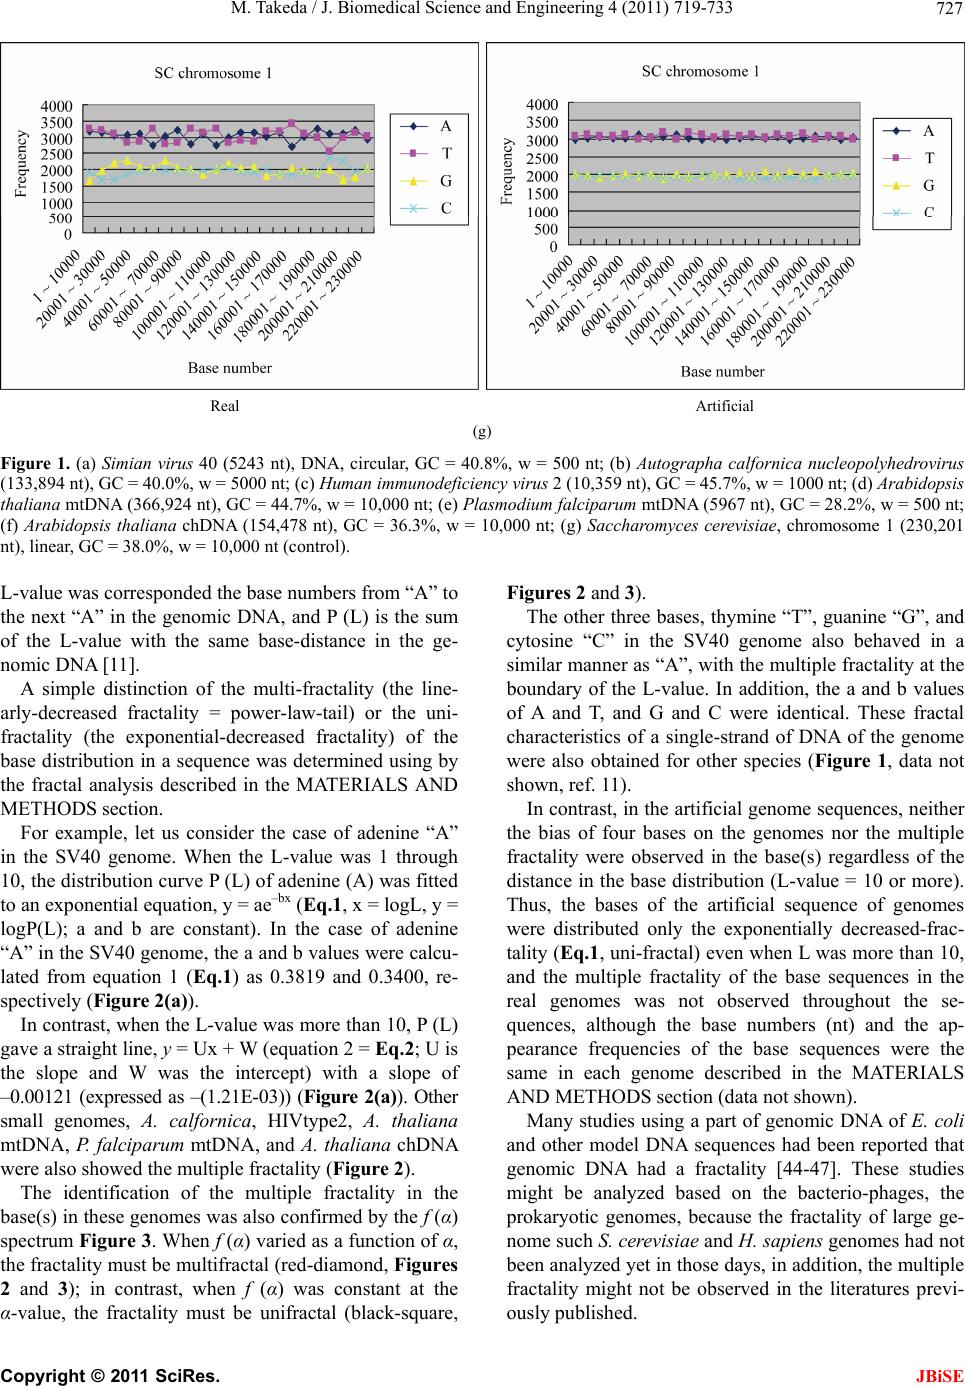 M. Takeda / J. Biomedical Science and Engineering 4 (2011) 719-733 Copyright © 2011 SciRes. 727 Real Artificial (g) Figure 1. (a) Simian virus 40 (5243 nt), DNA, circular, GC = 40.8%, w = 500 nt; (b) Autographa calfornica nucleopolyhedrovirus (133,894 nt), GC = 40.0%, w = 5000 nt; (c) Human immunodeficiency virus 2 (10,359 nt), GC = 45.7%, w = 1000 nt; (d) Arabidopsis thaliana mtDNA (366,924 nt), GC = 44.7%, w = 10,000 nt; (e) Plasmodium falciparum mtDNA (5967 nt), GC = 28.2%, w = 500 nt; (f) Arabidopsis thaliana chDNA (154,478 nt), GC = 36.3%, w = 10,000 nt; (g) Saccharomyces cerevisiae, chromosome 1 (230,201 nt), linear, GC = 38.0%, w = 10,000 nt (control). L-value was corresponded the base numbers from “A” to the next “A” in the genomic DNA, and P (L) is the sum of the L-value with the same base-distance in the ge- nomic DNA [11]. JBiSE A simple distinction of the multi-fractality (the line- arly-decreased fractality = power-law-tail) or the uni- fractality (the exponential-decreased fractality) of the base distribution in a sequence was determined using by the fractal analysis described in the MATERIALS AND METHODS section. For example, let us consider the case of adenine “A” in the SV40 genome. When the L-value was 1 through 10, the distribution curve P (L) of adenine (A) was fitted to an exponential equation, y = ae–bx (Eq.1, x = logL, y = logP(L); a and b are constant). In the case of adenine “A” in the SV40 genome, the a and b values were calcu- lated from equation 1 (Eq.1) as 0.3819 and 0.3400, re- spectively (Figure 2(a)). In contrast, when the L-value was more than 10, P (L) gave a straight line, y = Ux + W (equation 2 = Eq.2; U is the slope and W was the intercept) with a slope of –0.00121 (expressed as –(1.21E-03)) (Figure 2(a)). Other small genomes, A. calfornica, HIVtype2, A. thaliana mtDNA, P. falciparum mtDNA, and A. thaliana chDNA were also showed the multiple fractality (Figure 2). The identification of the multiple fractality in the base(s) in these genomes was also confirmed by the f (α) spectrum Figure 3. W hen f (α) varied as a function of α, the fractality must be multifractal (red-diamond, Figures 2 and 3); in contrast, when f (α) was constant at the α-value, the fractality must be unifractal (black-square, Figures 2 and 3). The other three bases, thymine “T”, guanine “G”, and cytosine “C” in the SV40 genome also behaved in a similar manner as “A”, with the multiple fractality at the boundary of the L-value. In addition, the a and b values of A and T, and G and C were identical. These fractal characteristics of a single-strand of DNA of the genome were also obtained for other species (Figure 1, data not shown, ref. 11). In contrast, in the artificial genome sequences, neither the bias of four bases on the genomes nor the multiple fractality were observed in the base(s) regardless of the distance in the base distribution (L-value = 10 or more). Thus, the bases of the artificial sequence of genomes were distributed only the exponentially decreased-frac- tality (Eq.1, uni-fractal) even when L was more than 10, and the multiple fractality of the base sequences in the real genomes was not observed throughout the se- quences, although the base numbers (nt) and the ap- pearance frequencies of the base sequences were the same in each genome described in the MATERIALS AND METHODS section (data n ot shown). Many studies using a part of genomic DNA of E. coli and other model DNA sequences had been reported that genomic DNA had a fractality [44-47]. These studies might be analyzed based on the bacterio-phages, the prokaryotic genomes, because the fractality of large ge- nome such S. cerevisiae and H. sapiens genomes had not been analyzed yet in thos e days, in addition, the multiple fractality might not be observed in the literatures previ- uly published. o s  M. Takeda / J. Biomedical Science and Engineering 4 (2011) 719-733 728 L = 1 - 10, y = 0.3819 e–0.34x L = 11 - 23, y = –(1.21E-03) x + W (a) L = 1 - 15, y = 0.3134 e–0.3007x L = 16 - 31, y = –(1.75E-04) x + W (b) L = 1 - 10, y = 0.5412 e–0.4367x L = 11 - 18, y = –(6.77E-04) x + W (c) L = 1 - 15, y = 0.3421 e–0.3125x L = 16 - 36, y = –(1.35E-04) x + W (d) C opyright © 2011 SciRes. JBiSE 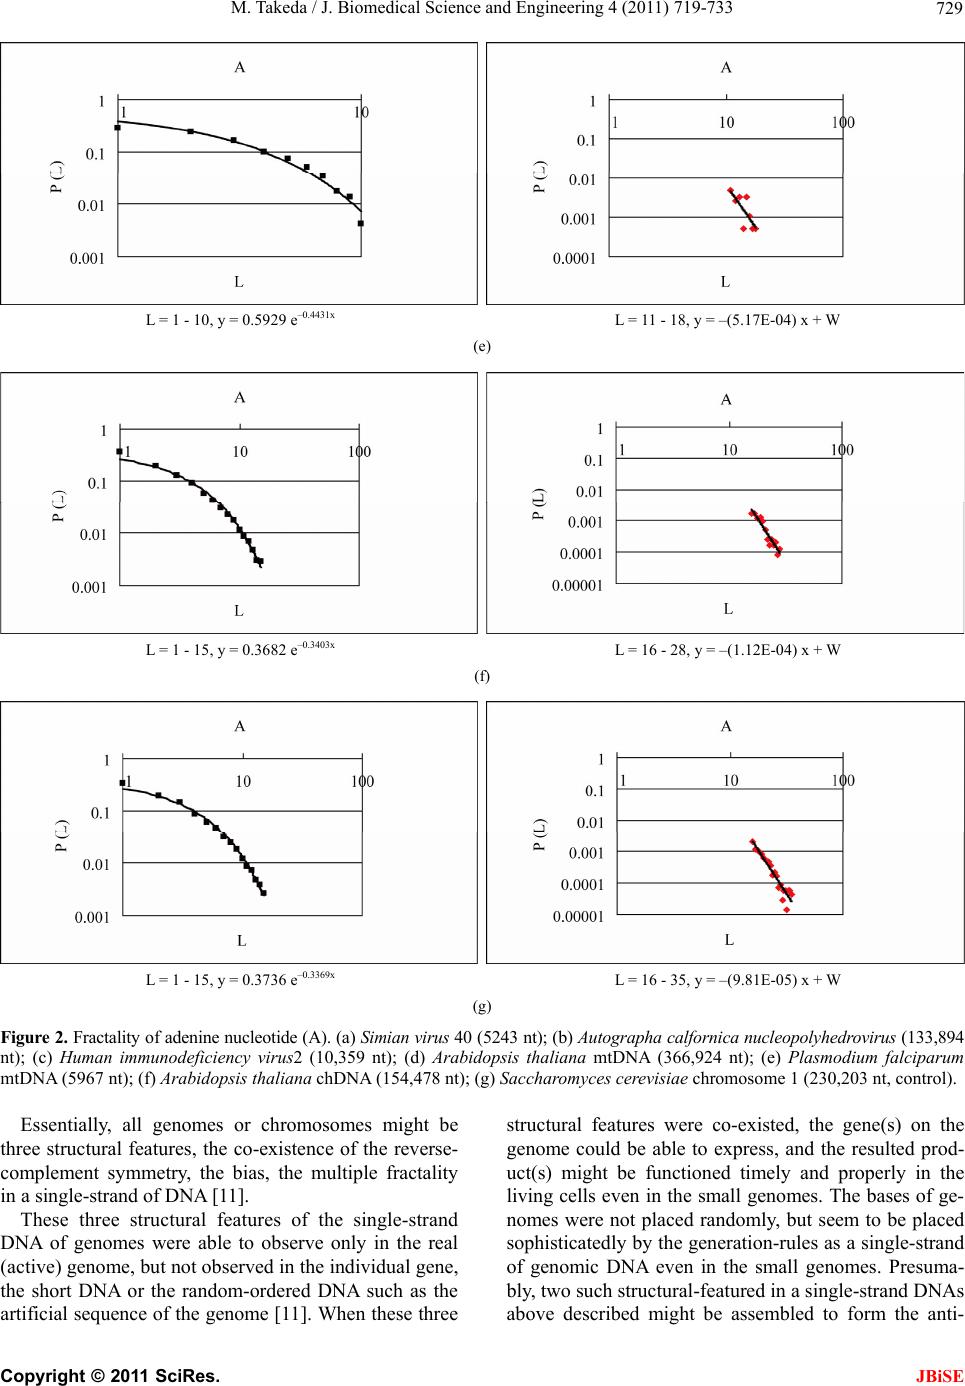 M. Takeda / J. Biomedical Science and Engineering 4 (2011) 719-733 729 L = 1 - 10, y = 0.5929 e–0.4431x L = 11 - 18, y = –(5.17E-04) x + W (e) L = 1 - 15, y = 0.3682 e–0.3403x L = 16 - 28, y = –(1.12E-04) x + W (f) L = 1 - 15, y = 0.3736 e–0.3369x L = 16 - 35, y = –(9.81E-05) x + W (g) Figure 2. Fractality of adenine nucleotide (A). (a) Simian virus 40 (5243 nt); (b) Autographa calfornica nucleopolyhedrovirus (133,894 nt); (c) Human immunodeficiency virus2 (10,359 nt); (d) Arabidopsis thaliana mtDNA (366,924 nt); (e) Plasmodium falciparum mtDNA (5967 nt); (f) Arabidopsis thaliana chDNA (154,478 nt); (g) Saccharomyces cerevisiae chromosome 1 (230,203 nt, control). Essentially, all genomes or chromosomes might be three structural features, the co-existence of the reverse- complement symmetry, the bias, the multiple fractality in a single-strand of DNA [11]. These three structural features of the single-strand DNA of genomes were able to observe only in the real (active) genome, but not observed in the individual gene, the short DNA or the random-ordered DNA such as the artificial sequence of the genome [11]. When these three structural features were co-existed, the gene(s) on the genome could be able to express, and the resulted prod- uct(s) might be functioned timely and properly in the living cells even in the small genomes. The bases of ge- nomes were not placed randomly, but seem to be placed sophisticatedly by the generatio n-rules as a single-strand of genomic DNA even in the small genomes. Presuma- bly, two such structural-featured in a single-strand DNAs above described might be assembled to form the anti- C opyright © 2011 SciRes. JBiSE 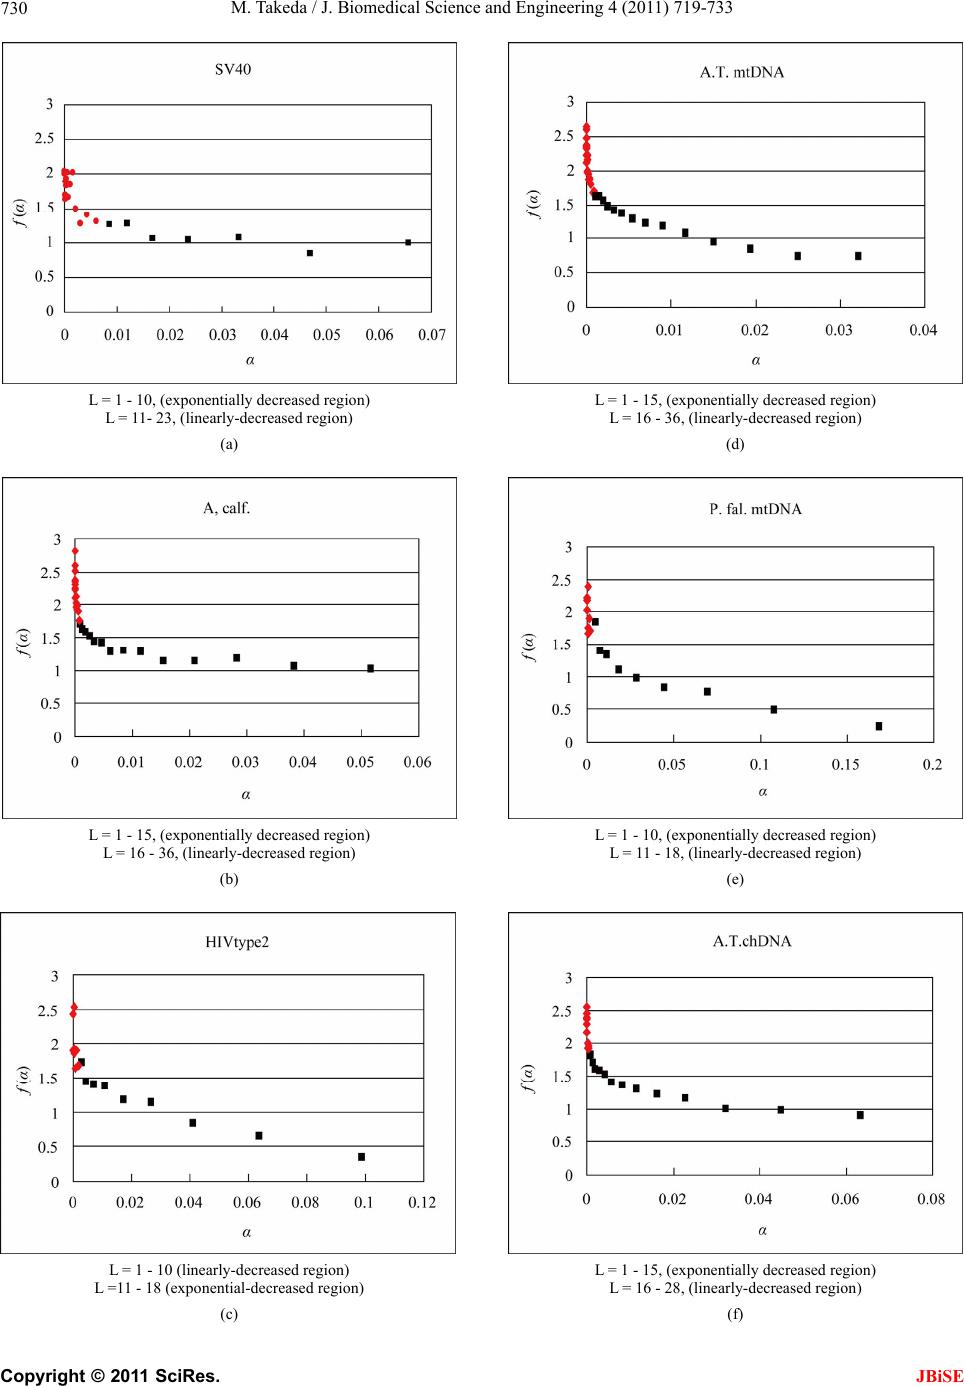 M. Takeda / J. Biomedical Science and Engineering 4 (2011) 719-733 730 L = 1 - 10, (expo nentially decr eased region) L = 11- 23, (linearly-decreased region) (a) L = 1 - 15, (expo nentially decr eased region) L = 16 - 36, (li n e a rl y-decreased region) (b) L = 1 - 10 (li nearly-decreased region) L =11 - 18 (exponential-decreased region) (c) L = 1 - 15, (expo nentially decr eased region) L = 16 - 36, (li n e a rl y-decreased region) (d) L = 1 - 10, (expo nentially decr eased region) L = 11 - 18, (linearly-decrea s e d r e g i o n ) (e) L = 1 - 15, (expo nentially decr eased region) L = 16 - 28, (li n e a rl y-decreased region) (f) C opyright © 2011 SciRes. JBiSE 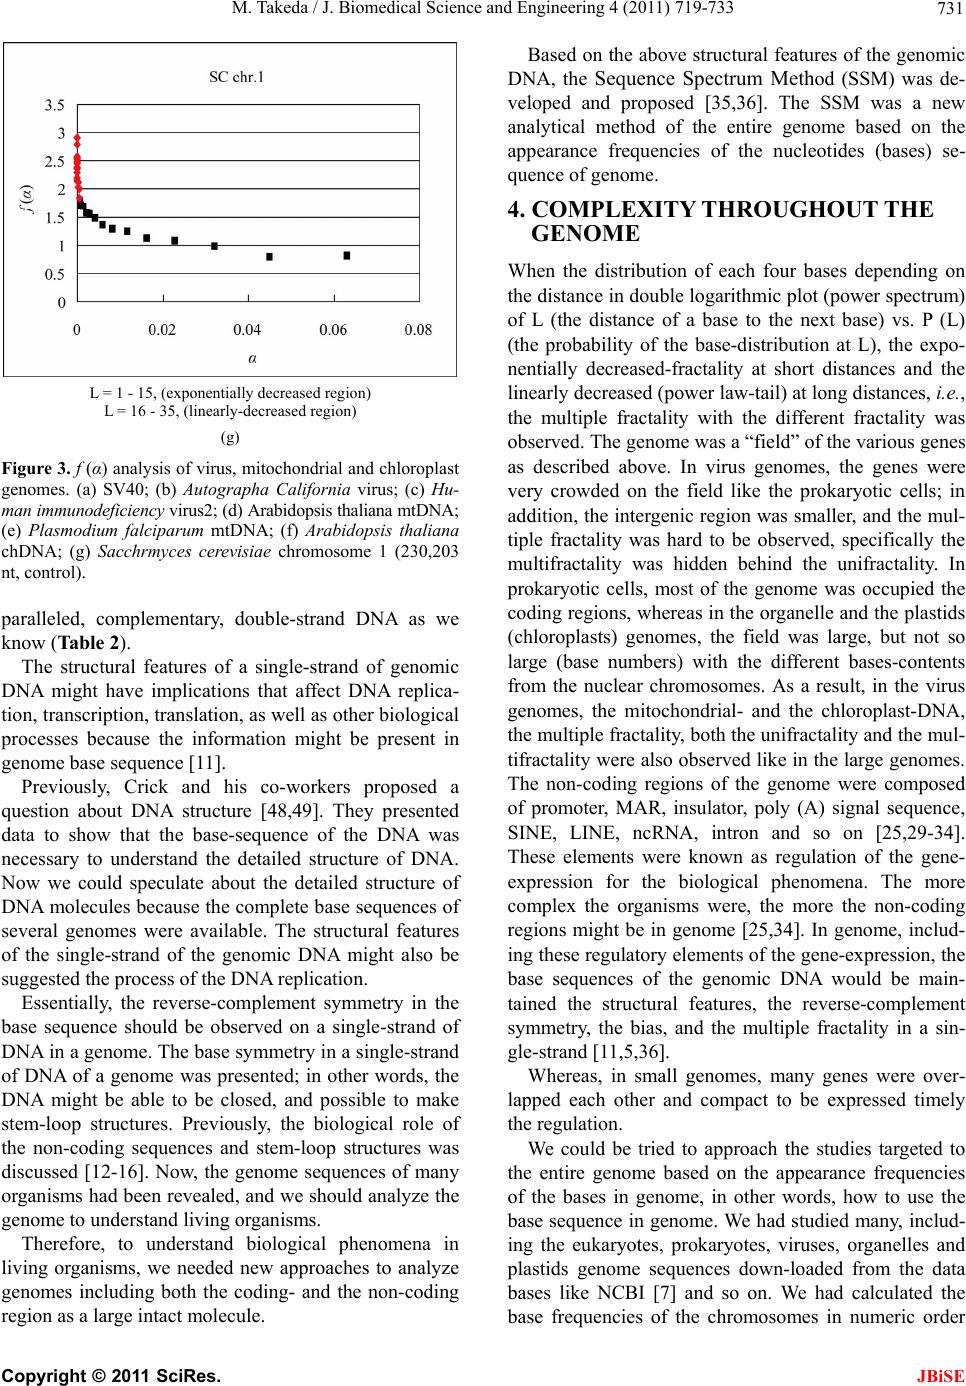 M. Takeda / J. Biomedical Science and Engineering 4 (2011) 719-733 731 L = 1 - 15, (expo nentially decr eased region) L = 16 - 35, (li n e a rl y-decreased region) (g) Figure 3. f (α) analysis of virus, mitochondrial and chloroplast genomes. (a) SV40; (b) Autographa California virus; (c) Hu- man immunodeficiency virus2; (d) Arabi dopsis tha liana mtDNA; (e) Plasmodium falciparum mtDNA; (f) Arabidopsis thaliana chDNA; (g) Sacchrmyces cerevisiae chromosome 1 (230,203 nt, control). paralleled, complementary, double-strand DNA as we know (Table 2). The structural features of a single-strand of genomic DNA might have implications that affect DNA replica- tion, transcription, translation , as well as other biological processes because the information might be present in genome base sequence [11]. Previously, Crick and his co-workers proposed a question about DNA structure [48,49]. They presented data to show that the base-sequence of the DNA was necessary to understand the detailed structure of DNA. Now we could speculate about the detailed structure of DNA molecules because the complete base sequences of several genomes were available. The structural features of the single-strand of the genomic DNA might also be suggested the process of the DNA replication. Essentially, the reverse-complement symmetry in the base sequence should be observed on a single-strand of DNA in a genome. The base symmetry in a single-strand of DNA of a genome was presented; in other words, the DNA might be able to be closed, and possible to make stem-loop structures. Previously, the biological role of the non-coding sequences and stem-loop structures was discussed [12-16]. Now, the genome sequences of many organisms had been revealed, and we should analyze the genome to understand living organisms. Therefore, to understand biological phenomena in living organisms, we needed new approaches to analyze genomes including both the coding- and the non-coding region as a large intact molecule. Based on the above structural features of the genomic DNA, the Sequence Spectrum Method (SSM) was de- veloped and proposed [35,36]. The SSM was a new analytical method of the entire genome based on the appearance frequencies of the nucleotides (bases) se- quence o f g enome. 4. COMPLEXITY THROUGHOUT THE GENOME When the distribution of each four bases depending on the distance in double logarithmic plot (power spectrum) of L (the distance of a base to the next base) vs. P (L) (the probability of the base-distribution at L), the expo- nentially decreased-fractality at short distances and the linearly decreased (power law-tail) at long distances, i.e., the multiple fractality with the different fractality was observed. The genome was a “field” of the various genes as described above. In virus genomes, the genes were very crowded on the field like the prokaryotic cells; in addition, the intergenic region was smaller, and the mul- tiple fractality was hard to be observed, specifically the multifractality was hidden behind the unifractality. In prokaryotic cells, most of the genome was occupied the coding regions, whereas in the organelle and the plastids (chloroplasts) genomes, the field was large, but not so large (base numbers) with the different bases-contents from the nuclear chromosomes. As a result, in the virus genomes, the mitochondrial- and the chloroplast-DNA, the multiple fractality, bo th the unifractality and the mul- tifractality were also observed like in th e large genomes. The non-coding regions of the genome were composed of promoter, MAR, insulator, poly (A) signal sequence, SINE, LINE, ncRNA, intron and so on [25,29-34]. These elements were known as regulation of the gene- expression for the biological phenomena. The more complex the organisms were, the more the non-coding regions might be in genome [25,34]. In genome, includ- ing these regulatory elements of the gene-expression, the base sequences of the genomic DNA would be main- tained the structural features, the reverse-complement symmetry, the bias, and the multiple fractality in a sin- gle-strand [11,5,36]. Whereas, in small genomes, many genes were over- lapped each other and compact to be expressed timely the regulation. We could be tried to approach the studies targeted to the entire genome based on the appearance frequencies of the bases in genome, in other words, how to use the base sequence in genome. We had studied many, includ- ing the eukaryotes, prokaryotes, viruses, organelles and plastids genome sequences down-loaded from the data bases like NCBI [7] and so on. We had calculated the base frequencies of the chromosomes in numeric order C opyright © 2011 SciRes. JBiSE  M. Takeda / J. Biomedical Science and Engineering 4 (2011) 719-733 732 when there were several chromosomes in one organism. In addition, the reason for using chromosome in H. sapiens, the personal computer can not be calculated the sum of chromosomes 1 - 22, X and Y because of the limited capacity. The genome data are draft as described above, but most of the unreadable area was very small part com- pared with the huge entire chromosome. So, when there was unreadable region in chromosome, we could skip the region to calculate the base frequencies of the chro- mosome or genome because the unreadable region of each chromosome was small number of bases to neglect in comparison to large number of genomic DNA. The complexity of the organisms might be dependent on the capacity of the non-coding region in the entire genome. 5. CONCLUSIONS The structural features, 1) the reverse-complement sym- metry of the base or three successive base sequences, 2) the bias of the four bases-distribution, 3) the multiple fractality of the four bases-distribution were the univer- sal in a single-strand of genomic DNA or RNA genomes in a part of virus even in the small genomes such as virus, the plastids and the organelle genomes. These three characters were co-existed in the single-strand of DNA in all genomes. The molar ratio of the plastids and the organelle genomes were different from the nuclear chromosomes of the host cells because most of the plas- tids and the organelle genomes might be evolved under the process of the symbiosis in other organisms. 6. ACKNOWLEDGEMENTS The author wishes to thank to Dr. Masatoshi Nakahara for his critical reading and advice of this manuscript, and to Mr. Yasuharu Mayama for his technical assistance. REFERENCES [1] Watson, J.D. and Crick, F.H.C. (1953) Genetical implica- tions of the structure of deoxyribonucleic acid. Nature (London), 171, 964-967. doi:10.1038/171964b0 [2] Chargaff, E. (1953) Chemical specificity of nucleic acids and mechanism of their enzymatic degradation. Experi- mentia, 6, 201-240. doi:10.1007/BF02173653 [3] Franklin, R.E. and Gosling, R.G. (1953) Molecular con- figuration in sodium thymonucleate. Nature, 171, 740- 741. doi:10.1038/171740a0 [4] Feughelman, M., Langridge, R., Wilkins, M.H.F., Barclay, R.K. and Hamilton, L.D. (1955) Molecular structure of Deoxyribose nucleic acid and nucleoprotein. Nature, 175, 834-838. doi:10.1038/175834a0 [5] Karkas, J.D., Rudner, R. and Chargaff, E. (1968) Separa- tion of B. subtilis DNA into complementary strands. II. Template functions and composition as determined by transcription by RNA polymerase. Proceeding National Academy of Sciences of the United States of America, 60, 915-920. doi:10.1073/pnas.60.3.915 [6] Gibson, D.G., Benders, G.A., Andrews-Pfannkoch, C., Denisova, E.A., Baden-Tillson, H., Zaveri, J., Stockwell, T.B., Brownley. A., Thomas, D.W., Algire, M.A., Mer- ryman, C., Young, L., Noskov, V.N., Glass, J.I., Venter, J.C., Hutchison, C.A.3rd and Smith, H.O. (2008) Com- plete chemical synthesis, assembly, and cloning of a Mycoplasma genitalium. Science, 319, 1215-1220. doi:10.1126/science.1151721 [7] NCBI genome data base. (2011). http://www.ncbi.nlm.nih.gov/sites/entrez?db=genome [8] The Sanger Institute. (2011). http://www.sanger. ac.uk [9] Saccharomyces Genome Database, (2011). http://www.yeastgenome.org/ [10] Crick, F.H.C. (1968) The origin of genetic code. Journal of Molecular Biology, 38, 367-379. doi:10.1016/0022-2836(68)90392-6 [11] Takeda, M. and Nakahara, M. (2009) Structural Features of the nucleotide Sequences of Genomes. Journal of Computer Aided Chemistry, 10, 38-52. doi:10.2751/jcac.10.38 [12] Bernardi, G. and Bernardi, G. (1986) Compositional con- straints and genome evolution. Journal of Molecular Evolution, 24, 1-11. doi:10.1007/BF02099946 [13] Le, S.-Y. and Maizei, J.V. (1986) A method for assessing the statistical significances of RNA folding. Journal of Theoretical Biology, 138, 495-510. doi:10.1016/S0022-5193(89)80047-5 [14] Prabhu, V.V. (1993) Symmetry observations in long nu- cleotide sequence. Nucleic Acids Research, 21, 2797- 2800. doi:10.1093/nar/21.12.2797 [15] Forsdyke, D.R. (1995a) A st em-loop “kissing” model for the initiation of recombination and the origin of intron. Molecular Biology of Evolution, 12, 949-958. [16] Forsdyke, D.R. (1995b) Reciprocal relationship between stem-loop potential and substitution density in retroviral quasispecies under positive Darwinian selection. Journal of Molecular Evolution, 41, 1022-1037. doi:10.1007/BF00173184 [17] Searls, D.B. and Murphy, K. (1995) Automatic-theoretic model of mutation and alignment. Proceedings of the 3rd International Conference on Intelligent Systems Molecu- lar Biology, 3, 341-349. [18] Stern, L., Allison, L., Coppel, R.L. and Dix, T.I. (2001) Discovering patterns in Plasmodium falciparum genomic DNA. Molecular and Biochemical Parasitology, 112, 71-77. [19] Kanaya, S., Kinouchi, M., Abe, T., Kudo, Y., Yamada, Y., Nishi, T., Mori, H. and Ikemura, T. (2001) Analysis of codon usage diversity of bacterial genes with a self- or- ganizing map (SOM): Characterization of horizontally transferred genes with emphasis on the E. coli O157 ge- nome. Gene, 276, 89-99. doi:10.1016/S0378-1119(01)006 73-4 [20] Baisnee, P.-F., Hampson, S. and Baldi, P. (2002) Why are complement ary DNA strands symmetric? Bioinformatics, 18, 1021-1033. doi:10.1093/bioinformatics/18.8.1021 [21] Chen, L. and Zhao, H. (2005) Negative correlation be- tween compositional symmetries and local recombination rates. Bioinformatics, 21, 3951-3958. doi:10.1093/bioinformatics/bti651 [22] Albrecht-Buehler, G. (2006). Asymptotically increasing C opyright © 2011 SciRes. JBiSE  M. Takeda / J. Biomedical Science and Engineering 4 (2011) 719-733 Copyright © 2011 SciRes. 733 JBiSE compliance of genomes with Chargaff’s second parity rules through inversions and inverted transpositions. Proceeding National Academy of Sciences of the United States of America, 103, 17828-17833. doi:10.1073/pnas.0605553103 [23] Knoch, T.A., Göker, M., Lohner, R., Abuseiris, A. and Grosveld, F.G. (2009) Fine-structures multi-scaling long- range correlations in completely sequenced genomes- features, origin, and classification. European Biophysical Journal, 38, 757-779. doi:10.1007/s00249-009-0489-y [24] Chor, B., Horn, D., Goldman, N., Levy, Y. and Mass- ingham, T. (2009) Genomic DNA k-mer spectra: Models and modalities. Genome Biology, 10, R108. [25] Mattick, J.S. (2004) RNA regulation: A new genetics? Nature Review Genetics, 5, 316-323. doi:10.1038/nrg1321 [26] Haber, J.E. and Leung, W.Y. (1996) Lack of chromosome territoriality in yeast: Promiscuous rejoining of broken chromosome ends. Proceeding National Academy of Sci- ences of the United States of America, 93, 13949-13954. doi:10.1073/pnas.93.24.13949 [27] Rowley, J.D. (2001) Chromosomal translocations; dan- gerous liaisons revisited. Nature Review Cancer, 1, 245- 250. doi:10.1038/35106108 [28] Meaburn, K.J., Misteli, T. and Soutoglou, E. (2007) Spa- tial genome organization in the formation of chromoso- mal translocations. Seminars in Cancer Biology, 17, 80- 90. doi:10.1016/j.semcancer.2006.10.008 [29] Webb, C.F., Das, C., Eneff, K. and Tucker, P.W. (1991) Identification of a matrix-associated region 5’ of an im- munoglobulin heavy chain variable region gene. Mo- lecular and. Cellular Biology, 11 , 5206-5211. [30] West, A.G., Gaszner, M. and Felsenfeld, G. (2002) Insu- lators: many functions, many mechanisms. Genes and Development, 16, 271-288. doi:10.1101/gad.954702 [31] Levine, M. and Tjian, R. (2003) Transcription regulation and animal diversity. Nature, 424, 147-151. doi:10.1038/nature01763 [32] Lai, E.C., Roegiers, F., Qin, X., Jan, Y.N. and Rubin, G.M. (2005) The ubiquitin ligase Drosophila Mind bomb promotes Notch signaling by regulating the localization and activity of Serrate and Delta. Development, 132, 2319-2332. doi:10.1242/dev.01825 [33] Martens, J.A., Wu, P.Y. and Winston, F. (2005) Regula- tion of an intergenic transcript controls adjacent gene transcription in Saccharomyces cerevisiae. Genes and Develoment, 19, 2695-2704. doi:10.1101/gad.1367605 [34] Taft, R.J., Pheasant, M. and Mattick, J.S. (2007) The relationship between non-protein-coding DNA and eu- karyot ic complexity. Bioessays. 29, 288-299. doi:10.1002/bies.20544 [35] Nakahara, M. and Takeda, M. (2010a). Characterization of the sequence spectrum of DNA based on the appear- ance frequency of the nucleotide sequences of the ge- nome—A new method for analysis of genome structure. Journal of Biomedical Science and Engineering, 3, 340-350. doi:10.4236/jbise.2010.34047 [36] Nakahara, M. and Takeda, M. (2010b). Identification of the interactive region by the homology of the sequence spectrum. Journal of Biomedical Science and Engineer- ing, 3, 868-883. doi:10.4236/jbise.2010.39117 [37] Parisi, G. and Frisch, U. (1985) In: Ghil, N., Benzi, R., and Parisi, G., Eds., Turbulence and Predictability of Geophysical Flows and Climatic Dynamics. North Hol- land, Amsterdam, 84-87. [38] Halsey, T.C. Jensen, M.H., Kadanoff, L.P., Procaccia, I. and Shraiman, B. (1986) Fractal measure and their sin- gularities: The characterization of strange sets. Physical Review A, 33, 1141-1151. doi:10.1103/PhysRevA.33.1141 [39] MIPS data. (2010). The yeast genome project. http://www.mips.biochem.mpg.de/ [40] Grantham, R. (1980) Working of the genetic code. Trends in Biochemical Sciences (TIBS), 5, 327-331. doi:10.1016/0968-0004(80)90143-7 [41] Cohen, W.D. and Gardner, R.S. (1959) Viral theory and endosymbiosis. http://www.psychoneuroendocrinology.com/symbiosis.pd f. [42] Lynn, S. (1967) On the origin of mitosing cells. Journal of Theoretical Biology, 14, 255-274 [43] Blanchard, J.L. and Lynch, M. (2000) Organellar genes: Why do they end up in the nucleus? Trends in Geneicst. 16, 315-320. doi:10.1016/S0168-9525(00)02053-9 [44] Peng, C.K., Buldrev, S.V., Goldberger, A.L., Havlin, S., Sciortino, M., Simons, M. and Stanley, H.E. (1992) Long-range correlations in nucleotide sequences. Nature, 356, 168-170. doi:10.1038/356168a0 [45] Voss, R.F. (1992) Evolution of long-range fractal correla- tion and 1/f noise in DNA base sequences. Physical Re- view Letters, 68, 3805-3809. doi:10.1103/PhysRevLett.68.3805 [46] Bains, W. (1993) Local self-similarity of sequence in mammalian nuclear DNA is modulated by a 180 bp pe- riodicity. Journal of Theoretical Biology, 161, 137-143. doi:10.1006/jtbi.1993.1046 [47] Weinberger, E.D. and Stadler, P.F. (1993) Why some fitness landscapes are fractal. Journal of Theoretical Bi- ology, 163, 255-275. doi:10.1006/jtbi.1993.1120 [48] Crick, F.H.C. (1971) General model for the chromo- somes of higher organisms. Nature, 234, 25-27. doi:10.1038/234025a0 [49] Crick, F.H.C, Wang, J.C. and Bauer, W.R. (1979) Is DNA really a double helix? Journal of Molecular Biology, 129, 449-461. doi:10.1016/0022-2836(79)90506-0
|