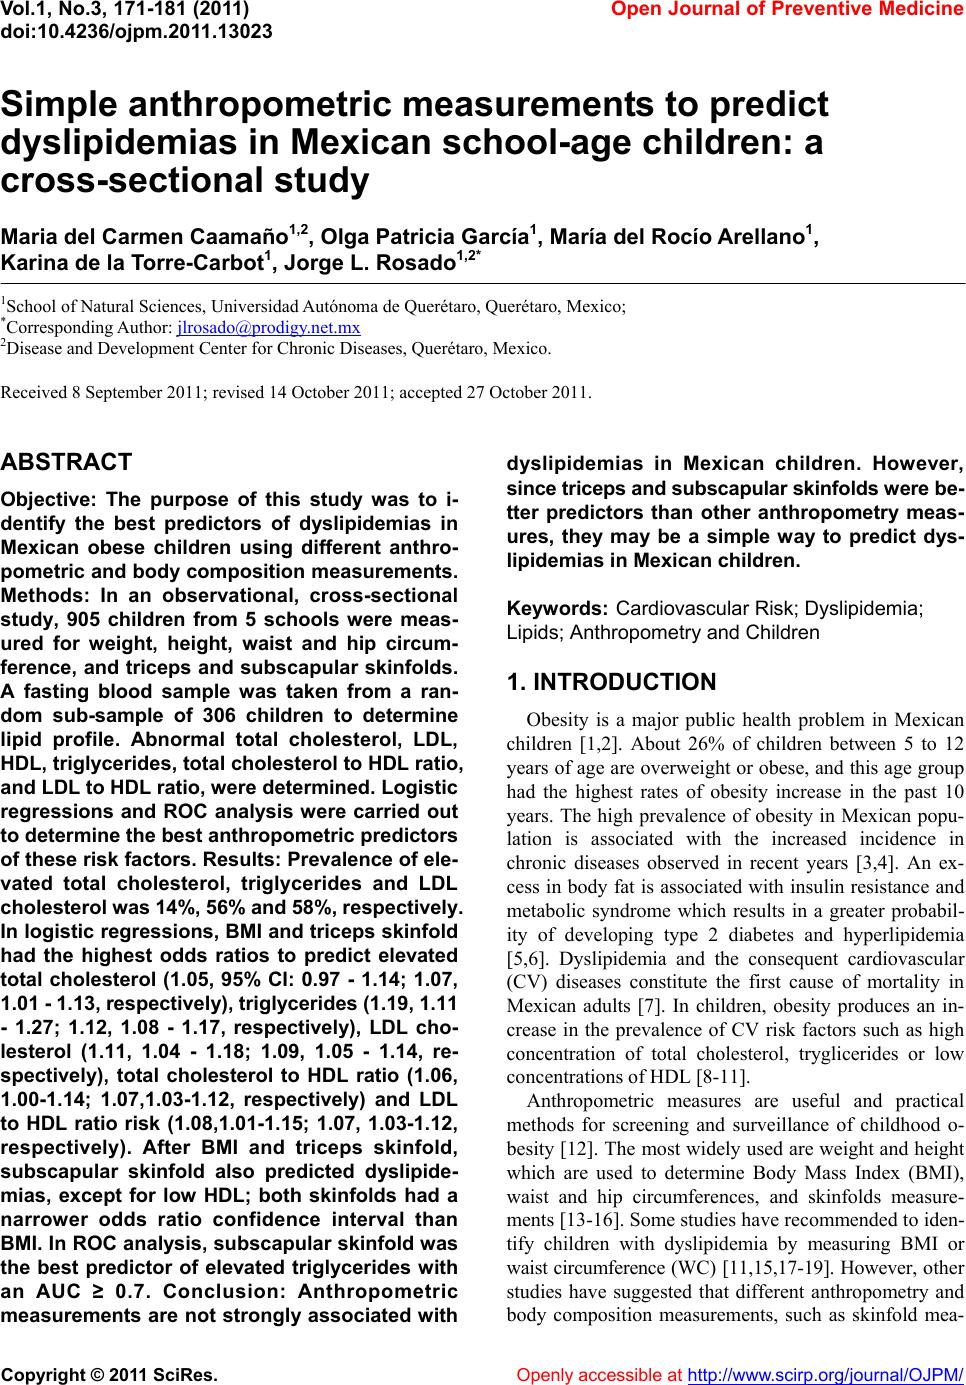
 Vol.1, No.3, 171-181 (2011) doi:10.4236/ojpm.2011.13023 C opyright © 2011 SciRes. Openly accessible at http://www.scirp.org/journal/OJPM/ Open Journal of Preventive Medicine Simple anthropometric measurements to predict dyslipidemias in Mexican school-age children: a cross-sectional study Maria del Carmen Caamaño1,2, Olga Patricia García1, María del Rocío Arellano1, Karina de la Torre-Carbot1, Jorge L. Rosado1,2* 1School of Natural Sciences, Universidad Autónoma de Querétaro, Querétaro, Mexico; *Corresponding Author: jlrosado@prodigy.net.mx 2Disease and Development Center for Chronic Diseases, Querétaro, Mexico. Received 8 September 2011; revised 14 October 2011; accepted 27 October 2011. ABSTRACT Objective: The purpose of this study was to i- dentify the best predictors of dyslipidemias in Mexican obese children using different anthro- pometric and body composition measurements. Methods: In an observational, cross-sectional study, 905 children from 5 schools were meas- ured for weight, height, waist and hip circum- ference, and triceps and subscapular skinfolds. A fasting blood sample was taken from a ran- dom sub-sample of 306 children to determine lipid profile. Abnormal total cholesterol, LDL, HDL, triglycerides, total cholesterol to HDL ratio, and LDL to HDL ratio, were determined. Logistic regressions and ROC analysis were carried out to determine the best anthropometric predictors of these risk factors. Results: Prevalence of ele- vated total cholesterol, triglycerides and LDL cholesterol was 14%, 56% and 58%, respectively. In logistic regressions, BMI and triceps skinfold had the highest odds ratios to predict elevated total cholesterol (1.05, 95% CI: 0.97 - 1.14; 1.07, 1.01 - 1.13, respectively), triglycerides (1.19, 1.11 - 1.27; 1.12, 1.08 - 1.17, respectively), LDL cho- lesterol (1.11, 1.04 - 1.18; 1.09, 1.05 - 1.14, re- spectively), total cholesterol to HDL ratio (1.06, 1.00-1.14; 1.07,1.03-1.12, respectively) and LDL to HDL ratio risk (1.08,1.01-1.15; 1.07, 1.03-1.12, respectively). After BMI and triceps skinfold, subscapular skinfold also predicted dyslipide- mias, except for low HDL; both skinfolds had a narrower odds ratio confidence interval than BMI. In ROC analysis, subscapular skinfold was the best predictor of elevated triglycerides with an AUC ≥ 0.7. Conclusion: Anthropometric measurements are not strongly associated with dyslipidemias in Mexican children. However, since triceps and subscapular skinfolds were be- tter predictors than other anthropometry meas- ures, they may be a simple way to predict dys- lipidemias in Mexican children. Keywords: Cardiovascular Risk; Dyslipidemia; Lipids; Anthropometry and Children 1. INTRODUCTION Obesity is a major public health problem in Mexican children [1,2]. About 26% of children between 5 to 12 years of age are overweight or obese, and this age group had the highest rates of obesity increase in the past 10 years. The high prevalence of obesity in Mexican popu- lation is associated with the increased incidence in chronic diseases observed in recent years [3,4]. An ex- cess in body fat is associated with insulin resistance and metabolic syndrome which results in a greater probabil- ity of developing type 2 diabetes and hyperlipidemia [5,6]. Dyslipidemia and the consequent cardiovascular (CV) diseases constitute the first cause of mortality in Mexican adults [7]. In children, obesity produces an in- crease in the prevalence of CV risk factors such as high concentration of total cholesterol, tryglicerides or low concentrations of HDL [8-11]. Anthropometric measures are useful and practical methods for screening and surveillance of childhood o- besity [12]. The most widely used are weight and height which are used to determine Body Mass Index (BMI), waist and hip circumferences, and skinfolds measure- ments [13-16]. Some studies have recommended to iden- tify children with dyslipidemia by measuring BMI or waist circumference (WC) [11,15,17-19]. However, other studies have suggested that different anthropometry and body composition measurements, such as skinfold mea- 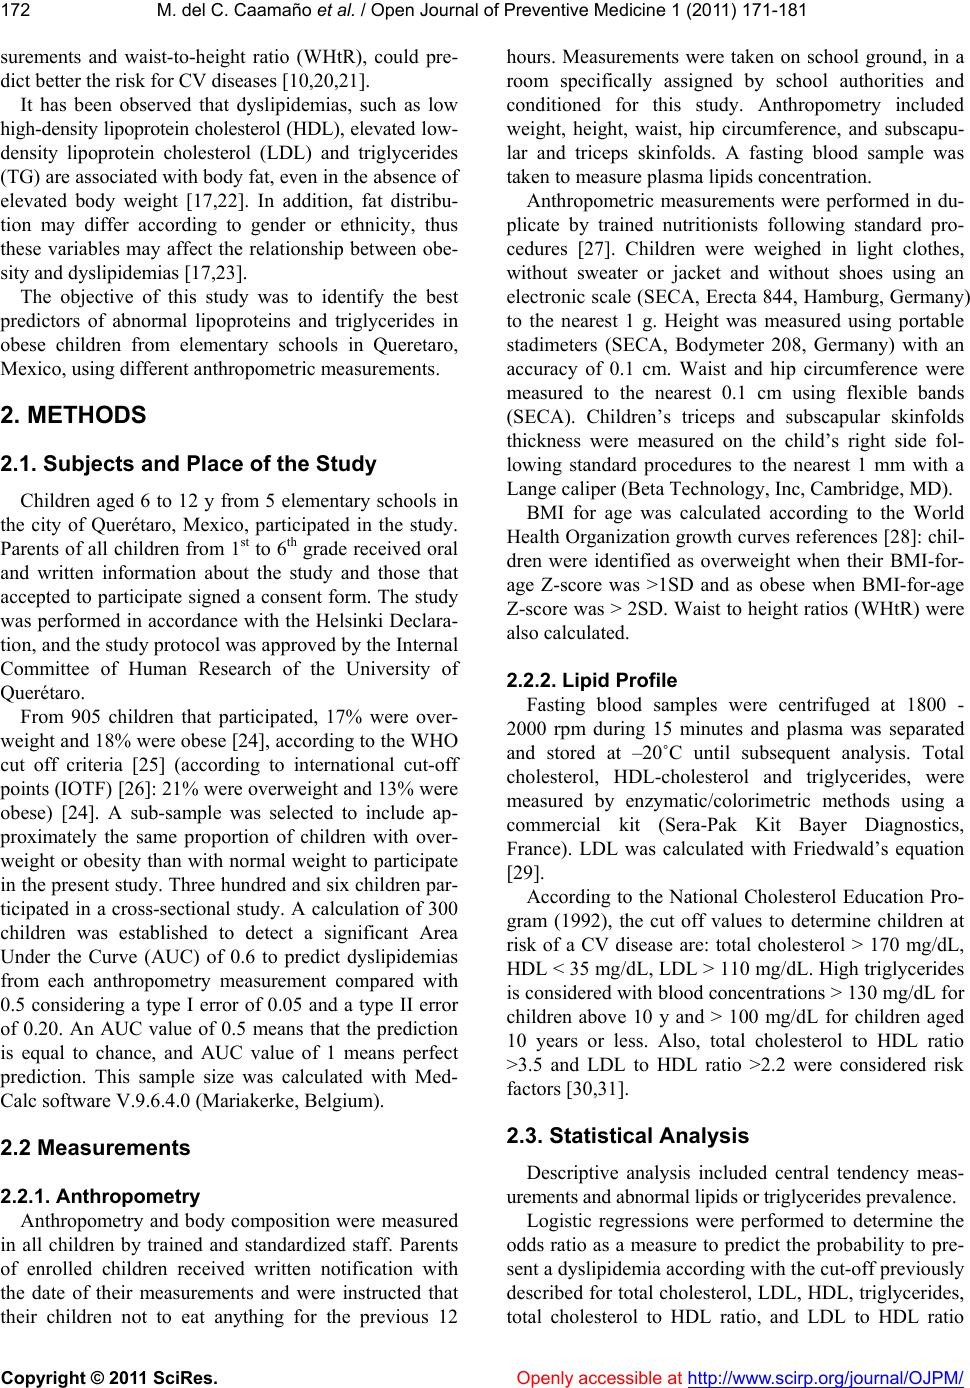 M. del C. Caamaño et al. / Open Journal of Preventive Medicine 1 (20 11) 171-181 Copyright © 2011 SciRes. Openly accessible at http://www.scirp.org/journal/OJPM/ 172 surements and waist-to-height ratio (WHtR), could pre- dict better the risk for CV diseases [10,20,21]. It has been observed that dyslipidemias, such as low high-density lipoprotein cholesterol (HDL), elevated low- density lipoprotein cholesterol (LDL) and triglycerides (TG) are associated with body fat, even in the absence of elevated body weight [17,22]. In addition, fat distribu- tion may differ according to gender or ethnicity, thus these variables may affect the relationship between obe- sity and dyslipidemias [17,23]. The objective of this study was to identify the best predictors of abnormal lipoproteins and triglycerides in obese children from elementary schools in Queretaro, Mexico, using different anthropometric measurements. 2. METHODS 2.1. Subjects and Place of the Study Children aged 6 to 12 y from 5 elementary schools in the city of Querétaro, Mexico, participated in the study. Parents of all children from 1st to 6th grade received oral and written information about the study and those that accepted to participate signed a consent form. The study was performed in accordance with the Helsinki Declara- tion, and the study protocol was approved by the Internal Committee of Human Research of the University of Querétaro. From 905 children that participated, 17% were over- weight and 18% were obese [24], according to the WHO cut off criteria [25] (according to international cut-off points (IOTF) [26]: 21% were overweight and 13% were obese) [24]. A sub-sample was selected to include ap- proximately the same proportion of children with over- weight or obesity than with normal weight to participate in the present study. Three hundred and six children par- ticipated in a cross-sectional study. A calculation of 300 children was established to detect a significant Area Under the Curve (AUC) of 0.6 to predict dyslipidemias from each anthropometry measurement compared with 0.5 considering a type I error of 0.05 and a type II error of 0.20. An AUC value of 0.5 means that the prediction is equal to chance, and AUC value of 1 means perfect prediction. This sample size was calculated with Med- Calc software V.9.6.4.0 (Mariakerke, Belgium). 2.2 Measurements 2.2.1. Anthropometry Anthropometry and body composition were measured in all children by trained and standardized staff. Parents of enrolled children received written notification with the date of their measurements and were instructed that their children not to eat anything for the previous 12 hours. Measurements were taken on school ground, in a room specifically assigned by school authorities and conditioned for this study. Anthropometry included weight, height, waist, hip circumference, and subscapu- lar and triceps skinfolds. A fasting blood sample was taken to measure plasma lipids concentration. Anthropometric measurements were performed in du- plicate by trained nutritionists following standard pro- cedures [27]. Children were weighed in light clothes, without sweater or jacket and without shoes using an electronic scale (SECA, Erecta 844, Hamburg, Germany) to the nearest 1 g. Height was measured using portable stadimeters (SECA, Bodymeter 208, Germany) with an accuracy of 0.1 cm. Waist and hip circumference were measured to the nearest 0.1 cm using flexible bands (SECA). Children’s triceps and subscapular skinfolds thickness were measured on the child’s right side fol- lowing standard procedures to the nearest 1 mm with a Lange caliper (Beta Technology, Inc, Cambridge, MD). BMI for age was calculated according to the World Health Organization growth curves references [28]: chil- dren were identified as overweight when their BMI-for- age Z-score was >1SD and as obese when BMI-for-age Z-score was > 2SD. Waist to height ratios (WHtR) were also calculated. 2.2.2. Lipid Profile Fasting blood samples were centrifuged at 1800 - 2000 rpm during 15 minutes and plasma was separated and stored at –20˚C until subsequent analysis. Total cholesterol, HDL-cholesterol and triglycerides, were measured by enzymatic/colorimetric methods using a commercial kit (Sera-Pak Kit Bayer Diagnostics, France). LDL was calculated with Friedwald’s equation [29]. According to the National Cholesterol Education Pro- gram (1992), the cut off values to determine children at risk of a CV disease are: total cholesterol > 170 mg/dL, HDL < 35 mg/dL, LDL > 110 mg/dL. High triglycerides is considered with blood concentrations > 130 mg/dL for children above 10 y and > 100 mg/dL for children aged 10 years or less. Also, total cholesterol to HDL ratio >3.5 and LDL to HDL ratio >2.2 were considered risk factors [30,31]. 2.3. Statistical Analysis Descriptive analysis included central tendency meas- urements and abnormal lipids or triglycerides prevalence. Logistic regressions were performed to determine the odds ratio as a measure to predict the probability to pre- sent a dyslipidemia according with the cut-off previously described for total cholesterol, LDL, HDL, triglycerides, total cholesterol to HDL ratio, and LDL to HDL ratio 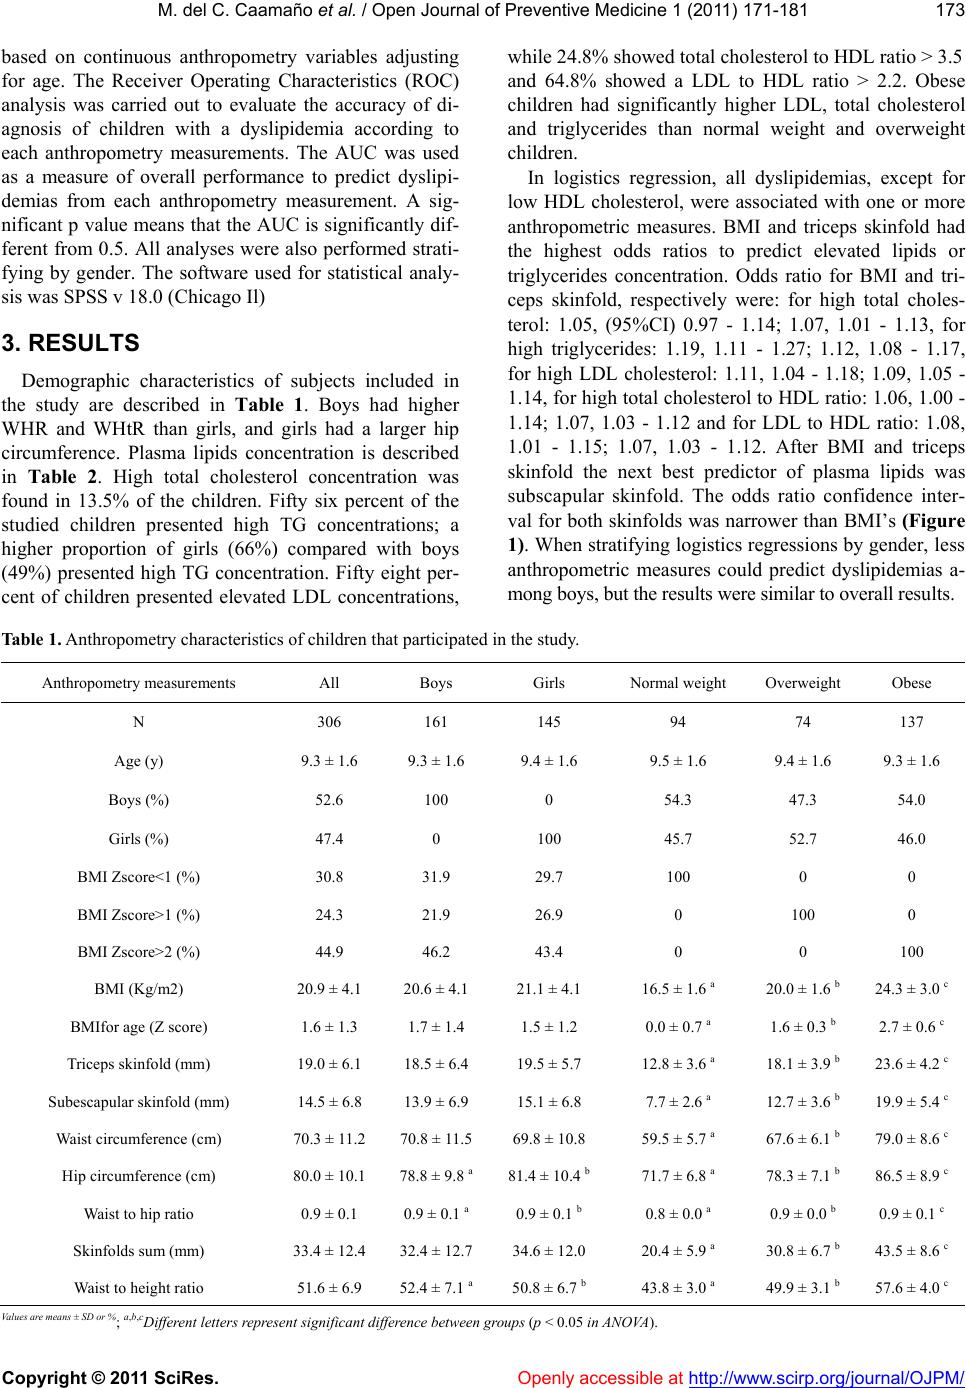 M. del C. Caamaño et al. / Open Journal of Preventive Medicine 1 (20 11) 171-181 Copyright © 2011 SciRes. http://www.scirp.org/journal/OJPM/Openly accessible at 173 based on continuous anthropometry variables adjusting for age. The Receiver Operating Characteristics (ROC) analysis was carried out to evaluate the accuracy of di- agnosis of children with a dyslipidemia according to each anthropometry measurements. The AUC was used as a measure of overall performance to predict dyslipi- demias from each anthropometry measurement. A sig- nificant p value means that the AUC is significantly dif- ferent from 0.5. All analyses were also performed strati- fying by gender. The software used for statistical analy- sis was SPSS v 18.0 (Chicago Il) 3. RESULTS Demographic characteristics of subjects included in the study are described in Table 1. Boys had higher WHR and WHtR than girls, and girls had a larger hip circumference. Plasma lipids concentration is described in Table 2. High total cholesterol concentration was found in 13.5% of the children. Fifty six percent of the studied children presented high TG concentrations; a higher proportion of girls (66%) compared with boys (49%) presented high TG concentration. Fifty eight per- cent of children presented elevated LDL concentrations, while 24.8% showed total cholesterol to HDL ratio > 3.5 and 64.8% showed a LDL to HDL ratio > 2.2. Obese children had significantly higher LDL, total cholesterol and triglycerides than normal weight and overweight children. In logistics regression, all dyslipidemias, except for low HDL cholesterol, were associated with one or more anthropometric measures. BMI and triceps skinfold had the highest odds ratios to predict elevated lipids or triglycerides concentration. Odds ratio for BMI and tri- ceps skinfold, respectively were: for high total choles- terol: 1.05, (95%CI) 0.97 - 1.14; 1.07, 1.01 - 1.13, for high triglycerides: 1.19, 1.11 - 1.27; 1.12, 1.08 - 1.17, for high LDL cholesterol: 1.11, 1.04 - 1.18; 1.09, 1.05 - 1.14, for high total cholesterol to HDL ratio: 1.06, 1.00 - 1.14; 1.07, 1.03 - 1.12 and for LDL to HDL ratio: 1.08, 1.01 - 1.15; 1.07, 1.03 - 1.12. After BMI and triceps skinfold the next best predictor of plasma lipids was subscapular skinfold. The odds ratio confidence inter- val for both skinfolds was narrower than BMI’s (Figure 1). When stratifying logistics regressions by gender, less anthropometric measures could predict dyslipidemias a- mong boys, but the results were similar to overall results. Table 1. Anthropometry characteristics of children that participated in the study. Anthropometry measurements All Boys Girls Normal weight Overweight Obese N 306 161 145 94 74 137 Age (y) 9.3 ± 1.6 9.3 ± 1.6 9.4 ± 1.6 9.5 ± 1.6 9.4 ± 1.6 9.3 ± 1.6 Boys (%) 52.6 100 0 54.3 47.3 54.0 Girls (%) 47.4 0 100 45.7 52.7 46.0 BMI Zscore<1 (%) 30.8 31.9 29.7 100 0 0 BMI Zscore>1 (%) 24.3 21.9 26.9 0 100 0 BMI Zscore>2 (%) 44.9 46.2 43.4 0 0 100 BMI (Kg/m2) 20.9 ± 4.1 20.6 ± 4.1 21.1 ± 4.1 16.5 ± 1.6 a 20.0 ± 1.6 b 24.3 ± 3.0 c BMIfor age (Z score) 1.6 ± 1.3 1.7 ± 1.4 1.5 ± 1.2 0.0 ± 0.7 a 1.6 ± 0.3 b 2.7 ± 0.6 c Triceps skinfold (mm) 19.0 ± 6.1 18.5 ± 6.4 19.5 ± 5.7 12.8 ± 3.6 a 18.1 ± 3.9 b 23.6 ± 4.2 c Subescapular skinfold (mm) 14.5 ± 6.8 13.9 ± 6.9 15.1 ± 6.8 7.7 ± 2.6 a 12.7 ± 3.6 b 19.9 ± 5.4 c Waist circumference (cm) 70.3 ± 11.2 70.8 ± 11.5 69.8 ± 10.8 59.5 ± 5.7 a 67.6 ± 6.1 b 79.0 ± 8.6 c Hip circumference (cm) 80.0 ± 10.1 78.8 ± 9.8 a 81.4 ± 10.4 b 71.7 ± 6.8 a 78.3 ± 7.1 b 86.5 ± 8.9 c Waist to hip ratio 0.9 ± 0.1 0.9 ± 0.1 a 0.9 ± 0.1 b 0.8 ± 0.0 a 0.9 ± 0.0 b 0.9 ± 0.1 c Skinfolds sum (mm) 33.4 ± 12.4 32.4 ± 12.7 34.6 ± 12.0 20.4 ± 5.9 a 30.8 ± 6.7 b 43.5 ± 8.6 c Waist to height ratio 51.6 ± 6.9 52.4 ± 7.1 a 50.8 ± 6.7 b 43.8 ± 3.0 a 49.9 ± 3.1 b 57.6 ± 4.0 c Values are means ± SD or %; a,b,cDifferent letters represent significant difference between groups (p < 0.05 in ANOVA).  M. del C. Caamaño et al. / Open Journal of Preventive Medicine 1 (20 11) 171-181 Copyright © 2011 SciRes. Openly accessible at http://www.scirp.org/journal/OJPM/ 174 Table 2. Lipids concentration in school-age children. Lipids concentration All Boys Girls Normal Overweight Obesity Total cholesterol (mg/dL) (306) 136.4 ± 31.1(161) 138.1 ± 30.3(145) 134.5 ± 31.9(94) 131.1 ± 28.1 a(74) 128.3 ± 30.5 a (137) 144.2 ± 31.8b Triglycerides (mg/dL) (301) 118.7 ± 48.8(157) 111.6 ± 46.6a(144) 126.4 ± 50.1b(93) 103.6 ± 48.6 a(74) 114.4 ± 45.5 a (133) 131.6 ± 47.8b HDL Cholesterol (mg/dL) (302) 48.2 ± 10.7(159) 49.1 ± 10.5 (143) 47.1 ± 10.9 (93) 48.4 ± 8.7 (74) 47.8 ± 11.7 (134) 48.3 ± 11.5 LDL Cholesterol (mg/dL) (296) 118.2 ± 33.3(156) 117.6 ± 31.3(140) 118.8 ± 35.5(93) 114.2 ± 34.9 a(74) 109.5 ± 35.1 a (128) 126.0 ± 29.4b Total cholesterol to HDL ratio (300) 2.9 ± 0.8 (157) 2.9 ± 0.8 (143) 3.0 ± 0.9 (92) 2.8 ± 0.7 a (73) 2.8 ± 0.9 a (134) 3.1 ± 0.9b LDL cholesterol to HDL ratio (293) 2.6 ± 0.9 (153) 2.5 ± 0.9 (140) 2.6 ± 0.9 (91) 2.4 ± 0.8 a (73) 2.4 ± 1.0 a (128) 2.8 ± 0.9b Values are (n) mean ± SD; a,bDifferent letters represent significance level of p < 0.05 i n ANOVA among gender or BMI category explain. Among girls, all types of dyslipidemias were predicted by some anthropometric measures; skinfolds had similar odds ratio than BMI but narrower confidence intervals. HDL cholesterol was better predicted only in girls by BMI percentile and WC (Figures 2-3). The ROC analysis showed that the only indicator of dyslipidemia that was fairly well predicted by an an- thropometric measurement with an AUC ≥ 70 was high TG by subscapular skinfold (Table 3). Among boys, the best predicted dyslipidemias were high TG by the WHR and high LDL cholesterol by the triceps skinfold; among girls, only high TG values were well predicted by sub- scapular skinfold with the highest AUC value followed by BMI, WHtR, WC and the sum of both skinfolds. 4. DISCUSSION The prevalence of obesity in school-age Mexican children is high, similar to some developed countries [32] and is one of the highest in the world [1]. As found in other studies in obese children with similar age groups [8,33], the most prevalent dyslipidemia in the present study was high concentration of TG, followed by high concentrations of LDL cholesterol. In the population studied, dyslipidemias are not con- sistently present in obese children and non-obese chil- dren may present abnormal lipids concentration, which makes difficult to identify children at risk. For this rea- son the AUC values from ROC curves to predict abnor- mal lipids and triglycerides concentration from most anthropometric measurements were slightly lower than those reported from obese children in other populations. For instance, in Argentinean school-age children AUC values to predict low HDL and high triglycerides were 0.87, 0.83, and 0.84 for BMI, WC and WHtR, respect- tively [34] and in Chinese adolescents the AUC to pre- dict clustering of risk factors from BMI in girls and boys were 0.85 and 0.76, and from WC were 0.82 and 0.78, respectively. The highest AUC value found in the pre- sent study was 0.72, an acceptable value to predict high triglycerides from subscapular skinfold. The highest AUC values from anthropometric measures, BMI, WC or WHtR, that have been recognized as good predictors of CV disease in other studies [19,35] differed from boys to girls and overall were lower than skinfolds to predict high triglycerides. Body mass index had the highest odds ratio in logis- tics regression, which means that the higher the BMI, the higher the risk to have elevated lipids or triglycerides. However the confidence interval for these odds ratio was much wider than other anthropometry measurements that had a similar odds ratio, which means that there is a higher variability of the association between BMI and lipids and TG concentrations than there is with other anthropometric measurements. That may be the reason why in ROC curves, triceps and subscapular skinfolds seemed to diagnose similarly or even better than BMI, WC, or WHtR. Although different anthropometry measurements have been evaluated to predict body fat or dyslipidemias, few studies have compared skinfolds thickness with BMI or waist measurements to identify children at risk of a CV disease. Results from similar studies are controversial; some studies have found similar results than the ones found in the present study. Teixeira et al. [10] concluded that trunk skinfolds predict CV disease as well as DXA body fat variables did in Portuguese pre-adolescents. Maffeis et al. [36] found that subscapular and triceps skinfolds, as well as WC, may be helpful in identifying prepubertal children with an adverse blood-lipids profile and hypertension. In contrast, some studies have recommended different 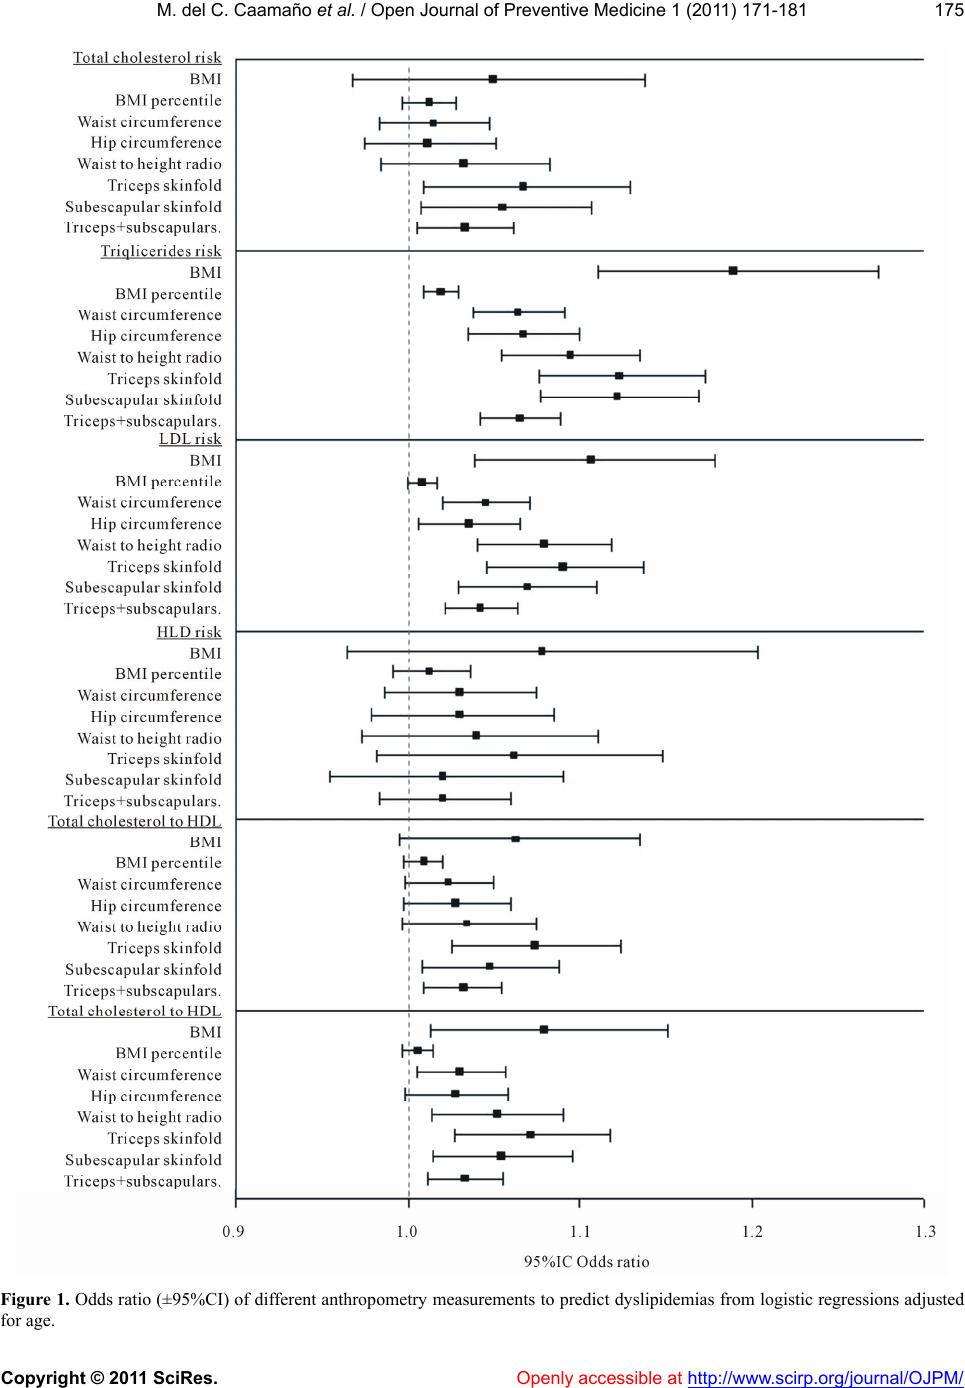 M. del C. Caamaño et al. / Open Journal of Preventive Medicine 1 (20 11) 171-181 Copyright © 2011 SciRes. Openly accessible at http://www.scirp.org/journal/OJPM/ 175 Figure 1. Odds ratio (±95%CI) of different anthropometry measurements to predict dyslipidemias from logistic regressions adjusted for age. 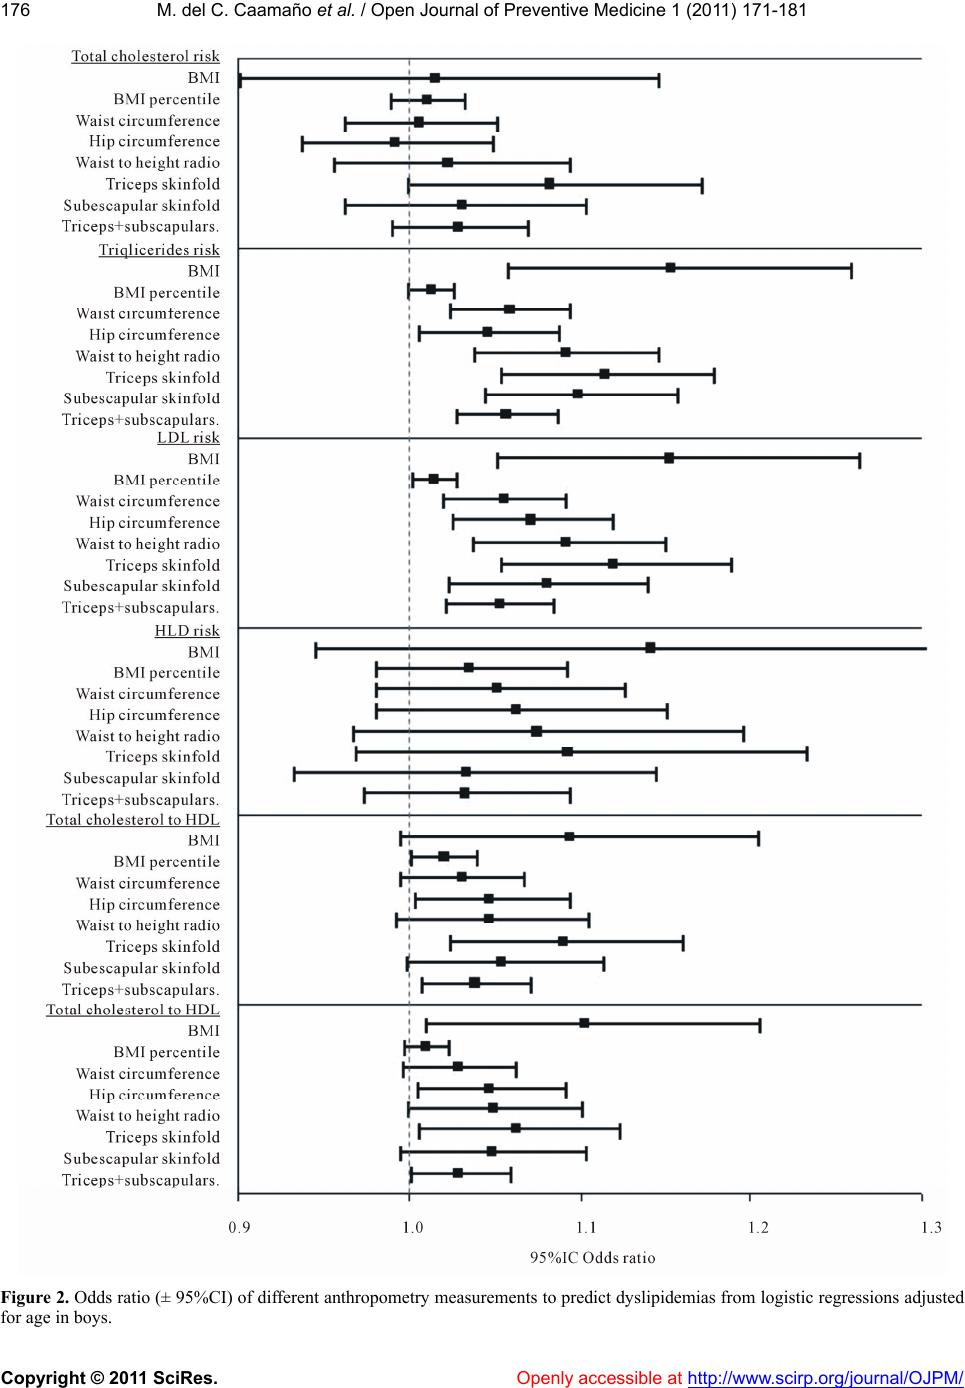 M. del C. Caamaño et al. / Open Journal of Preventive Medicine 1 (20 11) 171-181 Copyright © 2011 SciRes. Openly accessible at http://www.scirp.org/journal/OJPM/ 176 Figure 2. Odds ratio (± 95%CI) of different anthropometry measurements to predict dyslipidemias from logistic regressions adjusted for age in boys. 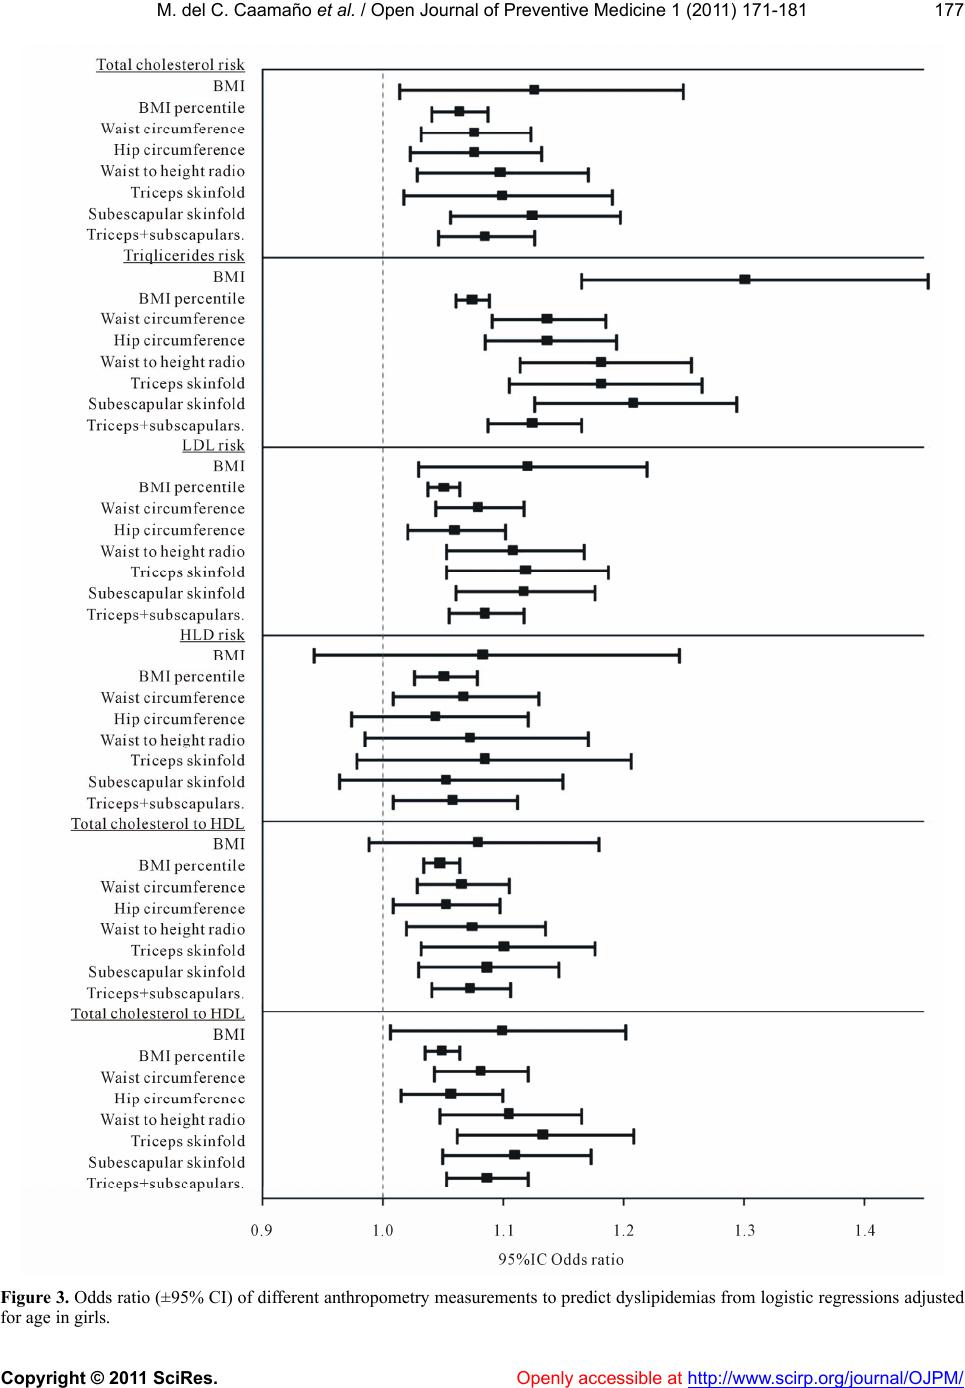 M. del C. Caamaño et al. / Open Journal of Preventive Medicine 1 (20 11) 171-181 Copyright © 2011 SciRes. Openly accessible at http://www.scirp.org/journal/OJPM/ 177 Figure 3. Odds ratio (±95% CI) of different anthropometry measurements to predict dyslipidemias from logistic regressions adjusted for age in girls. 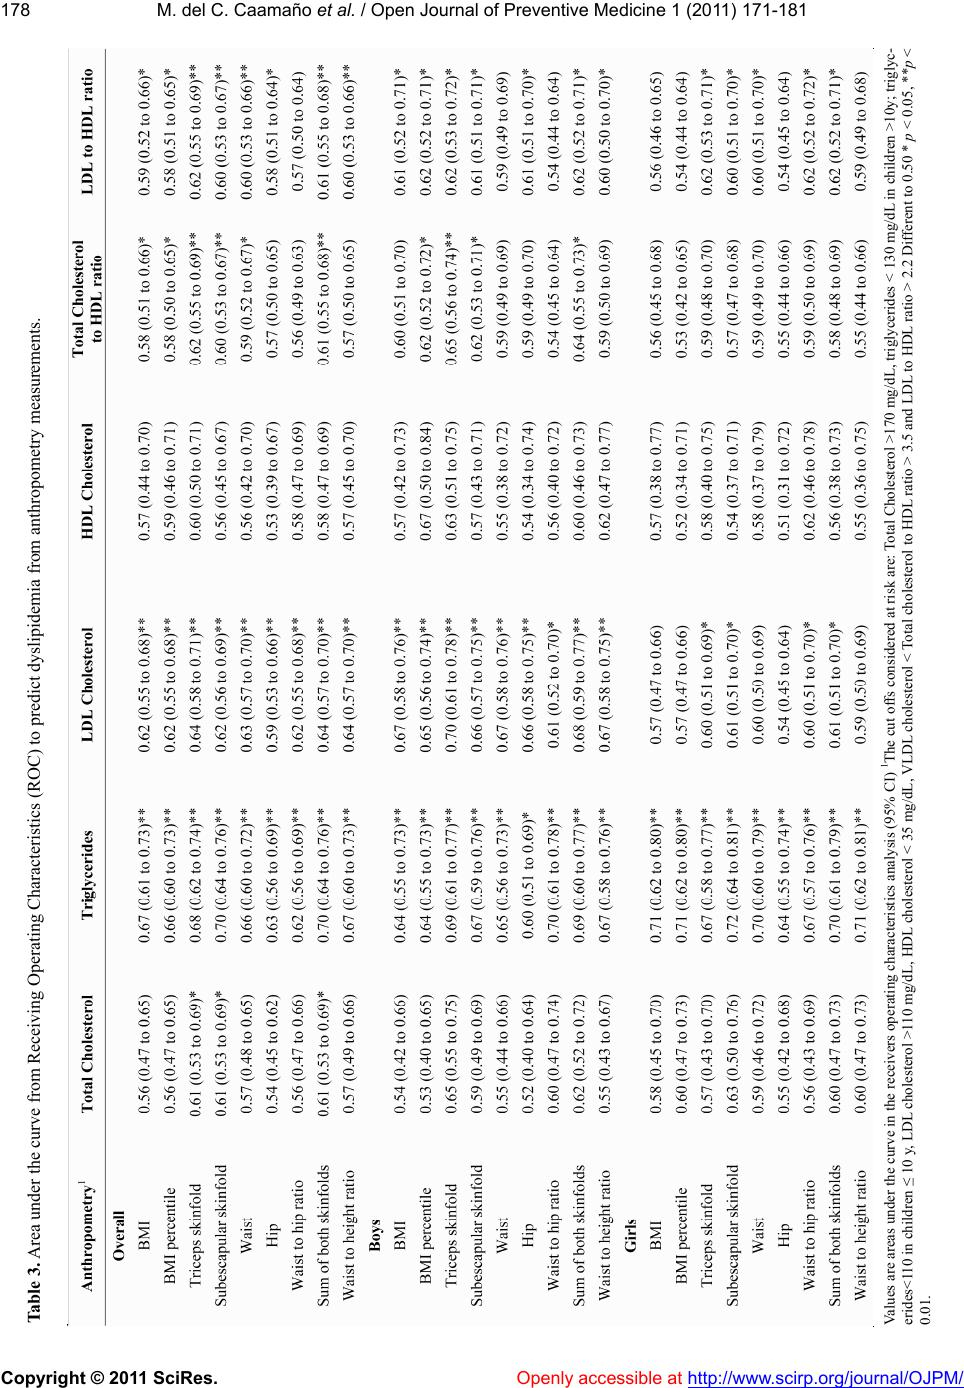 M. del C. Caamaño et al. / Open Journal of Preventive Medicine 1 (20 11) 171-181 Copyright © 2011 SciRes. Openly accessible at http://www.scirp.org/journal/OJPM/ 178 Table 3. Area under the curve from Receiving Operating Characteristics (ROC) to predict dyslipidemia from anthropometry measurements. Values are areas under the curve in the receivers operating characteristics analysis (95% CI) 1The cut offs considered at risk are: Total Cholesterol >170 mg/dL, triglycerides < 130 mg/dL in children >10y; triglyc- erides<110 in children ≤ 10 y, LDL cholesterol >110 mg/dL, HDL cholesterol < 35 mg/dL, VLDL cholesterol < Total cholesterol to HDL ratio > 3.5 and LDL to HDL ratio > 2.2 Different to 0.50 * p < 0.05, **p < 0.01.  M. del C. Caamaño et al. / Open Journal of Preventive Medicine 1 (20 11) 171-181 Copyright © 2011 SciRes. http://www.scirp.org/journal/OJPM/ 179 5. ACKNOWLEDGEMENTS measurements than skinfolds to adequately predict dys- lipidemias. Geiss et al. [11] concluded that height-to- weight indices, such as BMI, in prepubescent German children, are best predictors of CV risk factors. Feedman et al. [37] also reported that WHtR is better than skin- folds to predict adult CV risk in a bi-racial sample of American children; although, in the same study, the pre- diction from the sum of skinfolds thickness did not differ much from WHtR’s. We are thankful to the schools that kindly agreed to participate in this study. We would like to thank Juana Ramirez Anguiano, Paola García Juarez and Abigail Dominguez Chavero for their dedicated work, and to Elba Suaste for her special touch when taking blood from children and her assistance with laboratory work. No conflicts of interest are stated, the study was partially funded by Conacyt Mexico The different predictors found among studies may be related to ethnicity, gender and age which can affect the relationship between the ratio of subcutaneous fat to total body fat [12,38,39] and consequently anthropome- try predictors of dyslipidemias may differ according to such demographic characteristics [40-42]. For in- stance, in the present study high LDL cholesterol was better predicted in boys than in girls, probably because differ- ences of fat deposition between boys and girls. Similarly the distinct ethnic characteristics of our sample may re- sult in a different fat deposition distribution which could have led to a better prediction of dyslipidemias with tri- ceps and subscapular skinfolds. REFERENCES [1] Perichart-Perera, O., Balas-Nakash, M., Ortiz-Rodriguez, V., et al. (2008) A program to improve some cardio- vascular risk factors in Mexican school age children. Sa- lud Pública de México, 50, 218-226. [2] Olaiz-Fernandez, G., Rivera-Domarco, J., Shama-Levy, T., et al. (2006) Encuesta Nacional de Salud y Nutricion 2006. Instituto Nacional de Salud Pública, Cuernavaca, Mexico. [3] Aregullin-Eligio, E.O. and Alcorta-Garza, M.C. (2009) Prevalence and risk factors of high blood pressure in Mexican school children in Sabinas Hidalgo. Salud Pública de México, 51, 14-18. [4] Velazquez-Monroy, O., Rosas Peralta, M., Lara-Esqueda, A., et al. (2003) Prevalence and interrelations of non- communicable chronic diseases and cardiovascular risk factors in Mexico. Final outcomes from the National Health Survey 2000. Archivos de cardiologia de Mexico, 73, 62-77. It is known that skinfold measurement, such as triceps and subscapular thickness, are a direct measure of body fat. Even though skinfolds’ thickness do not predict vis- ceral fat as well as other anthropometry measurements, such as WC or WHtR [43], they have been well accepted measurements to predict body fat [44], and consequently they could be good predictors of dyslipidemias. [5] Perichart-Perera, O., Balas-Nakash, M., Schiffman-Sele- chnik, E., et al. (2007) Obesity increases metabolic syn- drome risk factors in school-aged children from an urban school in Mexico city. Journal of the American Dietetic Association, 107, 81-91. doi:10.1016/j.jada.2006.10.011 In order to improve the accurateness of dyslipidemia prediction from triceps and subscapular skinfolds, cutoff values according to age and gender in specific ethnos, such as Mexican children, should be determined. Addo & Himes et al. [45] established triceps and subscapular skinfold thickness cut offs for age and gender in Ameri- can children. A limitation of the present study was that the sample size was insufficient to suggest cutoff values stratified by age and gender in Mexican children or to test the cutoff values already reported [45]. Therefore, future research studies with a larger sample size are recommended to define cutoff values for age and gender that are appropriate for Mexican children, and to confirm its efficacy as part of the strategies of public health pro- grams for the prevention and control of CV disease. [6] Haffner, S.M. (2006) Relationship of metabolic risk fac- tors and development of cardiovascular disease and dia- betes. Obesity (Silver Spring), 14, 121S-127S. doi:10.1038/oby.2006.291 [7] Velázquez-Monroy, O., Barinagarrementería-Aldatz, F. S., Rubio-Guerra, A.F., et al. (2007) Morbidity and mor- tality by ischemic heart disease and stroke in Mexico 2005. Archivos de Cardiologia de Mexico, 77, 31-39. [8] Del-Rio-Navarro, B. E., Velazquez-Monroy, O., Lara- Esqueda, A., et al. (2008) Obesity and metabolic risks in children. Archives of Medical Research, 39, 215-221. doi:10.1016/j.arcmed.2007.07.008 [9] Bueno, G., Moreno, L. A., Bueno, O., et al. (2007) Meta- bolic risk-factor clustering estimation in obese children. Journal of Physiology and Biochemistry, 63, 347-355. doi:10.1007/BF03165 766 In conclusion, there is a high prevalence of obesity and dyslipidemias in Mexican children; the major health concern is the high triglycerides concentration. Anthro- pometric measurements are not strongly associated with dyslipidemias in Mexican children. However, since tri- ceps and subscapular skinfolds were better predictors than other anthropometry measures, they may be a sim- ple way to predict dyslipidemias in Mexican children. [10] Teixeira, P.J., Sardinha, L.B., Going, S.B., et al. (2001) Total and regional fat and serum cardiovascular disease risk factors in lean and obese children and adolescents. Obesity Research, 9, 432-442. doi:10.1038/oby.2001.57 [11] Geiss, H.C., Parhofer, K.G. and Schwandt, P. (2001) Pa- rameters of childhood obesity and their relationship to cardiovascular risk factors in healthy prepubescent chil- dren. Journal of Obesity and Related Metabolic Disor- ders, 25, 830-837. doi:10.1038/sj.ijo.0801594 Openly accessible at  M. del C. Caamaño et al. / Open Journal of Preventive Medicine 1 (20 11) 171-181 Copyright © 2011 SciRes. Openly accessible at http://www.scirp.org/journal/OJPM/ 180 [12] Wang, J., Thornton, J.C., Kolesnik, S., et al. (2000) An- thropometry in body composition. An Overview, Annals of the New York Academy of Sciences, 904, 317-326. doi:10.1111/j.1749-6632.2000.tb06474.x [13] Siminialayi, I.M., Emem-Chioma, P.C., and Dapper, D.V. (2008) The prevalence of obesity as indicated by BMI and waist circumference among Nigerian adults attend- ing family medicine clinics as outpatients in Rivers State. Nigerian Journal of Medicine: Journal of the National Association of Resident Doctors of Nigeria, 17, 340-345. [14] Hubert, H., Guinhouya, C.B., Allard, L., et al. (2009) Comparison of the diagnostic quality of body mass index, waist circumference and waist-to-height ratio in screen- ing skinfold-determined obesity among children. Journal of Science and Medicine in Sport/Sports Medicine Aus- tralia, 12, 449-451. [15] Shalitin, S. and Phillip, M. (2008) Frequency of cardio- vascular risk factors in obese children and adolescents referred to a tertiary care center in Israel, Hormone re- search, 69, 152-159. doi:10.1159/000112588 [16] WHO (1995) Report of the WHO Expert Commettee Physical status: The use and interpretation of anthropom- etry. Geneva. [17] Botton, J., Heude, B., Kettaneh, A., et al. (2007) Cardio- vascular risk factor levels and their relationships with overweight and fat distribution in children: the Fleurbaix Laventie Ville Sante II study, Metabolism: Clinical and Experimental, 56, 614-622. doi:10.1016/j.metabol.2006.12.006 [18] Ng, V.W., Kong, A.P., Choi, K.C., et al. (2007) BMI and waist circumference in predicting cardiovascular risk fac- tor clustering in Chinese adolescents. Obesity (Silver Spring), 15, 494-503. doi:10.1038/oby.2007.588 [19] Katzmarzyk, P.T., Srinivasan, S.R., Chen, W., et al. (2004) Body mass index, waist circumference, and clustering of cardiovascular disease risk factors in a biracial sample of children and adolescents. Pediatrics, 114, e198-e205. doi:10.1542/peds.114.2.e198 [20] Hara, M., Saitou, E., Iwata, F., et al. (2002) Waist-to- height ratio is the best predictor of cardiovascular dis- ease risk factors in Japanese schoolchildren. Journal of atherosclerosis and thrombosis, 9, 127-132. doi:10.5551/jat.9.127 [21] Lin, W. Y., Lee, L. T., Chen, C. Y., et al. (2002) Optimal cut-off values for obesity: Using simple anthropometric indices to predict cardiovascular risk factors in Taiwan. Journal of Obesity and Related Metabolic Disorders, 26, 1232-1238. doi:10.1038/sj.ijo.0802040 [22] Zwiauer, K.F., Pakosta, R., Mueller, T., et al. (1992) Cardiovascular risk factors in obese children in relation to weight and body fat distribution. Journal of the Ame- rican College of Nutrition, 11, 41S-50S. [23] Lear, S.A., Toma, M., Birmingham, C.L., et al. (2003) Modification of the relationship between simple anthro- pometric indices and risk factors by ethnic background. Metabolism: Clinical and Experimental, 52, 1295-1301. doi:10.1016/S0026-0495(03)00196-3 [24] Rosado, J.L., del, R.A.M., Montemayor, K., et al. (2008) An increase of cereal intake as an approach to weight reduction in children is effective only when accompanied by nutrition education: A randomized controlled trial. Nutrition Journal, 7, 28. doi:10.1186/1475-2891-7-28 [25] WHO (2006) WHO child growth standards: length/ height-for-age, weight-for-age, weight-for-length, weight- for-height and body mass index-for-age. Methods and development, WHO, Geneva. [26] Cole, T.J., Bellizzi, M.C., Flegal, K.M., et al. (2000) Establishing a standard definition for child overweight and obesity worldwide: international survey. British Me- dical Journal, 320, 1240-1243. doi:10.1136/bmj.320.7244.1240 [27] Lohman, T.G., Roche, A.F. and Martorell, R. (1988) Anthropometric standardization reference manual. Hu- man Kinetics, Champaign, 39-54. [28] WHO (2006) WHO Child growth standards. Geneva. [29] Friedewald, W.T., Levy, R.I., and Fredrickson, D.S. (1972) Estimation of the concentration of low-density lipopro- tein cholesterol in plasma, without use of the preparative ultracentrifuge. Clinical Chemistry, 18, 499- 502. [30] Bersot, T.P., Pepin, G.M., and Mahley, R.W. (2003) Risk determination of dyslipidemia in populations character- ized by low levels of high-density lipoprotein cholesterol, American Heart Journal, 146, 1052-1059. doi:10.1016/S0002-8703(03)00516-7 [31] Inigo-Martinez, J., Elcarte-Lopez, R., Reparaz-Abaitua, F., et al. (1996) Changes in mean serum lipid levels in pediatric and adolescent population of Navarra between 1987 and 1993. Revista Española de Cardiología, 49, 166-173. [32] Benson, L., Baer, H.J., and Kaelber, D.C. (2009) Trends in the diagnosis of overweight and obesity in children and adolescents: 1999-2007. Pediatrics, 123, e153-e158. doi:10.1542/peds.2008-1408 [33] Hamidi, A., Fakhrzadeh, H., Moayyeri, A., et al. (2006) Obesity and associated cardiovascular risk factors in Ira- nian children: A cross-sectional study. Pediatrics Inter- national: Official Journal of the Japan Pediatric Society, 48, 566-571. [34] Hirschler, V., Molinari, C., Maccallini, G., et al. (2011) Comparison of different anthropometric indices for iden- tifying dyslipidemia in school children. Clinical Bioche- mistry, In Press. doi:10.1016/j.clinbiochem.2011.02.004 [35] Savva, S.C., Tornaritis, M., Savva, M.E., et al. (2000) Waist circumference and waist-to-height ratio are better predictors of cardiovascular disease risk factors in chil- dren than body mass index. Journal of Obesity and Re- lated Metabolic Disorders, 24, 1453-1458. doi:10.1038/sj.ijo.0801401 [36] Maffeis, C., Pietrobelli, A., Grezzani, A., et al. (2001) Waist circumference and cardiovascular risk factors in prepu- bertal children. Obesity Resear ch, 9, 179-187. doi:10.1038/oby.2001.19 [37] Freedman, D.S., Serdula, M.K., Srinivasan, S.R., et al. (1999) Relation of circumferences and skinfold thick- nesses to lipid and insulin concentrations in children and adolescents: the Bogalusa Heart Study. American Jour- nal of Clinical Nutrition, 69, 308-317. [38] Freedman, D.S., Wang, J., Thornton, J.C., et al. (2008) Racial/ethnic differences in body fatness among children and adolescents. Obesity (Silver Spring), 16, 1105-1111. doi:10.1038/oby.2008.30 [39] Wells, J.C. (2001) A critique of the expression of paedia- tric body composition data. Archives of Disease in Child- hood, 85, 67-72. doi:10.1136/adc.85.1.67  M. del C. Caamaño et al. / Open Journal of Preventive Medicine 1 (20 11) 171-181 Copyright © 2011 SciRes. http://www.scirp.org/journal/OJPM/Openly accessible at 181 [40] Van Vliet, M., von Rosenstiel, I.A., Schindhelm, R.K., et al. (2009) Ethnic differences in cardiometabolic risk pro- file in an overweight/obese paediatric cohort in the Netherlands: A cross-sectional study. Cardiovascular di- abetology, 8, 2. doi:10.1186/1475-2840-8-2 [41] Lee, S., Kuk, J.L., Hannon, T.S., et al. (2008) Race and gender differences in the relationships between anthro- pometrics and abdominal fat in youth. Obesity (Silver Spring), 16, 1066-1071. doi:10.1038/oby.2008.13 [42] Moore, D.B., Howell, P.B., and Treiber, F.A. (2002) Adiposity changes in youth with a family history of car- diovascular disease: impact of ethnicity, gender and so- cioeconomic status. Journal of the Association for Aca- demic Minority Physicians: the official publication of the Association for Academic Minority Physicians, 13, 76- 83. [43] Ball, G.D., Huang, T.T., Cruz, M.L., et al. (2006) Pre- dicting abdominal adipose tissue in overweight Latino youth. International Journal of Pediatric Obesity (IJPO): An Official Journal of the International Association for the Study of Obesity, 1, 210-216. [44] Brodie, D.A. (1988) Techniques of measurement of body composition. Part I. Sports Medicine, 5, 11-40. doi:10.2165/00007256-198805010-00003 [45] Addo, O.Y. and Himes, J.H. (2010) Reference curves for triceps and subscapular skinfold thicknesses in US chil- dren and adolescents. American Journal of Clinical Nu- trition, 91, 635-642. doi:10.3945/ajcn.2009.28385
|