Open Access Library Journal
Vol.05 No.04(2018), Article ID:83776,13 pages
10.4236/oalib.1104484
Lots Quality Assurance Survey (LQAS) as a Strategy to Achieving Quality LLIN Campaigns: The Nigerian Experience
Jalal-Eddeen Abubakar Saleh1*, Akubue Augustine Uchenna1, Dr. Abdullahi Saddiq1, Alemu Wondimagegnehu2, Rex Mpazanje1, Dr. Bala Mohammed Audu3
1Communicable Diseases, World Health Organization, Abuja, Nigeria
2WR, World Health Organization Country Office, Abuja, Nigeria
3National Malaria Elimination Programmes, Abuja, Nigeria

Copyright © 2018 by authors and Open Access Library Inc.
This work is licensed under the Creative Commons Attribution International License (CC BY 4.0).
http://creativecommons.org/licenses/by/4.0/


Received: March 9, 2018; Accepted: April 14, 2018; Published: April 17, 2018
ABSTRACT
Background: Nigeria, in its quest to scale up coverage and utilization of LLINs as a strategy for malaria control, had the first long lasting insecticidal net (LLIN) mass campaign across the country between 2009-2013. The NMEP with support from its RBM partners successfully distributed over 57.7 million LLINs during the period representing over 90% of the national target. In spite this, and to achieve universal coverage, the country maintained a continuous distribution through multiple channels and in particular the antenatal care outlets and the expanded programme on immunization. The Nigerian government, with support from the Global Fund and through the National Malaria Elimination Programme (NMEP), Catholic Relief Services (CRS), and the Society for Family Health (SFH) and with technical support from the World Health Organization, once again launched the LLIN replacement campaign in some states across the country. Methods: A cross-sectional survey was conducted in five states that conducted the LLIN replacement campaign using the lots quality assurance survey (LQAS) tool developed by the World Health Organization. The period of the survey across the states is between August and December 2017. The LQAS questionnaires were administered to households (HHs) by the WHO field officers trained on the use of the tool at least one week after the campaign. A total of 240 HHs were selected from 24 settlements (clusters) in 24 wards of six LGAs (lots) from each of the five (5) states that rolled out the campaign. Data collected were double entered, cleaned, crosschecked, and the results analysed using the SPSS version 24. Results: With a total of 9740 people surveyed from 1200 HHs across the five states, the average redemption rate was 95.5% (95% CI, 91.6% - 98.8%), average retention rate was 98.4% (95% CI, 97.0% - 99.8%), average hanging rate was 82.6% (95% CI, 80.0% - 85.5%), and an average card ownership of 83.5% (95% CI, 78.6% - 88.2%). While the main source of information 35.4% (95% CI, 21.8% - 49.0%) about the LLIN campaign was the health workers, the reasons for those missed out were mainly due to team performance 32.2% (95% CI, 26.8% - 37.4%) and net cards not issued 27.4% (95% CI, 23.2% - 32.0%). Similarly, the Pearson correlation (0.942, α 0.017, p < 0.05, 2-tailed test), the ANOVA test (F value of 23.751, α 0.017, p < 0.05), and Regression analysis (R-square 0.888 and Durbin-Watson 2.487), all shows significant relationships between LLIN redemption and usage with a resultant rejection of the Null Hypothesis. Conclusion: The outcome of this research underscores the need to adopt and scale up the use of the LQAS tool to assess the quality of LLIN campaigns within the shortest possible time. While the LQAS has been in use by the WHO Expanded Programme on Immunization cluster during polio campaigns, this is the first time that the tool was deployed by the WHO malaria unit as a strategy to identify post LLIN campaign gaps immediately after implementation. The scaling up of this strategy would undoubtedly improve LLIN campaigns that would be conducted in the remaining states across the country so as to ensure that Nigeria achieve LLIN universal access in line with the Global Technical Strategy (GTS) framework toward malaria elimination.
Subject Areas:
Public Health
Keywords:
Malaria, Long-Lasting Insecticidal Nets, Mass Campaign, Nigeria, Redemption Rates, Utilization Rates, LQAS, Adamawa, Edo, Imo, Kwara, Ondo

1. Background
The use of Long Lasting Insecticide treated Nets (LLINs) has become one of the best and cost-effective interventions for malaria vector control around the globe [1] [2] [3] . Malaria is one of the leading causes of morbidity and mortality especially among children less than five years of age in endemic countries including Nigeria [1] . In order to minimize the socio-economic impact of malaria in the country, the Federal Ministry of Health (FMOH), following the commencement of the Roll Back Malaria initiative in Nigeria in 2011, Nigeria and Roll Back Malaria (RBM) partners have adopted the Scale Up for Impact (SUFI) approach in the revised National Malaria Strategic Plan (NMSP) [4] . The main targets of LLINs distribution in Nigeria were; at least 80% of households to own two or more LLINs/ITN by 2010 with sustained levels until 2013 [4] , and at least 80% of children under five and pregnant women to use the LLIN by sleeping inside by 2010 with sustained levels until 2013. Recently, the Roll Back Malaria Partnership raised coverage targets to 80% LLINs/ITN usage by the entire population at risk and called for universal coverage through ownership by all households of at least one LLIN or every two inhabitants [5] . Several countries recently showed rapid improvements in equitable LLINs ownership and usage following mass free distribution campaigns [1] [4] [5] [6] . Nigeria in its quest to scale up coverage and utilization of LLINs as a strategy for malaria control, had the first long lasting insecticidal net (LLIN) mass campaign across the country between 2009-2013 [1] . The NMEP with support from its RBM partners successfully distributed over 57.7 million LLINs during the five years period representing over 90% of the national target [6] . In spite this, and to achieve a universal coverage, the country maintained a continuous distribution through multiple channels and in particular the antenatal care outlets and the expanded programme on immunization. The Nigerian government, with support from the Global Fund and through the National Malaria Elimination Programme (NMEP), Catholic Relief Services (CRS), and the Society for Family Health (SFH) and with technical support from the World Health Organization, once again launched the LLIN replacement campaign in some states across the country to sustain the gain made over years and replace the destroyed/decayed LLINs in the households.
2. Method
This cross-sectional survey was conducted in five states that conducted the LLIN replacement campaign using the lots quality assurance survey (LQAS) tool developed by the World Health Organization. The states that implemented the campaign, as shown in Figure 1, are Adamawa, Edo, Imo, Kwara, and Ondo, and the period of the survey across the states is between August and December

Figure 1. QGIS showing LLIN campaign implementing states.
2017. The LQAS questionnaires were administered to eligible households (HHs) by the WHO field officers trained on the use of the tool at least one week after the campaign. A total of 240 HHs were selected from 24 settlements (clusters) in 24 wards of six LGAs (lots) from each of the five (5) states that rolled out the campaign.
The LQAS is a random sampling methodology, originally developed in the 1920s as a method of quality control in industrial production [7] . It is a statistical methodology used for data collection in health and other programs by several organizations. It originated in the manufacturing and factory sectors as way to perform statistically valid quality-assurance testing at a minimum cost [8] . In 1996 the World Health Organization issued a document describing LQAS and recommended it for use in surveys to determine the number of children immunized against disease [9] [10] [11] .
The LQAS, compared to similar sampling techniques like stratified and cluster sampling, provides less information but often requires substantially smaller sample sizes [12] . It involves taking a small random sample from each set of items in the population and testing each sampled item to determine whether it meets a predetermined standard of quality. While LQAS is perceived as fairly quick to carry out, there are ramifications that come with implementing such a quick program. In contrary to using complex surveys, LQAS requires increased amount of time it takes to train interviewers, time interviewers will spend in the field collecting data, and also the time needed to analyse data results in the surveys. Generally, lots serves as a welcome relief should have the same geographic sampling area as the geographic boundaries used for the health program [13] . Surveys that employ LQAS can be used to provide data on health behaviours and health outcomes at the household level. The beauty of LQAs is that these data can be assessed easily at both provincial, county and sub-provincial or sub-county (or district) levels [14] . LQAS is functionally identical to stratified sampling (where each lot is a single stratum) but requires smaller samples because it does not attempt to construct a precise estimate of population parameters. Instead, after sampling, a researcher using LQAS performs a hypothesis test to determine the number of elements of interest in each lot [7] .
In each of the implementing states, a random selection of six (6) LGAs (lots) ―three good performing and 3 poor performing LGAs considered as lots with at least two (2) LGAs from each of the senatorial district in the state; this was done based on the quality of micro planning, team performance, missed households, redemption rates and in-process monitoring data as obtained during the intra-campaign evening review meetings. Using the Probability Proportional to Size and the Table of Random numbers from each of the randomly selected LGA,4 wards were selected as well as one settlement (cluster) from each of the wards, and ten households from each of the settlements. Thus, a total of 240 HHs were selected from 24 settlements (clusters) in 24 wards of six LGAs (lots) from each of the five (5) states that had the campaign. The field officers collected responses from 1200 HHs across the five states that conducted the LLIN campaign. The eligible participants in the survey were caregivers who had at least a child under the age of five years. The demographic and socio-economic profile of the respondents showed 17% (1656) urban, 24% (2338) semi-urban, and 59% (5746) rural. Furthermore, 33% (3214) of the respondents had no formal education while 67% (6526) had formal education.
The research question and hypotheses for the study were:
RQ: What is the correlation between LLIN redemption and LLIN usage?
Ho: There is no significant correlation between LLIN redemption and LLIN usage.
Ha: There is a significant correlation between LLIN redemption and LLIN usage.
The independent variable was LLIN redemption while the dependent variable was LLIN usage. Data collected were double entered, cleaned, crosschecked, and the results analysed using the SPSS version 24. The study conducted correlation and regression analyses, using two-tail hypothesis testing and p-value 0.05 at 95% CI, to see if there was a significant correlation between LLIN redemption and LLIN usage.
3. Results
A total of 9740 eligible persons were interviewed from 1200 HHs across the five states. The descriptive statistics in Table 1 shows the mean values for redemption rate 95.60% (95% CI, 91.60% - 98.79%), retention rate 98.4% (95% CI, 97.0% - 99.8%), hanging rate 82.58% (95% CI, 81.02% - 84.20%), card ownership 83.4% (95% CI, 78.6% - 88.2%), and net usage 71.78% (95% CI, 70.80% - 72.68%). These rates are also displayed in Figures 2-6.
Similarly, and as shown in Figure 7 and Figure 8, the main source of information about the LLIN campaign were the health workers 35.4% (95% CI, 21.8% - 49.0%), and the two predominant reasons across the states for those missing the LLINs were due to team performance 32.2% (95% CI, 26.8% - 37.4%), and net cards not issued 27.4% (95% CI, 23.2% - 32.0%).

Table 1. Descriptive statistics of LLIN redemption, retention, hanging, card ownership and usage.
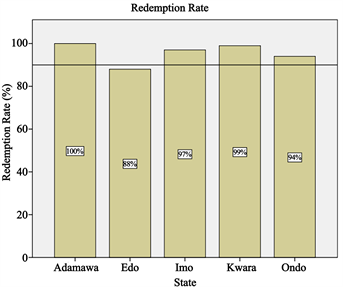
Figure 2. Showing LLIN redemption rates.
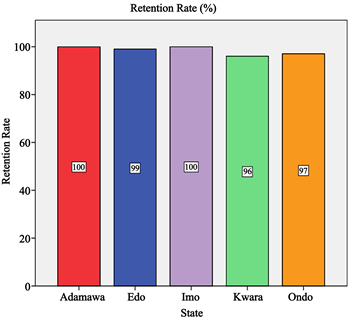
Figure 3. Showing LLIN retention rates.
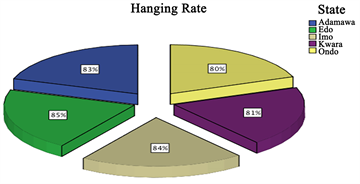
Figure 4. Showing LLIN hanging rates.
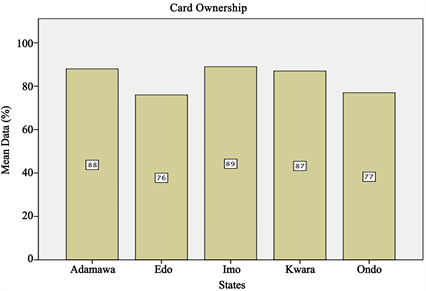
Figure 5. Showing LLIN card ownership.
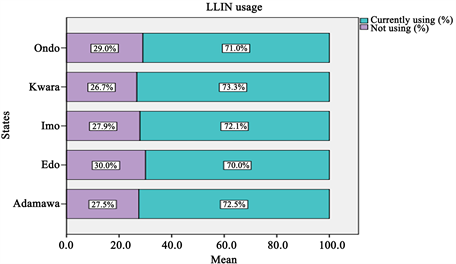
Figure 6. Showing LLIN usage.
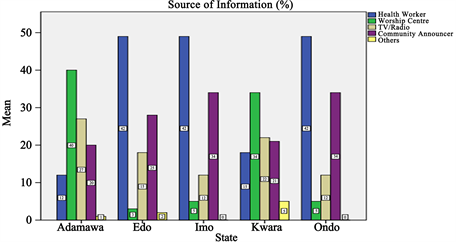
Figure 7. Showing source of information.
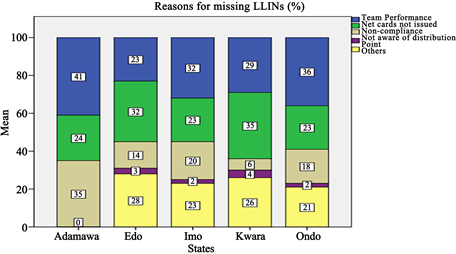
Figure 8. Showing reasons for missing LLINs.
Figure 9 show responses from across the states about their satisfaction during the LLIN campaign. The responses revealed mean satisfaction rate of 74% (95% CI, 72.8% - 75.2%) on how the campaign was conducted leaving a handful 26% (95% CI, 24.8% - 27.2%) not satisfied with the process.
As shown in Tables 2-4, the research looked at the Correlation analysis using 2-tailed test, Regression model to answer the research question and to decide on whether to reject or accept the Null hypothesis, and the ANOVA test to look at the F value. From the analyses, the Pearson correlation (0.942, α 0.017, p < 0.05, 2-tailed test), Regression analysis (R-square 0.888 and Durbin-Watson 2.487), and the ANOVA test (F value of 23.751, α 0.017, p < 0.05), all shows significant relationships between LLIN redemption and LLIN usage with a resultant rejection of the Null Hypothesis.
4. Discussions
The use of LLINs especially in malaria endemic countries is considered as one of the most cost-effective measures towards malaria prevention [1] [2] . This study critically examined the benefits of adopting and scaling up the use of LQAS tool to assess the quality of LLIN campaigns within the shortest possible time to identify post LLIN campaign gaps as done in immunization which will be very helpful in addressing identified gaps promptly. LQAS assessments provide information useful at the community level that is particularly important in an era of increasing decentralization and for programmes with high performance, where attention needs to be focused on identifying areas where the programme is not working well [2] . The findings of this study are comparable to many expensive, time and resources consuming researches whose results may come out too late to be used to correct the gaps identified. Assessments of programme outcomes at a sub-national level would permit programme managers to use results-based information when bringing programmes to scale, as well as to satisfy donor reporting requirements [11] .
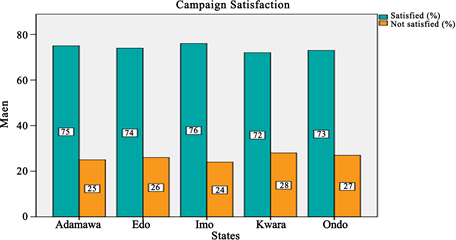
Figure 9. Showing campaign satisfaction.
Table 2. Correlation using 2-tailed test of LLIN redemption and usage.
Table 3. Regression model summaryof LLIN redemption and usage.
Table 4. ANOVA of LLIN redemption and usage.
In this study, the LLINs mean redemption rate, retention rate and card ownership were 95.5% (95% CI, 91.6% - 98.8%), 98.4% (95% CI, 97.0% - 99.8%, and 82.6% (95% CI, 80.0% - 85.5%) respectively which satisfactorily exceeded the set target >80% required for effective vector control in Nigeria [6] . These results are in agreements with other full extensive surveys or studies done in Enugu Nigeria, central India, Ethiopia and Madagascar [15] [16] [17] [18] . The failure to achieve 100% net and card ownership during campaign was due to poor team performance during the micro planning, HH mobilization, and lack of revisit to the missed households.
The LLINs average hanging rate from this study was put at 82.58% (95% CI, 81.02% - 84.20%) which is the same result obtained from wide survey done in Madagascar that reported hanging rate of 84.2% (95% CI, 81.2% - 87.2%) [18] . However, another study documented lower hanging rate of 64.0% which later increased to 68% following post campaign visit [19] . The difference in hanging rates may be attributed to different cultures of LLINs use as well as whether post -campaign visits to the households were done or not [20] .
This study found that only 71.78% (95% CI, 70.80% - 72.68%) ended up using the nets leaving a sizeable 28.22% (95% CI, 27.3% - 29.2%) not using the nets due mainly to skin irritations. In a similar study in Enugu, 65% usage was documented which is close to this finding [15] . However, this finding is different from studies done in India which puts LLINs use at 59.4% but the author agreed that LLIN use varied from 41% to 94% between the studies clusters. In the same studies, 30% of nets owned by the households were out of use which concurred with our 28.22% finding [17] . These figures could reduce further if HH awareness of malaria prevention measures are done in the post campaign period [21] .
Demand creation, which aims at creating awareness on LLINs through available media outlets both pre- and post-campaign, is considered key to the LLINs ownership and use [18] [22] . The use of the LLINs is strongly associated with maternal knowledge and community-level maternal knowledge regarding malaria prevention being received by the caregivers from available community level channels and sources of information which included the health workers [18] [22] [23] . The findings from this study showed that an impressive 91.8% (95% CI, 91.0% - 93.0%) were fully aware of the campaign with a satisfaction rate of 74% (95% CI, 72.8% - 75.2%); these findings were in agreement with a similar study done in Calabar, Nigeria [23] . Still, another study has shown an increase LLIN use among caregivers who had good LLIN knowledge [18] .
As shown in the findings from this study, the main source of information about the LLIN campaign was from the health workers 35.4% (95% CI, 21.8% - 49.0%) as documented in other studies [1] [22] . Thus, there is the need for the malaria community to consider the importance of community outreach, interpersonal communication, and social support on the adoption of net use behaviours when designing future interventions [24] [25] . While the two predominant reasons across the states for missing the LLINs were team performance 32.2% (95% CI, 26.8% - 37.4%) and net cards not issued 27.4% (95% CI, 23.2% - 32.0%), non-compliance was also significantly high in Adamawa state 35% (95% CI, 35% - 35%).
Furthermore, the Pearson correlation (0.942, α 0.017, p < 0.05, 2-tailed test), ANOVA test (F value of 23.751, α 0.017, p < 0.05), and Regression analysis (R-square 0.888 and Durbin-Watson 2.487) have all shown significant correlation between LLIN redemption and LLIN usage; this resulted in the rejection of the Null Hypothesis in favour of the Alternative Hypothesis which states that there is a significant correlation between the two variables.
5. Conclusion
The outcome of this research underscores the need to adopt and scale up the use of the LQAS tool to assess the quality of LLIN campaigns within the shortest possible time since results from this study has further supported this fact especially when compared to other time wasting, expensive robust studies. While the LQAS has been in use by the WHO Expanded Programme on Immunization cluster during polio campaigns, this is the first time that the tool was deployed by the WHO malaria unit as a strategy to identify post LLIN campaign gaps. The scaling up of this strategy would undoubtedly improve LLIN campaigns that would be conducted in the remaining states across the country so as to ensure that Nigeria achieve LLIN universal access in line with the Global Technical Strategy (GTS) framework toward malaria elimination. Thus, future LLIN campaigns should adopt the use of the LQAs as a recommended strategy for the assessment of LLIN interventions in Nigeria especially when prompt response is required to address any identified programme challenges.
Acknowledgements
The lots quality assessment survey (LQAS) conducted by the World Health Organization is part of the Technical Assistance given to the national malaria elimination programme in Nigeria.
We declare that there is no any potential conflict of interest or royalty associated with the manuscript.
We declare that no funding is received from any source for this research.
Cite this paper
Saleh, J.-E.A., Uchenna, A.A., Saddiq, Dr.A., Wondimagegnehu, A., Mpazanje, R. and Audu, Dr.B.M. (2018) Lots Quality Assurance Survey (LQAS) as a Strategy to Achieving Quality LLIN Campaigns: The Nigerian Experience. Open Access Library Journal, 5: e4484. https://doi.org/10.4236/oalib.1104484
References
- 1. Saleh, J.-E.A., Saddiq, A. and Uchenna, A.A. (2018) LLIN Ownership, Utilization, and Malaria Prevalence: An Outlook at the 2015 Nigeria Malaria Indicator Survey. Open Access Library Journal, 5, e4280.
https://doi.org/10.4236/oalib.1104280 - 2. Ntuku, H.M., Ruckstuhl, L., Julo Reminiac, J.-E., et al. (2017) Long-lasting Insecticidal Net (LLIN) Ownership, Use and Cost of Implementation after a Mass Distribution Campaign in Kasai Occidental Province, Democratic Republic of Congo. Malaria Journal, 16, 22.
https://doi.org/10.1186/s12936-016-1671-1 - 3. Kulkarni, M.A., Eng, J.V., Rachelle, E., Desrochers, R.E., et al. (2010) Contribution of Integrated Campaign Dis-tribution of Long-Lasting Insecticidal Nets to Coverage of Target Groups and Total Populations in Malaria-Endemic Areas in Madagascar. The American Journal of Tropical Medicine and Hygiene, 82, 420-425.
https://doi.org/10.4269/ajtmh.2010.09-0597 - 4. FMoH Nigeria (2009) National Malaria Strategic Plan 2009-2013: A Road Map for Malaria Control in Nigeria. NMCP, Abuja.
- 5. RBM (2011) Global Malaria Action Plan. Roll Back Malaria Partnership Secretariat, Geneva, Switzerland.
http://www.unhcr.org/4afac5629.pdf - 6. FMoH Nigeria (2014). National Malaria Strategic Plan 2014-2020: A Road Map for Malaria Control in Nigeria. NMCP, Abuja.
- 7. Robertson, S.E., Anker, M., Roisin, A.J., et al. (1997) The Lot Quality Technique: A Global Review of Applications in the Assessment of Health Services and Disease Surveillance. World Health Statistics Quarterly, 50, 199-209.
- 8. Pagano, M. and Valadez, J.J. (2010) Commentary: Understanding Practical Lot Quality Assurance Sampling. International Journal of Epidemiology, 39, 69-71.
https://doi.org/10.1093/ije/dyp406 - 9. Robertson, S. (1996) Moni-toring Immunization Services Using the Lot Quality Technique. World Health Organi-zation, Geneva.
- 10. Alberti, K.P., Guthmann, J.P., Fermon, F., Grais, R.F., et al. (2008) Use of Lot Quality Assurance Sampling (LQAS) to Estimate Vaccination Coverage Helps Guide Future Vaccination Efforts. Transactions of the Royal Society of Tropical Medicine and Hygiene, 102, 251-254.
https://doi.org/10.1016/j.trstmh.2007.10.015 - 11. Biedron, C., Pagano, M., Hedt, B.L., Valadez, J.J., et al. (2010) An Assessment of Lot Quality Assurance Sampling to Evaluate Malaria Outcome Indicators: Extending Malaria Indicator Surveys. International Journal of Epidemiology, 39, 72-79.
https://doi.org/10.1093/ije/dyp363 - 12. Dodge, H.F., and Romig, H.G. (1929) A Method of Sampling Inspection. Bell System Technical Journal, 8, 613-631.
https://doi.org/10.1002/j.1538-7305.1929.tb01240.x - 13. Facts about Lot Quality Assurance Sampling.
https://www.measureevaluation.org/resources/tools/
fact-sheet-available-on-lot-quality-assurance-sampling - 14. Lemeshow, S. and Taber, S. (1991) Lot Quality Assurance Sampling: Single- and Double-Sampling Plans. World Health Statis-tics Quarterly, 44, 115-132.
- 15. Ogboi, S.J., Akubue, A., Ogundiran, A., Ume, I.A., et al. (2013) Baseline Assessment of Distributed Long Lasting Insecticide-treated Nets (LLINs) and Its Utilization for Malaria Control in Enugu, South East Nigeria. Indian Journals of Applied Research Journals, 3, 11.
- 16. Kamaraju, R., Mehul, K.C., Dipak, K.S., et al. (2017) Monitoring of Long-Lasting Insecticidal Nets (LLINs) Coverage versus Utilization: A Community-Based Survey in Malaria Endemic Villages of Central India. Malaria Journal, 16, 467.
https://doi.org/10.1186/s12936-017-2117-0 - 17. Tassew, A., Hopkins, R. and Deressa, W. (2017) Factors Influencing the Ownership and Utilization of Long-Lasting Insecticidal Nets for Malaria Prevention in Ethiopia. Malaria Journal, 16, 262.
- 18. Finlay, A.M., Butts, J., Ranaivoharimina, H., Cotte, A.H., Vanden, E.J., et al. (2010) Free Mass Distribution of Long Lasting Insecticidal Nets Leads to High Levels of LLIN Access and Use in Madagascar, 2010: A Cross-Sectional Observational Study. PLoS ONE, 12, e0183936.
- 19. Albert, K., Connie, B., Mitra, F., Marc, B., et al. (2015) The Effect of Single or Repeated Home Visits on the Hanging and Use of Insecticide-Treated Mosquito Nets following a Mass Distribution Campaign—A Cluster Randomized, Controlled Trial. PLoS ONE, 10, e0119078.
- 20. Eyong, A.K., Rose, E., Chuku, I. and Peter, O.A. (2016) Assessment of the Utilization of Insecticide Treated Nets (ITNs) in Calabar Metropolis, Cross River State, Nigeria. Journal of Health, Medicine and Nursing, 26, 196-205.
http://www.iiste.org/ - 21. Aklilu, H.W. and Worku, A. (2016) Insecticide-Treated Net Ownership and Utilization and Factors That Influence Their Use in Itang, Gambella Region, Ethiopia: Cross-Sectional Study. Risk Management and Healthcare Policy, 9, 101-112.
- 22. Hmwe, H.K., Katholiki, G., Harry, S.S. and Michael, H.B. (2013) Evaluation of the Association between Long-Lasting Insecticidal Nets Mass Distribution Campaigns and Child Malaria in Nigeria. Malaria Journal, 12, 14.
https://doi.org/10.1186/1475-2875-12-14 - 23. Ankomah, A., Adebayo, S.B., Arogundade, E.D., Meremiku, M., et al. (2014) The Effect of Mass Media Campaign on the Use of Insecticide-Treated Bed Nets among Pregnant Women in Ni-geria. Malaria Research and Treatment, 2014, Article ID: 694863.
- 24. Saleh, J.-E.A., Wondimagegnehu, A., Mpazanje, R., Abdullahi, S., et al. (2017) Investigation of a Suspected Malaria Outbreak in Sokoto State, Nigeria, 2016. Open Access Library Journal, 4, e4246.
- 25. Russell, C.L., Sallau, A., Emukah, E., et al. (2015) Determinants of Bed Net Use in Southeast Nigeria Following Mass Distribution of LLINs: Implications for Social Behavior Change Interventions. PLoS ONE, 10, e0139447.