Journal of Geoscience and Environment Protection
Vol.06 No.03(2018), Article ID:83541,12 pages
10.4236/gep.2018.63006
Assessment of Environmental Carrying Capacity Using Principal Component Analysis
Yinge Liu, Junhui Zhang, Shaoxiong Wang, Yan Wang, Aling Zhao
Key Laboratory of Disaster Monitoring and Mechanism Simulating in Shaanxi Province, College of Geography and Environment, Baoji University of Arts and Sciences, Baoji, China
![]()


Received: February 27, 2018; Accepted: March 29, 2018; Published: April 2, 2018
ABSTRACT
Regional environmental carrying capacity (ECC) is nonlinear and spatially specific. A hierarchy index system including resources, environmental and socio-economic elements was established using an analytic hierarchy process. Principal component analysis (PCA) was used to estimate the regional size and differences of environmental carrying capacities. Main information of four principal components, i.e., carrying capacity of resources supply, carrying capacity of environmental quality, carrying capacity of social economy and carrying capacity of infrastructure construction, was extracted. The ECC evaluation value was divided into five levels of lowest carrying capacity, low carrying capacity, medium carrying capacity, high carrying capacity and highest carrying capacity, respectively. The results showed that on the whole ECC was at the medium carrying capacity level. ECC was generally highest in Guanzhong plain, followed by Loess Plateau, and was lowest in Qiba mountain. The carrying capacity of water resources and environmental quality was relatively low, and the infrastructure carrying capacity was highest among the four components. The temporal spatial variation of ECC was closely related to vulnerability of the natural resources and environment in the regions. Verification was proven that PCA was a useful tool when applied to evaluate ECC and reflect the spatial distribution of large-quantity ECC indices on a large regional scale. This study provides a basis for comprehensive understanding of resources, environment and management for regional balanced development.
Keywords:
Environmental Carrying Capacity, Principal Component Analysis, Spatial Difference, Evaluation of Indicators

1. Introduction
Resources and the environment are the basis of human survival. Rapid social and economic development has brought issues of resources and environment, such as excessive resources consumption, environmental degradation and pollution, and the issues have become increasingly prominent especially across the globe[1]-[3].Therefore, resource and environment carrying capacity has become a great concern of research interest. Environmental carrying capacity includes multiple factors such as atmospheric environment, land environment, social economy and dilution-related self-purification capacity of water environment, and reflects the threshold of supporting capacity in a region with specific natural resources and ecological environment. Studies on environmental carrying capacity are mainly focused on single factors, such as spatial variation of comprehensive carrying capacity in China [4] [5], different resource carrying capacities of cities [6] [7] [8], change characteristics of ecosystems carrying capacity [9] [10] [11] [12], variation of carrying capacity of resources and environment in mountain areas [13], water resources carrying capacity [14] [15] [16] and regional land resources carrying capacity [17] [18]. Those studies indicated that environmental degradation, resource exploitation and utilization have caused seriously adverse effects on ecological environment, and resource and environment carrying capacity has been substantially reduced. Currently, methods used for studying resource and environment carrying capacity include the system dynamics model, the ecological footprint method, the analytic hierarchy process and the entropy method [19]-[24]. Although extensive work with different methods has been carried out on resource and environment carrying capacity, there are several limitations and an integrated ECC assessment is still lacking. Therefore, this study takes Shaanxi Province as an example, using PCA to establish a comprehensive ECC system to analyze spatial distribution of ECC in Shaanxi Province. This study is expected to better explain the relationship between the regional resource environment and the coordinated development of social economy, more effectively guide the regional planning and layout decision-making, and promote a more balanced and sustainable regional development.
2. Materials and Methods
2.1. Materials
Shaanxi is located in the northwest hinterland of China’s inland, 870-km long along the north-south direction, 200 to 500-km wide along the east-west direction, across the two regions of Northern and Southern China. The terrain is high in the north and south, and low in the middle. The terrain is divided into three sections; namely, northern Loess Plateau (including Yan’an, Yulin), Guanzhong plain (including Xi'an, Xianyang, Baoji, Weinan, Tongchuan) and southern Qinba mountain (including Hanzhong, Ankang, Shangluo). Spatial and temporal distribution of water resources and fossil energy are not uniform in Shaanxi Province. With the population growth and increase of energy production, environmental pollution and other issues, the scarce resources and fragile environment are facing great pressure. Meanwhile, strong anthropogenic activities have led to over-exploitation of the resources and environment beyond the regional resource and environmental carrying capacity. Limited resources and serious environmental problems have become a key factor restricting the development of regional economy. Therefore, the study of environmental carrying capacity in Shaanxi Province is typical in arid regions of Northwest China. The social, economic and environmental data used in this paper were obtained from local Hydrology and Water Resources Survey, Land and Resources Bureau, Environmental Protection Agency and State Statistics Bureau in shaanxi province, China. Samples from eleven regions were selected, using the digital elevation model (DEM) data of China, and the 1:250,000 county-level area vector of landform and terrain elevation of Shaanxi Province were obtained with ArsGIS as shown in (Figure 1).
2.2. Methods
Given that environmental carrying capacity is multi-element driven and affected, we employed PCA to accurately calculate complex variables. PCA is one of multivariate statistical analysis methods. It can simplify complex issues by transforming the data matrix to a limited number of variables and explain the interrelationship among the multiple variables. The main purpose of PCA is data compression in which dimension reduction and statistical simplification are achieved to facilitate data. When PCA is performed, the first principal component is extracted in such a way that it can account for as much of the whole variance as possible, and the second principal component may account as much of

Figure 1. Landform and sample points in Shaanxi province.
the remaining variance as possible, and so forth. The number of principal components selected to represent the data set is chosen in such a way that all the selected principal components must accumulatively account for at least 85% of the total variance in the data set.
Firstly, PCA was to calculate the correlation coefficients between each pair of indices. Secondly, the eigenvalues and eigenvectors were calculated. Principal component percent contributions and cumulative percent contributions in the total variance as well as principal component loads were calculated. The percent variance contribution of the principal component was taken as the weight coefficients of the each principal component. Finally, the index of each principal component was calculated according to the standardized principal component load, and the carrying capacity of the environment was evaluated according to the index. The main calculation steps are as follows.
1) Establish the covariance matrix (correlation coefficient matrix)
If the number of the sample regions is M and the number of selected normalization indices is N, the covariance matrix R can be established (Equation (1)),
(1)
where represents regression coefficients.
2) Calculate the percent variance contribution of each principal component (weight) as shown by Equation (2),
(2)
where is percent variance contribution by each identified principal component, and represents the ith normalization sample. represents the jth eigenvalue of matrix R.
3) Calculate the component load matrix (score index matrix) according to Equation (3),
(3)
where is the nth principal component load of the ith area, and represents normalization samples.
4) Calculate the comprehensive evaluation index ( ) according to Equation (4),
(4)
2.3. Evaluation Index Systems
The establishment of a scientific valuation index system of ECC should take into account its objectiveness, comprehensiveness and accessibility. Multiple aspects of environment and social economy all have a strong influence on the carrying capacity. Therefore, we took into account the actual situation and relevant studies reported previously and selected twenty indicators to establish the evaluation indexes system using the analytic hierarchy process, in which three systems comprised of target and index layers of resources, environment, social and economic aspects were included (Table 1). Among them, the resource system consisted of eight indicators covering both natural and social aspects including energy, water, land and human resources, the environmental system consisted of seven indicators related to atmospheric environment, water and solid waste, and the socio-economic system consisted of five indicators including economic data, the regional infrastructure construction data and social development data.
3. Results
3.1. Principal Component Analysis
The first four principal components (C1-C4) of PCA explained more than 85% of the total variance in the data set. The load matrix and coefficient matrix of C1-C4 are shown in (Table 2), and percent variance explained by C1-C4 is listed in (Table 3). Among the four principal components of ECC, the principal component load information extracted by each group of data has the same consistency.

Table 1. Evaluation index system of environmental carrying capacity.
Table 2. Load and coefficient of principal components of ECC.
Table 3. Total variance index of principal component of ECC.
Therefore, the same principal component of different years can be compared and analyzed. As shown in (Table 2), the total amount of water supply, natural gas supply and resident population in the first principal component, which was defined as the carrying capacity of resources supply, was relatively high. The comprehensive utilization of industrial solid wastes, the total emission of industrial waste gas, and the emission of smoke and soot in the second principal component was defined as the carrying capacity of environmental quality. The sum of the per capita GDP, the sunshine hours and the cumulative load of soil erosion control area in the third principal component was defined as the level of socio-economic carrying capacity. The sum of the waste water treatment facilities in the fourth principal component was defined as the carrying capacity of infrastructure construction. This study employed the natural discontinuity classification method, and the differences between the various classes may be maximized. Based on this method, therefore ECC was divided into five levels: lowest carrying capacity, low carrying capacity, medium carrying capacity, high carrying capacity and highest carrying capacity.
The resources supply carrying capacity of ECC represents limiting the degree of local sustainable development of carry capacity. As shown in (Figure 2), Xi’an had the highest resources supply capacity of ECC among all the investigated regions during the six years, and Hanzhong had the smallest supply capacity of ECC. In general, Guanzhong plain had the highest carrying capacity, followed by Loess Plateau at the medium level, while the lowest carrying capacity was identified in Qinba mountain.
Environmental quality bearing capacity of ECC indicates the extent of environmental pollution, environmental management and environmental quality during local sustainable development. It can be seen from (Figure 3), the cities in the central plain were basically between the medium carrying capacity levels. The environmental quality of Ankang and Shangluo in the south of Shaanxi Province was lowest and the smallest index was 0.14 - 0.178 in 2010 and 2013, but Hanzhong had a high index.
Socio-economic carrying capacity of ECC indicates the upper limit a sustainably developed social economy may reach. It can be seen from (Figure 4), that Yulin and Yan’an in northern Shaanxi showed high loads of carrying capacity due to energy and chemical industry (e.g., Coal, liquefied gas industry) except 2012 and the greatest index was 0.44. The cities in southern Shaanxi were primarily carrying capacity of low level and index was 0.244, except Hanzhong and Sangluo had higher level in 2012 and 2013. Guanzhong region showed high-level or medium-level carrying capacities in those years.
The carrying capacity of infrastructure construction of ECC may help tell whether the infrastructure construction is efficiently used. As shown in (Figure 5), index of the social infrastructure construction was the largest in Baoji and
![]()
![]()
![]()
![]()
![]()
![]()
Figure 2. Spatial distribution of resource supply carrying capacity indices.


Figure 3. Spatial distribution of environmental quality carrying capacity indices.

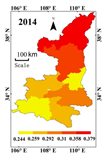


Figure 4. Spatial distribution of socio-economic carrying capacity of ECC.


Figure 5. Spatial distribution of infrastructure construction carrying capacity of ECC.
Xianyang, the carrying capacity of Xi’an changed between the high and low levels but was mostly near the medium level. On the whole, the index of infrastructure construction is higher than that of other carrying capacity. The distribution of comprehensive carrying capacity of ECC in each year is shown in (Figure 6). As can be seen that Xi’an and Yulin had the highest 6-year comprehensive carrying capacity among all the investigated cities, except Yulin in 2010. Ankang was at the low level. As shown in (Figure 7), the average resources supply of ECC was highest in Xi’an, and was lowest in Qinba mountain. The average carrying capacity of environmental quality was highest in Weinan and Yulin, and lowest in Yan’an. The average carrying capacity of socio-economic level was highest in northern and lowest in Weinan. The average carrying capacity of infrastructure construction performance was highest in Xianyang and lowest in Tongchuan. The comprehensive carrying capacity was highest in Xi’an and lowest in Ankang. On the whole, ECC was highest in Guanzhong Plain, medium in Loess Plateau of northern Shaanxi Province and lowest in Southern mountainous. It can be seen from (Figure 8), resources and environmental quality carrying capacity indices were relatively low showing a fluctuating trend. Economic and infrastructure construction carrying capacity of ECC were relatively high showing an increasing trend. It indicated that resource and environmental protection capacity were relatively fragile in those regions, but the infrastructure and the economy were in a good status.
As shown in (Figure 9), the comprehensive environmental carrying capacity was fluctuating and showed an increasing trend which indicated a medium level. To verify the above assessment results, we selected three main factors from actual monitoring data and illustrated their changes in (Figure 10). By comparison,


Figure 6. Spatial distribution of integrated environmental carrying capacity in 2010-2015.


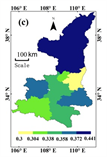


Figure 7. Spatial distribution ofaverage environmental carrying capacity indices (a) resource supply, (b) environmental quality, (c) social economy, (d) infrastructure construction, (e) integrated.

Figure 8. Time variation of four carrying capacity indices.

Figure 9. Time change of comprehensive environmental carrying capacity indices.


Figure 10. Index changes of water supply, cultivated land area and industrial emissions.
it can be found that the assessment results were generally consistent with the spatial distribution of the actual situation. The northern and central regions had high environmental carrying capacities while the southern regions had low environmental carrying capacities, and the overall ECC trend was consistent with the changes of the actual environmental elements.
4. Discussion
Previous studies [19], [23] indicated that comprehensive index evaluation model reported high ecological environment sensitivity and low resource carrying capacity. This study showed that the distribution of ECC in Shaanxi was affected by many factors. The environmental quality of ECC was affected by the degree of environmental protection and pollution control, and the level of economic, industrial and technological development. Terrain affects the size of resources supply. Climate change and water shortage lead to poor environmental quality and low ECC. Shaanxi's socio-economic level is determined primarily by the development of secondary and tertiary industries, and the population density also affects the magnitude of the regional socio-economic carrying capacity. On the whole, the change of environmental carrying capacity is affected by fragility of the natural environment and the destabilization of economic development. The results in this study showed that the spatial distribution of environmental carrying capacity was continuous and gradual. The results also showed that the method of PCA is a simple, easy-to-use method to evaluate the environmental carrying capacity without the interference from human factors in the index information, rendering the quantification of assessment indices objective. The PCA method can be used to extract large amount of information from regional multi-factor environment data set and evaluate environmental carrying capacities on a large regional scale.
5. Conclusion
This study demonstrates that PCA is simple, easy to use, and advantageous when applied to multi-index valuation of ECC on a large regional scale. The assessment results show that ECC was at the medium level in Shaanxi Province. The spatial distribution of ECC was different in different regions. ECC was highest in Guanzhong plain, followed by Loess Plateau and lowest in Qinba mountain. The infrastructure carrying capacity was highest followed by the socio-economic carrying capacity, while resources supply and environmental quality carrying capacity was relatively low. The spatial distribution of ECC was closely related to vulnerability of natural geography, resource distribution, environmental protection, and development of energy economy. Therefore, the improvement of environmental quality and resource utilization efficiency in a region would increase the environmental carrying capacity.
Acknowledgements
This work was supported by National Natural Science Foundation Project of China (41771048), National Social Science Foundation Project of China (15XZZ012), Key Laboratory Foundation Project of Shaanxi Province (13JS010), Arts and Science Project of Baoji University (ZK16061) and Geography Key Discipline Project.
Cite this paper
Liu, Y.G., Zhang, J.H., Wang, S.X., Wang, Y. and Zhao, A.L. (2018) Assessment of Environmental Carrying Capacity Using Principal Component Analysis. Journal of Geoscience and Environment Protection, 6, 54-65. https://doi.org/10.4236/gep.2018.63006
References
- 1. Liu, Y.G., Wang, N.L., Wang, L.G., et al. (2013) Application of GIS in Regional Ecological Risk Assessment of Water Resources. Environmental Engineering and Management Journal, 12, 1465-1474.
- 2. Liu, Y.G., Yang, Y.X. and Xu, C. (2015) Risk Evaluation of Water Pollution in the Middle Catchments of Weihe River. Journal of Residuals Science & Technology, 12, 133-136.
- 3. Jameson, S.C. and Ammar, M.S.A. (2007) A Quantitative Ecological Assessment of Diving Sites in the Egyptian Red Sea during a Period of Severe Anchor Damage: A Baseline for Restoration and Sustainable Tourism Management. Journal of Sustainable Tourism, 15, 309-322.
- 4. Chen, X.Q. and Xia, F. (2011) Dynamic Evaluation and Comparison on Resources and Environment Comprehensive Carrying Capacity on Six provinces in central China. Social Sciences in Hunan, 1, 106-109.
- 5. Zhou, K. and Fan, J. (2015) Characteristics and Influence Factors of Resources and Environment Carrying Capacity in Underdeveloped Areas of China. Geographical Research, 34, 39-52.
- 6. Chen, H.B. and Liu, Y.Y. (2013) The Space Difference of City Resource Environmental Bearing Capacity in Jiangsu Province. Urban Problems, 3, 33-37.
- 7. Liu, X.L. and Fang, C.L. (2008) Progress and Prospect of Study on Carrying Capacity of Resource and Environment of City Cluster. Progress in Geography, 27, 35-42.
- 8. Huang, J.J., Jiang, S. and Zhang, L. (2015) Establishment of Evaluation Index System of Resource Environmental Carrying Capacity in Urban Planning Area. China Population Resources and Environment, 25, 204-208.
- 9. Del Monte-Luna, P., Brook, B.W., Zetina-Rejo, M.J., et al. (2004) The Carrying Capacity of Ecosystems. Global Ecology and Biogeography, 13, 485-495. https://doi.org/10.1111/j.1466-822X.2004.00131.x
- 10. Guo, K. and Wang, L.Q. (2015) Change of Resource Environmental Bearing Capacity of Beijing-Tianjin-Hebei Region and Its Driving Factors. Journal of Applied Ecology, 26, 3818-3826.
- 11. Hui, C. (2006) Carrying Capacity, Population Equilibrium, and Environment’s Maximal Load. Ecological Modelling, 192, 317-320. https://doi.org/10.1016/j.ecolmodel.2005.07.001
- 12. Deng, W. (2010) Discussion on Mountain Area Resource and Environment Carrying Capacity. Geographical Research, 29, 959-969.
- 13. Li, Q.L. and Zhang, H.Z. (2004) Water Environmental Carrying Capacity and the Affecting Factors. Hebei Journal of Industrial Science and Technology, 21, 30-33.
- 14. Song, L. and Xiao, P. (2013) Car-rying Capacity of Water Leisure Environment in Eco-cities-A Case Study of Ancient Canal Scenic Area in Yangzhou City. Journal of Landscape Research. Journal of Landscape Research, 5, 31-34.
- 15. Wang, S., Xu, L., Yang, F. and Wang, H. (2013) Assessment of Water Ecological Carrying Capacity under the Two Policies in Tieling City on the Basis of the Integrated System Dynamics Model. Science of the Total Environment, 472C, 1070-1081.
- 16. Zhu, Y., Drake, S., Lv, H. and Xia, J. (2010) Analysis of Temporal and Spatial Differences in Eco-Environmental Carrying Capacity Related to Water in the Haihe River Basins, China. Water Resources Management, 24, 1089-1105. https://doi.org/10.1007/s11269-009-9487-1
- 17. Liu, Y.G., Shi, P.Y. and Zhang, Y. (2015b) Risk Assessment on Pollution of River Water Quality in Shaanxi Section of Weihe River. Journal of Water Resources & Water Engineering, 26, 51-54.
- 18. Bendewald, M. and Zhai, Z.Q. (2013) Using Carrying Capacity as a Baseline for Building Sustainability Assessment. Habitat International, 37, 22-32. https://doi.org/10.1016/j.habitatint.2011.12.021
- 19. Ye, M.X. and Luo, G.Y. (2009) The Empirical Analysis on Resource Environmental Bearing Capacity of the Upper Reaches of the Yangtze River. East China Economic Management, 23, 1-4.
- 20. Zhang, Y., Xu, J.H., Zeng, G. and Hu, Q. (2009) The Spatial Relationship between Regional Development Potential and Resource &Environment Carrying Capacity. Resources Science, 31, 1328-1334.
- 21. Huang, Q.X. (2009) Assessment Method and Indexes System of Resources and Environment Carrying Capacity in Mining Areas. Mining Research and Development, 29, 62-64, 84.
- 22. Widodo, B., Lupyanto, R., Sulistiono, B., Harjito, D.A. and Hamidin, J. (2015) Analysis of Environmental Carrying Capacity for the Development of Sustainable Settlement in Yogyakarta Urban Area. Procedia Environmental Sciences, 28, 519-527. https://doi.org/10.1016/j.proenv.2015.07.062
- 23. Wu, H., Chakraborty, A., Li, B. and Kenerley, C.M. (2009) Formulating Variable Carrying Capacity by Exploring a Resource Dynamics-Based Feedback Mechanism Underlying the Population Growth Models. Ecological Complexity, 6, 403-412. https://doi.org/10.1016/j.ecocom.2008.11.002
- 24. Hu, M. and Liu, X.Y. (2013) Comprehensive Evaluation on the Resources and Environment Carrying Capacity Based on the Analytic Hierarchy Process on the Cities in Jiangsu Province. Economic Research Guide, 35, 101-104.