 Journal of Environmental Protection, 2011, 2, 1211-1217 doi:10.4236/jep.2011.29139 Published Online November 2011 (http://www.scirp.org/journal/jep) Copyright © 2011 SciRes. JEP Preservation Artifacts and Loss Pattern of Arsenic: A Case Study from Highly Contaminated Location in Central-East India Piyush Kant Pandey1, Hansa Zankyani2, Madhurima Pandey2 1Bhilai Institute of Technology, Kendri, New Raipur (Chhattisgarh), India; 2Centre for Environmental Science & Engineering, De- partment of Engineering Chemistry, Bhilai Institute of Technology, Durg (Chhattisgarh), India. Email: {drpiyush_pandey, hansa_zankyani, drmadhurima_pandey}@yahoo.com Received August 14th, 2011; revised September 26th, 2011; accepted November 2nd, 2011. ABSTRACT Arsenic is the focus of public attention because of its wider prevalence and toxicity. Proper sampling is important in characterizing toxic water contaminants in the groundwater. The present paper studies aspects of sampling, preserva- tion artifacts, analytical issues etc. in a natural arsenic contaminated groundwater. The samples were collected from arsenic contaminated groundwater at three locations of village Kaudikasa in Rajnandgaon (Chhattisgarh). The stan- dard method of samp ling and preservation of arsenic was examined. The permitted sample holding time in this state is 180 days which has been found to be unrealistic on examination. The communication also compares the loss pattern of arsenic in unpreserved samples with samples preserved and kept at 4˚C. It was found that about As losses dur ing hold- ing after preservation were about 0% in one day, 35% in seven day, 70% in fifteen day, and 65% in thirty days time. Hence, the present recommended method of preservation leads to huge under reporting of As in natural samples. If the pattern of losses observed at the present location exists at other locations then the actual As levels could be much higher than the reported ones. Keywords: Arsenic, Groundwater Contamination, Preservation, Loss Pattern, Chhattisgarh 1. Introduction Arsenic is one of the oldest poisons known to men and its applications throughout history are wide and varied [1]. Arsenic is a problematic and naturally occurring toxic contaminant, which has many chemical species, each with a different toxicity and mobility [2]. A recent study on arsenic toxicity have shown that exposure to arsenic through drinking water has direct effect on the early stages of life when the brain is usually most vul- nerable [3]. Yu Chen and colleagues add to the evidence that arsenic in water increases mortality from cardiovas- cular disease with the findings of their prospective cohort study in Bangladesh [4]. Ingestion of inorganic arsenic in drinking water causes cancer of the skin, bladder, lung, liver, and kidney [5]. Inorganic arsenic species arsenite [As(III)] and arsenate [As(V)] predominate in natural water [6]. Organic arsenic species, such as monomethyl arsonate (MMA) and dimethyl arsinate (DMA), are only present at low levels [7]. Inorganic arsenic species in- clude known carcinogens [8]. Of these, As(III) is more toxic than As(V), while the toxicities of the organic arse- nic species have not been fully evaluated [9-11]. Arsenic contamination in groundwater and related diseases affect major parts of Ganga delta down stream of Rajmahal hills in West Bengal, India and other low lying areas in Bangladesh [12-16]. Alluvial areas from USA, Hungary, China, Taiwan and Vietnam are also similarly affected [17-19]. The problem has also been reported from Kaudi- kasa, district Rajnandg aon, Chhattisg arh [20-23]. Daus et al. (2002) used nitrilotriacetic acid (NTA), hydrochloric acid (HCl), phosphoric acid (H3PO4), and acetic acid for this procedure [24], and found the best results with 0.01 mol/L H3PO4. A detailed description of the preservation and sampling of groundwater was given in our previous publication [25]. This paper further studies the implica- tions and reports arsenic losses in preserved groundwater samples. Bednar et al. used ethylenedinitrilotetraacetic acid (EDTA), sulfuric acid (H2SO4), nitric acid (HNO3), and HCl to preserve inorganic arsenic species in ground- water and acid mine drainage samples [26]. Arsenic con- tamination has been acknowledged as a major public 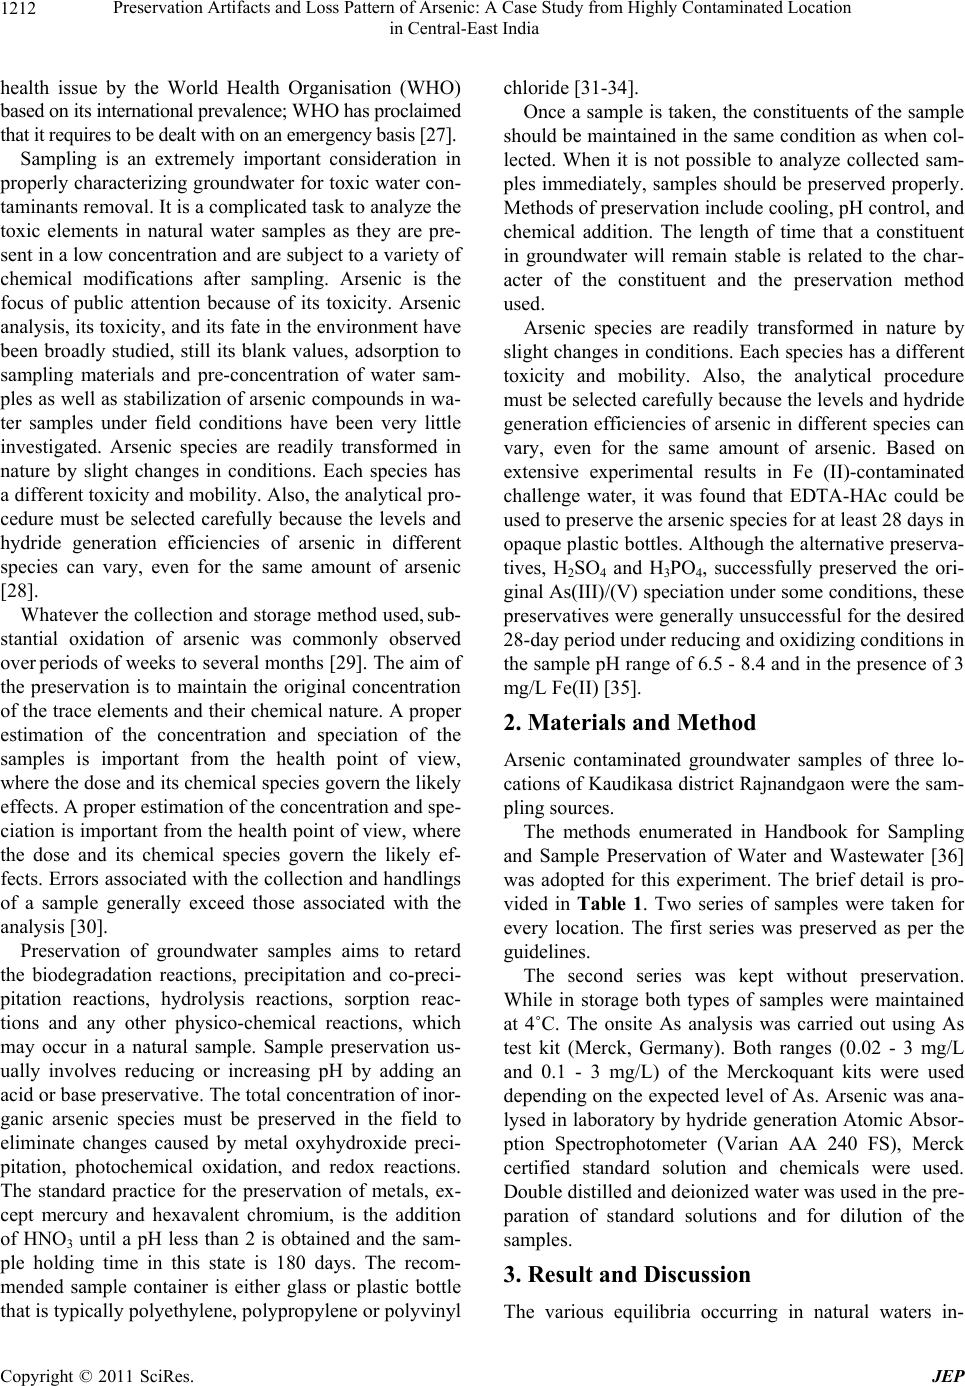 Preservation Artifacts and Loss Pattern of Arsenic: A Case Study from Highly Contaminated Location 1212 in Central-East India health issue by the World Health Organisation (WHO) based on its international prevalence; WHO has proclaimed that it requires to be dealt with on an emergency basis [27]. Sampling is an extremely important consideration in properly characterizing groundwater for toxic water con- taminants removal. It is a complicated task to analyze the toxic elements in natural water samples as they are pre- sent in a low co ncen tration and a re subj ect to a var iety of chemical modifications after sampling. Arsenic is the focus of public attention because of its toxicity. Arsenic analysis, its toxicity, and its fate in th e environment have been broadly studied, still its blank values, adsorption to sampling materials and pre-concentration of water sam- ples as well as stabilization of arsenic compounds in wa- ter samples under field conditions have been very little investigated. Arsenic species are readily transformed in nature by slight changes in conditions. Each species has a different toxicity and mobility. Also, the analytical p ro- cedure must be selected carefully because the levels and hydride generation efficiencies of arsenic in different species can vary, even for the same amount of arsenic [28]. Whatever the collection and storage method used, sub- stantial oxidation of arsenic was commonly observed over periods of weeks to several months [29]. The aim of the preservation is to maintain the original concentration of the trace elements and their chemical nature. A proper estimation of the concentration and speciation of the samples is important from the health point of view, where the dose and its chemical species govern the likely effects. A proper estimation of the concentration and spe- ciation is important from the health point of v iew, where the dose and its chemical species govern the likely ef- fects. Errors associated with the collection and handlings of a sample generally exceed those associated with the analysis [30]. Preservation of groundwater samples aims to retard the biodegradation reactions, precipitation and co-preci- pitation reactions, hydrolysis reactions, sorption reac- tions and any other physico-chemical reactions, which may occur in a natural sample. Sample preservation us- ually involves reducing or increasing pH by adding an acid or base preservative. Th e total conc entratio n of inor- ganic arsenic species must be preserved in the field to eliminate changes caused by metal oxyhydroxide preci- pitation, photochemical oxidation, and redox reactions. The standard practice for the preservation of metals, ex- cept mercury and hexavalent chromium, is the addition of HNO3 until a pH less than 2 is obtained and the sam- ple holding time in this state is 180 days. The recom- mended sample container is either glass or plastic bottle that is typically polyethylene, polypropylene or polyvinyl chloride [31-34]. Once a sample is taken, the constituen ts of the sample should be maintained in the same condition as when col- lected. When it is not possible to analyze collected sam- ples immediately, samples should be preserved properly. Methods of preserva tion include cooling , pH control, and chemical addition. The length of time that a constituent in groundwater will remain stable is related to the char- acter of the constituent and the preservation method used. Arsenic species are readily transformed in nature by slight changes in conditions. Each species has a different toxicity and mobility. Also, the analytical procedure must be selected carefully because the levels and hydride generation efficiencies of arsenic in different species can vary, even for the same amount of arsenic. Based on extensive experimental results in Fe (II)-contaminated challenge water, it was found that EDTA-HAc could be used to preserve the arsenic species for at least 28 days in opaque plastic bottles. Although th e alternative preserva- tives, H2SO4 and H3PO4, successfully preserved the ori- ginal As(III)/(V) speciation under some conditions, these preservatives were generally unsuccessful for the desired 28-day period under reducing and oxidizing conditions in the sample pH range of 6.5 - 8.4 and in the presence of 3 mg/L Fe(II) [35]. 2. Materials and Method Arsenic contaminated groundwater samples of three lo- cations of Kaudikasa district Rajnandgaon were the sam- pling sources. The methods enumerated in Handbook for Sampling and Sample Preservation of Water and Wastewater [36] was adopted for this experiment. The brief detail is pro- vided in Table 1. Two series of samples were taken for every location. The first series was preserved as per the guidelines. The second series was kept without preservation. While in storage both types of samples were maintained at 4˚C. The onsite As analysis was carried out using As test kit (Merck, Germany). Both ranges (0.02 - 3 mg/L and 0.1 - 3 mg/L) of the Merckoquant kits were used depending on the expected level of As. Arsenic was ana- lysed in laboratory by hydride generation Atomic Absor- ption Spectrophotometer (Varian AA 240 FS), Merck certified standard solution and chemicals were used. Double distilled and deionized water was u sed in the pre- paration of standard solutions and for dilution of the samples. 3. Result and Discussion The various equilibria occurring in natural waters in- C opyright © 2011 SciRes. JEP 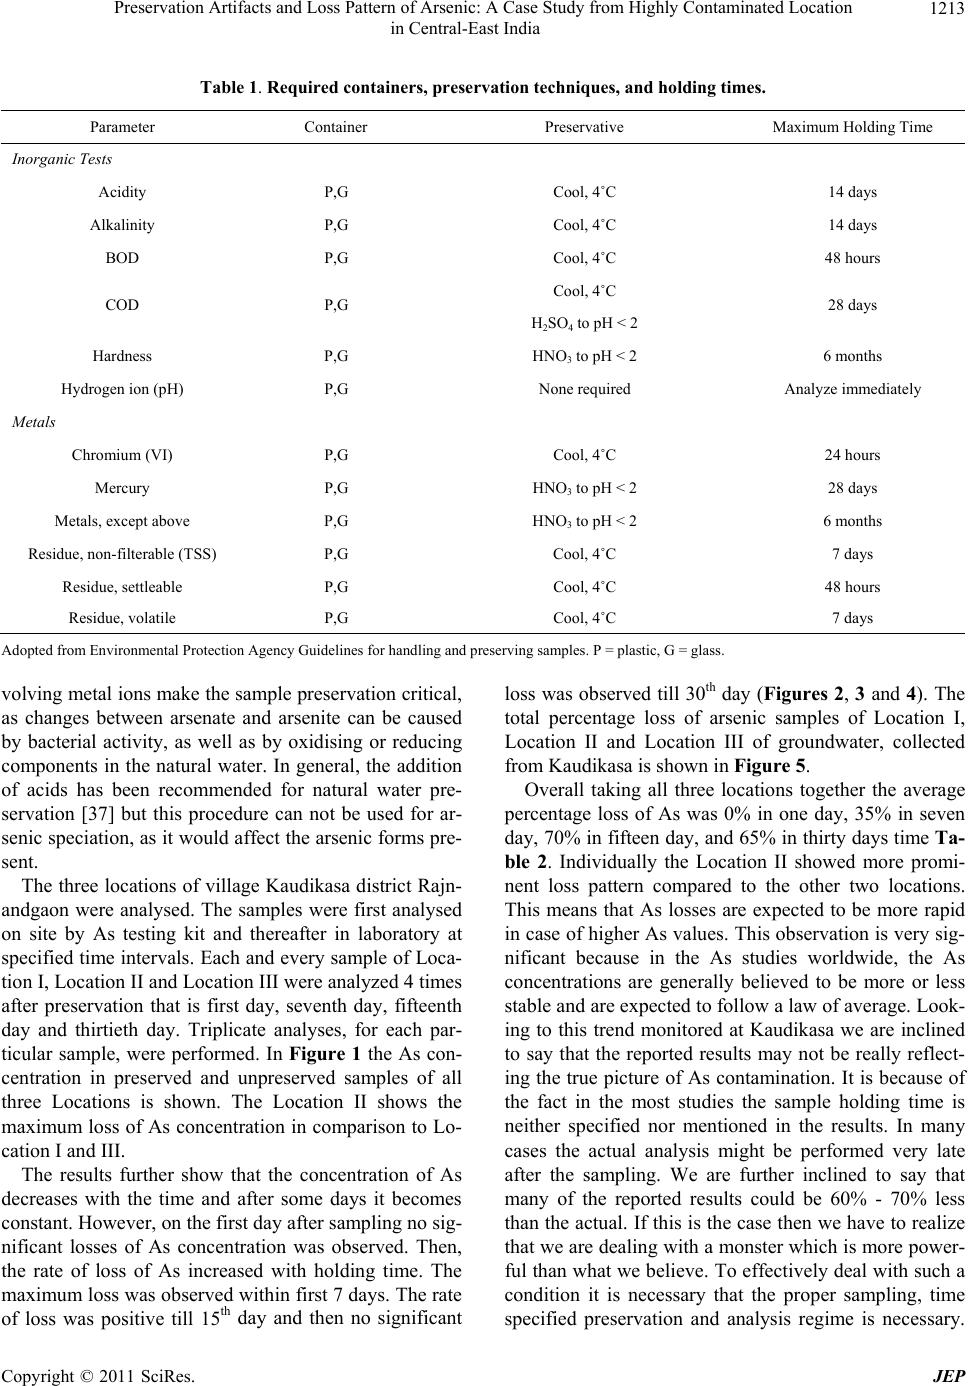 Preservation Artifacts and Loss Pattern of Arsenic: A Case Study from Highly Contaminated Location in Central-East India Copyright © 2011 SciRes. JEP 1213 Table 1. Required containers, preservation techniques, and holding times. Parameter Container Preservative Max i mum Holding Time Inorganic Tests Acidity P,G Cool, 4˚C 14 days Alkalinity P,G Cool, 4˚C 14 days BOD P,G Cool, 4˚C 48 hours Cool, 4˚C COD P,G H2SO4 to pH < 2 28 days Hardness P,G HNO3 to pH < 2 6 months Hydrogen ion (pH) P,G None required Analyze immediately Metals Chromium (VI) P,G Cool, 4˚C 24 hours Mercury P,G HNO3 to pH < 2 28 days Metals, except above P,G HNO3 to pH < 2 6 months Residue, non-filterable (TSS) P,G Cool, 4˚C 7 days Residue, settleable P,G Cool, 4˚C 48 hours Residue, volatile P,G Cool, 4˚C 7 days Adopted from Environmental Protection Agency Guidelines for handling and preserving samples. P = plastic, G = glass. volving metal ions make the sample preservation critical, as changes between arsenate and arsenite can be caused by bacterial activity, as well as by oxidising or reducing components in the natural water. In general, the addition of acids has been recommended for natural water pre- servation [37] but this procedure can not be used for ar- senic speciation, as it would affect the arsenic forms pre- sent. The three locations of village Kaudikasa district Rajn- andgaon were analysed. The samples were first analysed on site by As testing kit and thereafter in laboratory at specified time intervals. Each and every sample of Loca- tion I, Location II and Location III were analyzed 4 times after preservation that is first day, seventh day, fifteenth day and thirtieth day. Triplicate analyses, for each par- ticular sample, were performed. In Figure 1 the As con- centration in preserved and unpreserved samples of all three Locations is shown. The Location II shows the maximum loss of As concentration in comparison to Lo- cation I and III. The results further show that the concentration of As decreases with the time and after some days it becomes constant. However, on the first day after sampling no sig- nificant losses of As concentration was observed. Then, the rate of loss of As increased with holding time. The maximum loss was observed within first 7 days. The rate of loss was positive till 15th day and then no significant loss was observed till 30th day (Figures 2, 3 and 4). The total percentage loss of arsenic samples of Location I, Location II and Location III of groundwater, collected from Kaudikasa is shown in Figure 5. Overall taking all three locations together the average percentage loss of As was 0% in one day, 35% in seven day, 70% in fifteen day, and 65% in thirty days time Ta- ble 2. Individually the Location II showed more promi- nent loss pattern compared to the other two locations. This means that As losses are expected to be more rapid in case of higher As va lues. This observation is very sig- nificant because in the As studies worldwide, the As concentrations are generally believed to be more or less stable and are expected to follow a law of average. Look- ing to this trend monitored at Kaudikasa we are inclined to say that the reported results may not be really reflect- ing the true picture of As contamination. It is because of the fact in the most studies the sample holding time is neither specified nor mentioned in the results. In many cases the actual analysis might be performed very late after the sampling. We are further inclined to say that many of the reported results could be 60% - 70% less than the actual. If this is the case then we have to realize that we are dealing with a monster which is more power- ful than what we believe. To effectively deal with such a condition it is necessary that the proper sampling, time specified preservation and analysis regime is necessary.  Preservation Artifacts and Loss Pattern of Arsenic: A Case Study from Highly Contaminated Location 1214 in Central-East India Figure 1. Arsenic loss (mg/L) pattern of three Locations during the holding time of one month. Figure 2. Arsenic loss (mg/L) pattern of Location I during specified time intervals. Figure 3. Arsenic loss (mg/L) pattern of Location II during specified time intervals. C opyright © 2011 SciRes. JEP 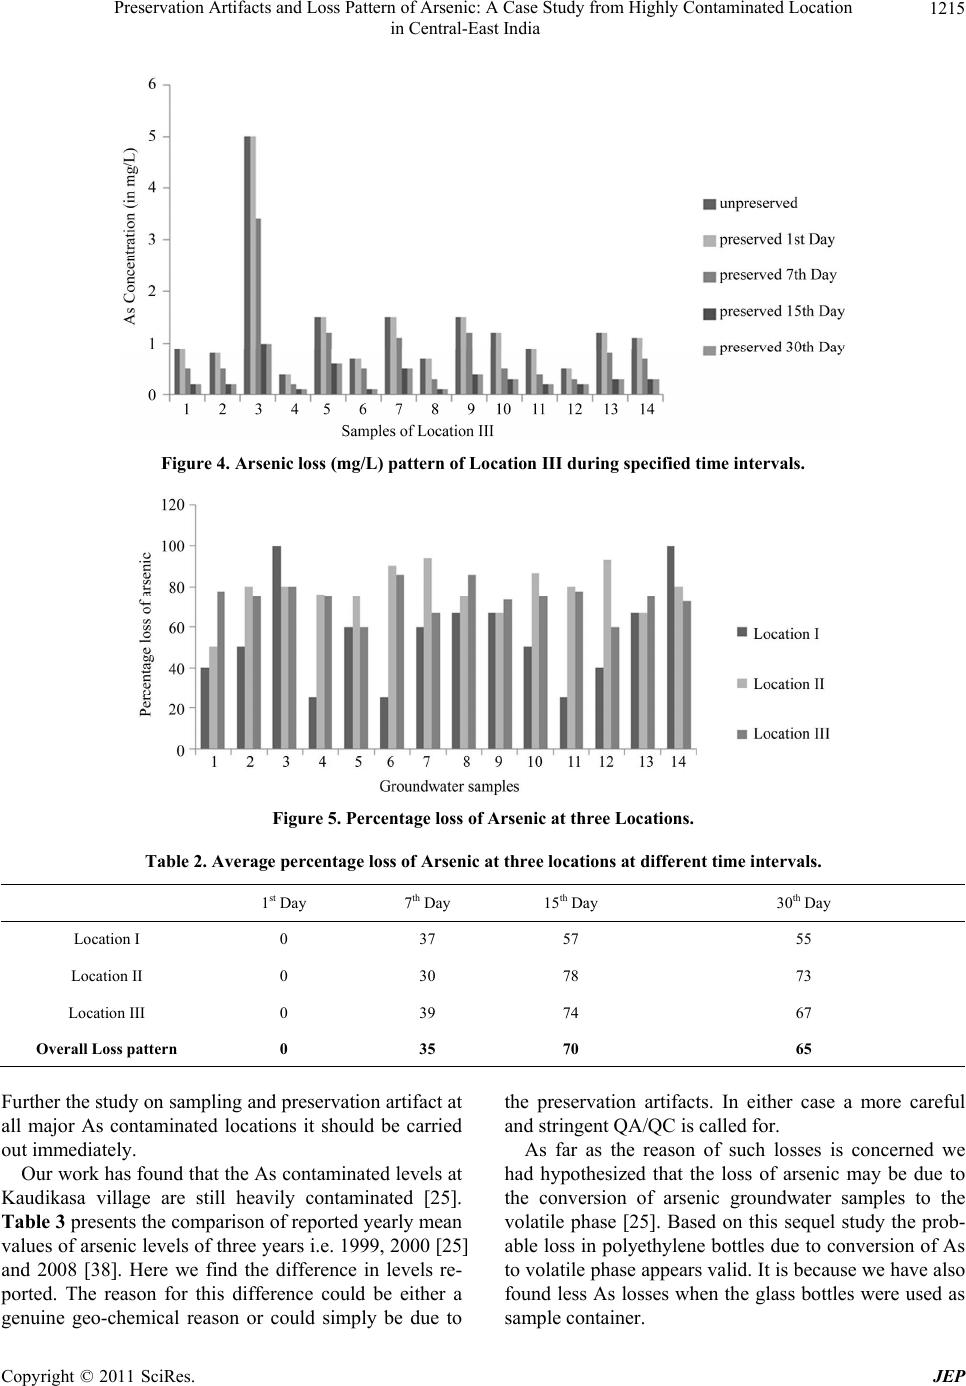 Preservation Artifacts and Loss Pattern of Arsenic: A Case Study from Highly Contaminated Location 1215 in Central-East India Figure 4. Arsenic loss (mg/L) pattern of Location III during spec i fie d time intervals. Figure 5. Percentage loss of Arsenic at three Locations. Table 2. Average percentage loss of Arsenic at three locations at different time intervals. 1st Day 7th Day 15th Day 30th Day Location I 0 37 57 55 Location II 0 30 78 73 Location III 0 39 74 67 Overall Loss pattern 0 35 70 65 Further the study on sampling and pr eserva tion artif act at all major As contaminated locations it should be carried out immediately. Our work has found that the As contaminated levels at Kaudikasa village are still heavily contaminated [25]. Table 3 presents the comparison of reported yearly mean values of arsenic levels of three years i.e. 1999, 2000 [25] and 2008 [38]. Here we find the difference in levels re- ported. The reason for this difference could be either a genuine geo-chemical reason or could simply be due to the preservation artifacts. In either case a more careful and stringent QA/QC is called for. As far as the reason of such losses is concerned we had hypothesized that the loss of arsenic may be due to the conversion of arsenic groundwater samples to the volatile phase [25]. Based on this sequel study the prob- able loss in polyethylene bottles due to conversion of As to volatile phase appears valid. It is because we have also found less As losses when the glass bottles were used as sample container. Copyright © 2011 SciRes. JEP 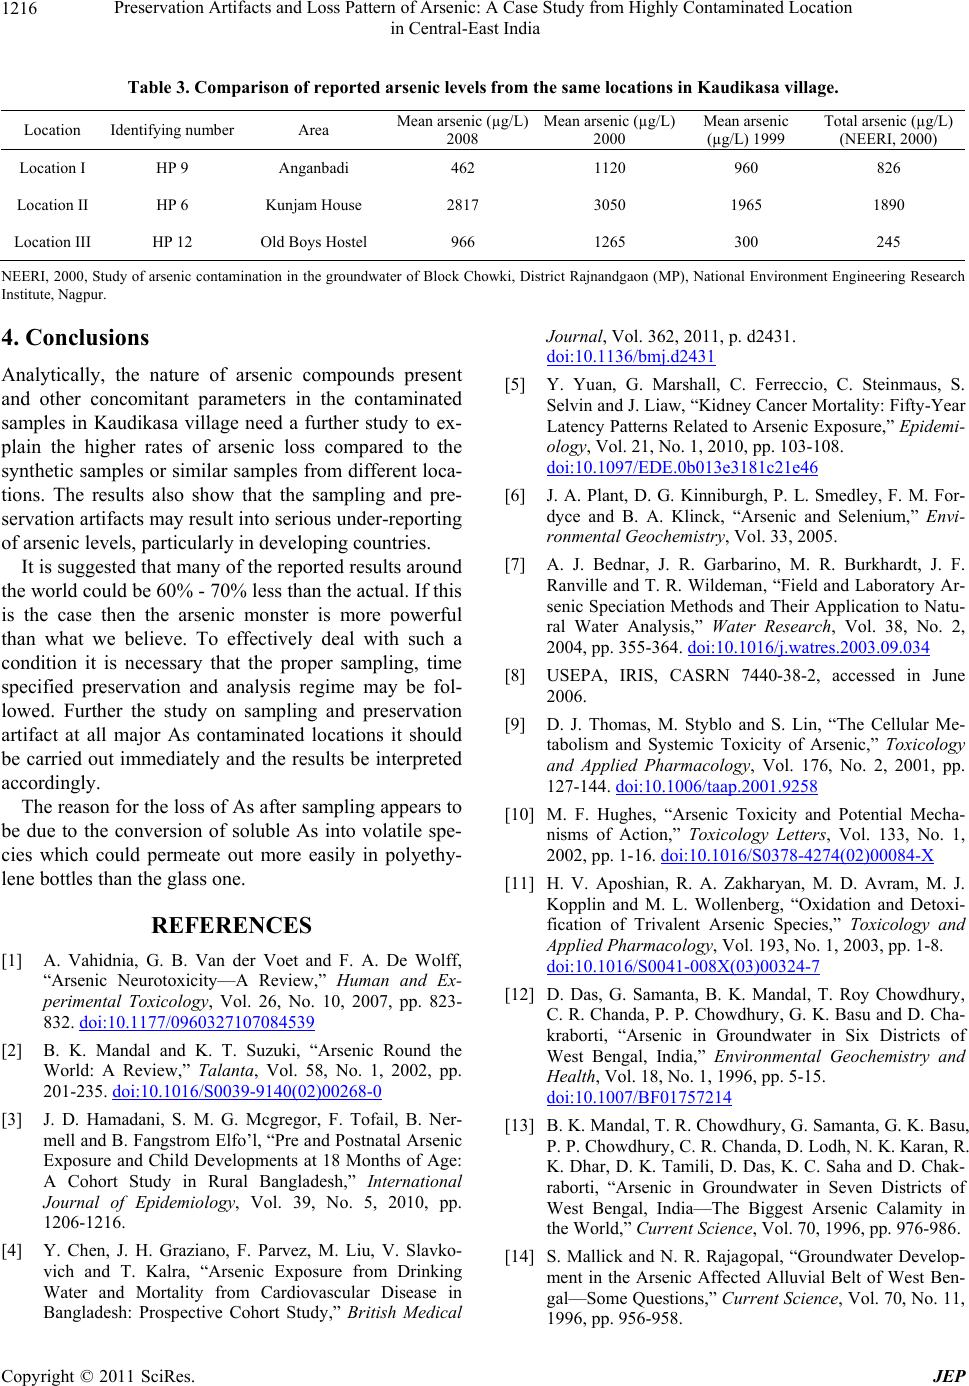 Preservation Artifacts and Loss Pattern of Arsenic: A Case Study from Highly Contaminated Location 1216 in Central-East India Table 3. Comparison of reported arsenic levels from the same locations in Kaudikasa village. Location Identifying number Area Mean arsenic (µg/L) 2008 Mean arsenic (µg/L) 2000 Mean arsenic (µg/L) 1999 Total arsenic (µg/L) (NEERI, 2000) Location I HP 9 Anganbadi 462 1120 960 826 Location II HP 6 Kunjam Ho u s e 2817 3050 1965 1890 Location III HP 12 Old Boys Hostel 966 1265 300 245 NEERI, 2000, Study of arsenic contamination in the groundwater of Block Chowki, District Rajnandgaon (MP), National Environment Engineering Research Institute, Nagpur. 4. Conclusions Analytically, the nature of arsenic compounds present and other concomitant parameters in the contaminated samples in Kaudikasa village need a further study to ex- plain the higher rates of arsenic loss compared to the synthetic samples or similar samples from different loca- tions. The results also show that the sampling and pre- servation artifacts may result into serious under-reporting of arsenic levels, particularly in developing countries. It is suggested that many of the repo rted r esults around the world could be 60% - 70% less than the actual. If this is the case then the arsenic monster is more powerful than what we believe. To effectively deal with such a condition it is necessary that the proper sampling, time specified preservation and analysis regime may be fol- lowed. Further the study on sampling and preservation artifact at all major As contaminated locations it should be carried out immediately and the results be interpreted accordingly. The reason for the loss of As after sampling appears to be due to the conversion of soluble As into volatile spe- cies which could permeate out more easily in polyethy- lene bottles than the glass one. REFERENCES [1] A. Vahidnia, G. B. Van der Voet and F. A. De Wolff, “Arsenic Neurotoxicity—A Review,” Human and Ex- perimental Toxicology, Vol. 26, No. 10, 2007, pp. 823- 832. doi:10.1177/0960327107084539 [2] B. K. Mandal and K. T. Suzuki, “Arsenic Round the World: A Review,” Talanta, Vol. 58, No. 1, 2002, pp. 201-235. doi:10.1016/S0039-9140(02)00268-0 [3] J. D. Hamadani, S. M. G. Mcgregor, F. Tofail, B. Ner- mell and B. Fangstrom Elfo’l, “Pre and Postnatal Arsenic Exposure and Child Developments at 18 Months of Age: A Cohort Study in Rural Bangladesh,” International Journal of Epidemiology, Vol. 39, No. 5, 2010, pp. 1206-1216. [4] Y. Chen, J. H. Graziano, F. Parvez, M. Liu, V. Slavko- vich and T. Kalra, “Arsenic Exposure from Drinking Water and Mortality from Cardiovascular Disease in Bangladesh: Prospective Cohort Study,” British Medical Journal, Vol. 362, 2011, p. d2431. doi:10.1136/bmj.d2431 [5] Y. Yuan, G. Marshall, C. Ferreccio, C. Steinmaus, S. Selvin and J. Liaw, “Kidney Cancer Mortality: Fifty-Year Latency Patterns Related to Arsenic Exposure,” Epidemi- ology, Vol. 21, No. 1, 2010, pp. 103-108. doi:10.1097/EDE.0b013e3181c21e46 [6] J. A. Plant, D. G. Kinniburgh, P. L. Smedley, F. M. For- dyce and B. A. Klinck, “Arsenic and Selenium,” Envi- ronmental Geochemistry, Vol. 33, 2005. [7] A. J. Bednar, J. R. Garbarino, M. R. Burkhardt, J. F. Ranville and T. R. Wildeman, “Field and Laboratory Ar- senic Speciation Methods and Their Application to Natu- ral Water Analysis,” Water Research, Vol. 38, No. 2, 2004, pp. 355-364. doi:10.1016/j.watres.2003.09.034 [8] USEPA, IRIS, CASRN 7440-38-2, accessed in June 2006. [9] D. J. Thomas, M. Styblo and S. Lin, “The Cellular Me- tabolism and Systemic Toxicity of Arsenic,” Toxicology and Applied Pharmacology, Vol. 176, No. 2, 2001, pp. 127-144. doi:10.1006/taap.2001.9258 [10] M. F. Hughes, “Arsenic Toxicity and Potential Mecha- nisms of Action,” Toxicology Letters, Vol. 133, No. 1, 2002, pp. 1-16. doi:10.1016/S0378-4274(02)00084-X [11] H. V. Aposhian, R. A. Zakharyan, M. D. Avram, M. J. Kopplin and M. L. Wollenberg, “Oxidation and Detoxi- fication of Trivalent Arsenic Species,” Toxicology and Applied Pharmacology, Vol. 193, No. 1, 2003, pp. 1-8. doi:10.1016/S0041-008X(03)00324-7 [12] D. Das, G. Samanta, B. K. Mandal, T. Roy Chowdhury, C. R. Chanda, P. P. Chowdhury, G. K. Basu and D. Cha- kraborti, “Arsenic in Groundwater in Six Districts of West Bengal, India,” Environmental Geochemistry and Health, Vol. 18, No. 1, 1996, pp. 5-15. doi:10.1007/BF01757214 [13] B. K. Mandal, T. R. Chowdhury, G. Samanta, G. K. Basu, P. P. Chowdhury, C. R. Chanda, D. Lodh, N. K. Karan, R. K. Dhar, D. K. Tamili, D. Das, K. C. Saha and D. Chak- raborti, “Arsenic in Groundwater in Seven Districts of West Bengal, India—The Biggest Arsenic Calamity in the World,” Current Science, Vol. 70, 1996, pp. 976-986. [14] S. Mallick and N. R. Rajagopal, “Groundwater Develop- ment in the Arsenic Affected Alluvial Belt of West Ben- gal—Some Questions,” Current Science, Vol. 70, No. 11, 1996, pp. 956-958. C opyright © 2011 SciRes. JEP  Preservation Artifacts and Loss Pattern of Arsenic: A Case Study from Highly Contaminated Location 1217 in Central-East India [15] R. T. Nickson, J. M. McArthur and P Ravenscroft, “Mechanism of Arsenic Release to Groundwater, Bang- ladesh and West Bengal,” Applied Geochemistry, Vol. 15, No. 4, 2000, pp. 403-413. doi:10.1016/S0883-2927(99)00086-4 [16] Anonym, Main Report, Govt. of Bangladesh, British Geological Survey and Mott Macdonald, UK, 1999. [17] L. Wang and J. Huang, “Arsenic in the Environment, Part II,” In: J. O. Nriagu, Ed., Human Health and Ecosystem Effects, John Wiley & Sons, Inc., New York, 1994, pp. 159-172. [18] P. L. Smedley, W. M. Edmunds and K. B. Pelig-ba, In: J. D. Applaton, R. Fuge and G. J. H. McCall, Eds., Envi- ronmental Geochemistry and Health, Geol. Soc. London Spec. Publ, 2000, Vol. 113, pp. 163-182. [19] A. H. Welch, D. B. Westjohn, D. R. Helsel and R. B. Wanty, “Arsenic in Groundwater of the United States- Occurrence and Geochemistry,” Ground Water, Vol. 38, No. 4, 2000, pp. 589-604. doi:10.1111/j.1745-6584.2000.tb00251.x [20] D. Chakraborti, B. K. Biswas, T. R. Chowdhury, G. K. Basu, B. K. Mandal, U. K. Chowdhury, S. C. Mukherjee, J. P. Gupta, S. R. Chowdhry and K. C. Rathore, “Arsenic Groundwater Contamination and Sufferings of People in Rajnandgaon Districts, Madhya Pradesh, India,” Current science, Vol. 77, No. 4, 1999, pp. 502-504. [21] P. K. Pandey, R. N. Khare, R. Sharma, S. K. Sar, M. Pandey and P. Binayake, “Arsenicosis and Deteriorating Ground Water Quality; Unfolding Crisis in Central East Indian Region,” Current Science, Vol. 77, 1999, pp. 686- 693. [22] Anonym, News, Geological Survey of India, Vol. 18, 2001, pp. 21-22. [23] S. K. Acharyya, I. D. Ashyiya, Y. Pandey, S. Lahiri, V. W. Khangan and S. K. Sarkar, in National Symposium on Role of Earth Sciences in Integrated Development and Related Societal Issues, Geological Survey of India, Vol. 65, 2001, pp. 7-18. [24] B. Daus, J. Mattusc h, R. Wennrich and H. Weiss, “Inves- tigation on Stability and Preservation of Arsenic Species in Iron-Rich Water Samples,” Talanta, Vol. 58, No. 1, 2002, pp. 57-65. doi:10.1016/S0039-9140(02)00256-4 [25] P. K. Pandey, S. Yadav, S. Nair and M. Pandey, “Samp- ling and Preservation Artifacts in Arsenic Analysis: Implications for Public Health Issues in Developing Countries,” Current Science, Vol. 86, 2004, pp. 1426- 1432. [26] A. J. Bednar, J. R. Garbarino, J. F. Ranville and T. R. Wildeman, “Preserving the Distribution of Inorganic Ar- senic Species in Groundwater and Acid Mine Drainage Samples,” Environmental Science and Technology, Vol. 36, 2002, pp. 2213-2218. doi:10.1021/es0157651 [27] World Health Organisation (WHO), “Fact Sheet No 210,” Geneva, 1999. [28] Y. T. Kim, H. Yoon, C. Yoon and N. C. Woo, “An As- sessment of Sampling, Preservation, and Analytical Pro- cedures for Arsenic Speciation in Potentially Contami- nated Waters,” Environmental Geochemistry and Health, Vol. 29, No. 4, 2007, pp. 337-346. [29] H. A. L. Rowland, A. G. Gault, J. M. Charnock and D. A. Polya, “Preservation and XANES Determination of the Oxidation State of Solid-Phase Arsenic in Shallow Sedi- mentary Aquifers in Bengal and Cambodia,” Minera- logical Magazine, Vol. 69, No. 5, 2005, pp. 825-839. doi:10.1180/0026461056950291 [30] R. W. Puls and J. B. Michael, “Low-Flow (Minimal Drawdown) Ground-Water Sampling Procedures,” EPA Groundwater Issue, US EPA, Vol. 540, S-95, 1996, p. 504. [31] APHA, “Standards Methods for the Examination of Wa- ter and Wastewater,” American Public Health Associa- tion, Washington DC, 1992. [32] APHA, “Standards Methods for the Examination of Wa- ter and Wastewater,” American Public Health Associa- tion, Washington DC, 1995. [33] US EPA, “Rules and Regulations,” US Environmental Protection Agency, Federal Register 49, No. 209, USA, 1984. [34] WDNR, “Groundwater Sampling Field Manual,” Wis- consin Department of Natural Resources PUBL-DG-038 96, WDNR, USA, 1996. [35] D. A. Clifford and G. Samanta, “Preservation of Arsenic Species,” AWWARF Report 91117F, 2007, 148 Pages. [36] EPA, “The Handbook for SAMPLING and Sample Pres- ervation of Water and Wastewater,” EPA Number- 600482029, 1982. [37] T. A. Hinners, “Arsenic Speciation: Limitations with Direct Hydride Analysis,” Analyst, Vol. 105, 1980, pp. 751-755. doi:10.1039/an9800500751 [38] P. K. Pandey, H. Zankyani, R. Deshmukh and M. Pandey, “Arsenic Contamination in Central-East India: New Les- sons for the Environmental Health,” International Jour- nal of Environmental Studies, in Press, 2012. Copyright © 2011 SciRes. JEP
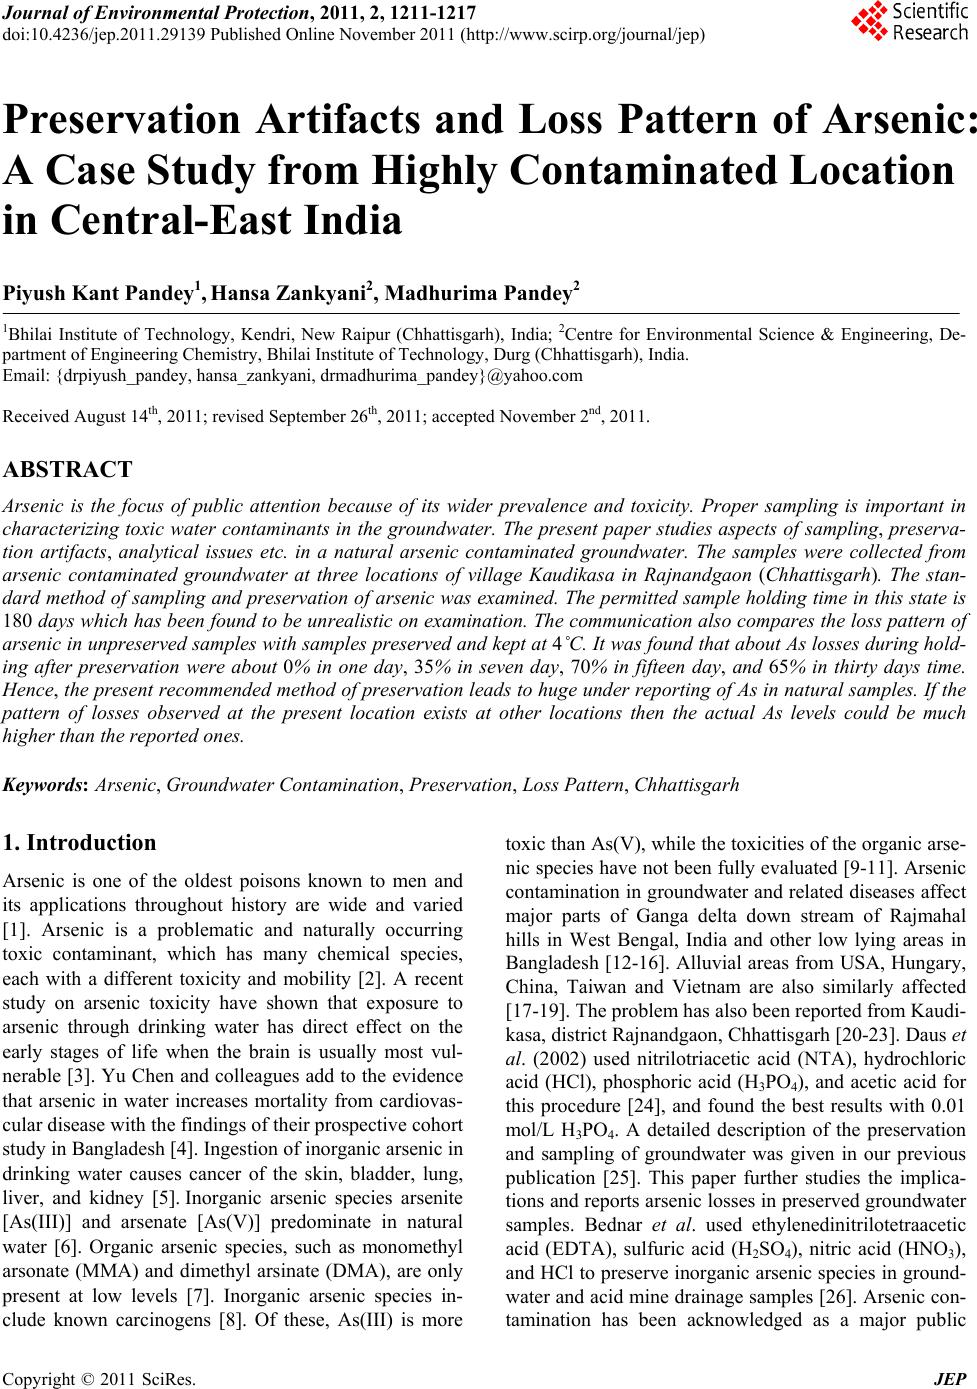
|