 Intelligent Control and Automation, 2011, 2, 418-423 doi:10.4236/ica.2011.24048 Published Online November 2011 (http://www.SciRP.org/journal/ica) Copyright © 2011 SciRes. ICA Dynamic Pricing Model for the Operation of Closed-Loop Supply Chain System Jiawang Xu1,2, Yunlong Zhu1 1Shenyang Institute of Automation, Chinese Academy of Sciences, Shenyang, Ch ina 2School of Economics & Management, She nyang Aero space Unive rs ity, Shenyang, China E-mail: ccb867321@yahoo.com.cn Received August 2, 2011; revised August 29, 2011; accepted September 6, 2011 Abstract A class of closed-loop supply chain system consisting of one manufacturer and one supplier is designed, in which re-distribution, remanufacturing and reuse are considered synthetically. The manufacturer is in charge of recollecting and re-disposal the used products. Demands of ultimate products and collecting quantity of used products are described as the function of prices and reference prices. A non-linear dynamic pricing model for this closed-loop supply chain is established. A numerical example is designed, and the results of this example verified the model’s validity to price for the operation of closed-loop supply chain system. Keywords: Closed-Loop Supply Chain, Manufacturing/Remanufacturing, Pricing, Dynamic Programming 1. Introduction There are numerous researches on closed-loop supply chain system which address many various topics from definition to practical cases in real industry. Many ana- lytic and quantitative approaches are also found in vari- ous problems such as forecasting, production planning/ control, inventory control/management, and location. For example, the impact of remanufacturing in economy was studi ed by Ferre r and Ayr es [1], an d more fund amentally, Sundin and Bras [2] provided arguments for why used products should be remanufactured. A good overview on quantitative models for recovery production planning and inventory control was given by Fleischmann et al. [3]. Der Laan and Salomon [4] pr oposed a hybrid manu- facturing/remanufacturing system with stocking points for serviceable and remanufacturable products. Jayara- man et al. [5] proposed a general mixed-integer pro- gramming model and solution procedure for a reverse distribution problem focused on the strategic level. Moreover, Kim et al. [6] dealt with remanufacturing execution at operational level. They proposed a general framework for remanufacturing system in reverse logis- tics environment and a mathematical model to maxi- mize the total cost savings by optimally deciding the quantity of parts to be processed at each remanufactur- ing facilities, the number of purchased parts from sub- contractor. In the course of closed-loop supply chain system op- erations, it is also very important to decide the prices of ultimate products and the collecting prices of used prod- ucts. Recently, Ray and Boyaci [7] studied the optimal pricing/trade-in strategies for durable, remanufacturable products. They focused on the scenario where the re- placement customers were only interested in trade-ins. In this setting, they studied three pricing schemes: 1) uni- form price for all customers, 2) age-independent price differentiation between new and replacement customers, and 3) age-dependent price differentiation between new and replacement customers. Gu et al. [8] studied the price decisions of recycled products based on the reverse supply chain between the manufacturer and the retailer by using game theory. Two non-cooperative game equi- librium (Stackelberg equilibrium and Nash equilibrium) and a cooperative game equilibrium (coordination in price decision) were obtained. Guide [9] researched the optimal collect decision when used product quality is uncertain, and Samar [10] studied the optimal price and collect policy for reverse logistics in electronic business. Liang et al. [11] proposed a model to ev aluate the acqui- sition price of the used products. This model links the used product acqu isition price with the sale price of used product but assumes other costs such as logistics and remanufacturing to be deterministic. Different from these researches above, a non-linear dynamic programming model is established in this paper, we study the dynamic  J. W. XU ET AL.419 ) pricing problems on u ltimate products and used products for closed-loop supply chain with remanufacturing from the view of operation management. 2. Descriptions 2.1. Framework for Closed-Loop Supply Chain System Considering a multi-stage closed-loop supply chain sys- tem consisting of one manufacturer and one supplier, in which re-distribution, remanufacturing and reuse are considered synthetically. The manufacturer is in charge of recollecting and re-disposal the used products. Ac- cording to the status of used products, the manufacturer has four alternatives for re-disposing: 1) Repair. Some used products are r epaired and sold w ith new products in the same market (here, we assume that product comes from used product repairing is same as new product); 2) Disassemble. Some used products are disassembled, and parts are brought back to “as new” conditions; 3) De- compose. Some used product can’t be repaired or disas- sembled are decomposed to raw materials and be re- turned to supplier as his raw materials; 4) Discard. Other used prod u cts can’t be reused are discarded. At each stage, the manufacturer has two alternatives for supplying materials: either ordering the required ma- terials to suppliers or overhauling used products and bringing those back to “as new” condition s. The quantity of manufacturer’s outputs is determined by customers’ demands and the outputs of used products repairing. The supplier product the materials which manufacturer or- dering, his required raw materials come from the raw materials market and the outputs of used products de- composing. The framework for closed-loop supply chain system is shown as Figure 1. 2.2. Notations Subscript: j i ultimate product; (1,,jJ (1 material of manufacturer ; ,,)iI t stage (1,,)tT (1 ; h raw material ,,) hH Decision variable: it p price of ultimate product j at stage t; t r col l e c t ing pri ce of us e d p roduct j at stage t; t v sales quantity of ultimate product j at stage t; t z outputs of ultimate product j at stage t; t z inventories of ultimate product j at stage t; it inventories of material i at stage t; it l b orders of material i at stage t; it supplier’s delivery quantities of material i at stage t; it supplier’s production quantities of material i at stage t; it supplier’s inventories of material i at stage t. Parameters: t R co llecting quantity of used product j at stage t; t q d dem a nd o f ul t imate product j at stage t; it price of material i at stage t; c unit variable manufacturing cost of ultimate product j ; hy i h unit inventory cost of ultimate product j; unit inventory cost of material i; k capacity consuming rate of ultimate product j; max manufacture’s maximum production capacity; ' 0 z initial inventory of ultimate product j; o occupied inventory of unit ultimate product j; xma L z total inventory level of ultimate products; ij BOM coefficient of ultimate product j to material i; ' 0 i initial inventory of material i; y oimax L y occupied inventory of unit material i; total inventory level of materials; ht m price of raw material h at stage t; i r c unit variable cost of material i; hi BOM coefficient of material i to raw material h; i h unit inventory cost of material i; i capacity consuming rate of material i; ma Gx supplier’s maximum production capacity avail- able; ' 0 i initial inventory of material i; i o occupied inventory of unit material i; Figure 1. Framework for closed-loop supply chain system. Order Deliver Decompose Disassemble Demands Used products Repair Raw materials market Supplier Customers Manufacturer Discard Copyright © 2011 SciRes. ICA  J. W. XU ET AL. 420 max L total inventory level of materials; ht supply quantity of raw material h at stage t; t average price of raw materials decomposed from used product j at stage t; w 1 t , 2 t and 3 t are repairing rate, disassembling rate and decomposing rate of used product j at stage t respectively, and; 123 1 jt jt jt 1 t, 2 t and 3 t are unit repairing cost, disassem- bling cost and decomposing cost of used product j at stage t respectively, and1 t <2 t <3 t ; d demand of ultimate product j neglecting the im- pacts of price and vendit i on ef fo rt ; e collecting quantity of used prod uct j neglecting the impacts of collecting price and collecting efforts; demand sensitive coefficient of ultimate product j to the price; demand sensitive coefficient of ultimate product j to the variation of price; collecting quantity sensitive coefficient of used product j to collecting price; collecting quantity sensitive coefficient of used product j to the variation of collecting price. 2.3. Hypotheses 1) The process of product manufacturing and used prod- uct remanufacturing are synchronously, and the outputs’ quality from remanufacturing is the same as that of manufacturing, that is, the selling prices of the outputs from manufacturing and from remanufacturing are uni- form; 2) Demand of ultimate product decreases along with the raising of selling price as well as the increment of selling price. For research convenient, we set ,1 () jtjjjtjjtj t dd ppp ; 3) Collecting quantity of used product increases along with the raising of collecting price as well as the incre- ment of collecting price. We set ,1 () jtjjtjtj t Re rrr . 3. Pricing Model In the closed-loop supply chain system shown as Figure 1, we consider three operation objectives: 1) At each stage, operation of the closed-loop supply chain system should realize coordination of participants, namely the supplier’s delivery quantity is nicely equal to the manu- facturer’s order quantity. 2) The Manufacturer pursues profits maximization. 3)The supplier pursues profits maximization. These objectives can be described as fol- lows: , it it bl it yL y (1) 11 1 3 11 11 112233 11 max(( ) () () TJ I PzzL jtjtjjtjjtit itiit tj i TJHI yr jtjtjkij hi tj hi TJ jtjt jtjt jtjt jtjt tj Cpvczhzqbh wR ss Rr (2) 11 1 3 11 11 max([()] ) () TI H SxLx it itiitihthiit ti h TJHIyr jt jt jtijhi tj hi Cqlhxcms wR ss r x (3) where, C is Manufacturer’s profit, and is sup- plier’s profit. S C Transform 3 expressions above to objective program- ming form, the operation model for the operation of closed-loop supply chain system can be rewritten as fol- lows. Objective function: 11 objective 1:minTI it it ti dd ; objective 2:min d ; objec tive 3:m indS ; where, it d and it d are supplier’s delivery quantity of material i at stage t when it’s deficient and superfluous respectively, d is deficient quantity of manufacturer’s objective profit, S d is deficient quantity of supplier’s objective profit. Objective restrictions: 0 it ititit bld di ,t (4) P P CddM P ) 0 yL y (5) 11 1 3 11 11 1122 33 11 (( () () TJ I PzzL jtjtjjtjjtit itiit tj i TJHIyr jtjtjkij hi tj hi TJ jtjtjtjtjt jtjt jt tj Cpvczhzqbh wR ss Rr (6) SSS CddM S ]) r x (7) 11 1 3 11 11 ([() ()0 TI H SxLx it itiitihthiit ti h TJHIyr jtjtjtij hi tj hi Cqlhxcms wR ss (8) where, is a maximum objective profit the manu- facturer expected and it’s a constant, S is a maximum Copyright © 2011 SciRes. ICA  J. W. XU ET AL.421 objective profit the supplier expected and it’s also a con- stant. Absolute restrictions: Supplier’s production capacity satisfies max 1 Ig iit i G t (9) Supplier’s inv entory of product satisfies ,1 , LL iti titit xxli t (10) ' 00 LL ii xi (11) max 1 IxLL iit ioxxt (12) The restricted condition of supplier’s material supply- ing 3 11 , IJ ry hiitijjt jtht ij xsRs ht t t j t (13) Manufacturer’s capacity restriction at each stage max 1 Jk jjt jzK (14) Manufacturer’s inventory of ultimate product at each stage 1 ,1 , LL jtj tjtjtjtjt zzzvRj (15) ' 00 LL jj zz max (16) 1 JzLL jjt joz zt (17) Manufacturer’s invent ory of material satisfies 2 ,1 1, J LL y it ititijjt jtjt j yy bszRi (18) ' 00 LL ii yi t ) (19) max 1 IyL L iit ioy yt (20) Manufacturer’s actual sales satisfies , jt jt vd j (21) Relationship between demand of ultimate product and its price ,1 ( jtjjjtjjtj t dd ppp (22) Relationship between collecting quantity of used product and its collecting price ,1 ( jtjjtjtj t Re rrr) (23) Nonnegative conditions: ,,,,,,,,,,, ,,,,,,0 ,, LL L itjt jt itititjtjt ititP PSs PSS jtit bz zylx prddd dddCCvx ijt (24) 4. Simulations Set J = 1(one ultimate product), I = 1(one material), H = 1(one raw material) and T = 4 (four sta ges). Demand of ultimate product neglecting the impacts of sale price and vendition effort is d = 450, collecting quantity of used product neglecting the collecting price and collecting efforts is e = 100, demand sensitive coef- ficients of product to the sale’s price and its variation are 0.5 and 5 respectively. Collecting quantity Sensitive coefficients of used product to collecting price and its variation are 2 and 20 respectively. Expected profits of manufacturer and supplier are all , that is, 8 110 = and S 8 110 = . The supply quantity of raw material at each stage are all 400, initial price of ultimate product is 0, the prices of raw material at each stage are all 40. 8 110 030p Repairing rate, disassembling rate and decomposing rate of used product are, and t respectively. Initial collecting price of used product is 0, unit cost for repairing, disassembling and decomposing used product are 120% t )20 r 230% t 330%(1,2,3,4t 13 t , 28 t and respectively. The raw material from decomposing used product can be sold to supplier, and its price are all 320 t 30 t w (t). Other pa- rameters are set as below. 1, 2,3, 4 max max 400, 400KG max max max 50, 50, 50 LLL zyx ''' 000 0, 0, 0 LLL zyx 10, 15, 75 xz ccq 1, 2, 3 xy z hh h 1, 1, 1, 1 gkry ss 1, 1, 1 xyz ooo We used LINGO9.0 for solving our multi-objective dynamic programming model. The results are shown in Tables 1 and 2. From results in Table 1, we can see that supplier’s de- livery quantity of material equals to manufacturer’s order quantity at each stage. The amount of sales quantity and inventory is bigger than the output of ultimate product at each stage, and the difference of these is increasing along with operation stage. The reasons for this phenomenon is that, as time increases, price of ultimate product and col- lecting price of used product become gradually rational- ize, demand of the ultimate product increases gradually, and the collecting quantity of used product is also in- creasing. As results in Table 2 shown, when initial price of ul- timate product is set 300, except stage 1, the price of ultimate product decreases as time goes on, but the de- mand of ultimate product increase. When initial collect- ing price of used product is set 20, except stage 1 and stage 2, collecting price of usd product increases gradu- e Copyright © 2011 SciRes. ICA  J. W. XU ET AL. Copyright © 2011 SciRes. ICA 422 Table 1. Optimal operation strategy for the closed-loop supply chain system. Manufacturer (Profits: 297061.1) Supplier (Profits: 2 5 3 41 .0) Stage outputs of ultimate product Sales quantity of ultimate product Inventories of ultimate product Inventory of materials Orders of materials Materials deliveries Materials production Materials inventory 1 187.5 190.4 0 0 183.0 183.0 183.0 0 2 400.0 363.4 50 0 379.9 379.9 379.9 0 3 400.0 433.7 50 0 349.4 349.4 349.4 0 4 400.0 513.2 0 0 305.2 305.2 305.2 0 Table 2. Demands of ultimate product and collecting quantities of used product. Stage Prices of ultima te produ ctDem and s of ultimate product Collecting prices of used product Collecting quantities of used product 1 319.9 190.4 9.6 14.8 2 306.6 363.4 5.2 67.0 3 281.7 433.7 10.1 168.6 4 244.6 513.2 26.4 316.0 ally, and so does collecting quantity of used product. The varying tendency for the price of ultimate product and the collecting price of used product are shown as Figures 2 and 3 respectively. 0 5 10 15 20 25 30 1 3 5 7 9111315171921 According to parameters above, whatever initial price of ultimate product and collecting price of used product are, we can obtain the same conclusions from the model: in the long run, through the regulations of price itself and price reference effect, the price of ultimate product is fixed to 157.2707 and the collecting price of used prod- uct is fixed to 27.38714. 5. Conclusions Figure 3. The varying tendency for collecting price of used product. From the view of operation researches, we consider a class of closed-loop supply chain system with product remanufacturing. The system is consists of one manu- facturer and one supplier. The manufacturer is in charge of recollecting and re-disposal the used products. De- mands of ultimate products and collecting quantity of used products are described by using prices and refer- ence prices. A non-linear dynamic pricing model for system operation is established. The model is constructed as a dynamic programming problem and satisfying sev- eral conflict objectives, such as the operating coordina- tion of system, making the maximum profit of all par- ticipants as much as possible. The model’s validity to dynamic pricing for closed-loop supply chain system is verified by a numerical example. The results of the nu- merical example shows that, in the long run, through the regulations of price itself and price reference effect, the price of ultimate product and the collecting price of used product fix to a certain value without reference to the initial price of ultimate product and the collecting price of used product. 0 50 100 150 200 250 300 350 13 5 79111315171921 6. Acknowledgements This work was supported by Humanities & Social Sci- ences Planning Fundation of Ministry of Education Grant #11YJA630165 to J. W. Xu, and China Postdoctoral Science Foundation Grant #2008044170 to J. W. Xu. Figure 2. The varying tendency for the price of ultimate product.  J. W. XU ET AL.423 7. References [1] G. Ferrer and R. U. Ayres, “The Impact of Remanufac- turing in the Economy,” Ecological Economics, Vol. 32, No. 3, 2000, pp. 413-429. doi:10.1016/S0921-8009(99)00110-X [2] E. Sundin and B. Bras, “Making Functional Sales Envi- ronmentally and Economically Beneficial through Prod- uct Remanufacturing,” Journal of Cleaner Production, Vol. 13, No. 9, 2005, pp. 913-925. doi:10.1016/j.jclepro.2004.04.006 [3] M. Fleischmann, J. M. Bloemhof-Ruwarrd, R. Dekker, et al., “Quantitative Models for Reverse Logistics: A Re- view,” European Journal of Operational Research, Vol. 103, No. 1, 1997, pp. 1-17. doi:10.1016/S0377-2217(97)00230-0 [4] E. Der Laan and M. Salomon, “Production Planning and Inventory Control with Remanufacturing and Disposal,” European Journal of Operational Research, Vol. 102, No. 2, 1997, pp. 264-278. doi:10.1016/S0377-2217(97)00108-2 [5] V. Jayaraman, R. A. Patterson and E. Rolland, “The De- sign of Reverse Distribution Networks: Models and Solu- tion Procedures,” European Journal of Operational Re- search, Vol. 150, No. 1, 2003, pp. 128-149. doi:10.1016/S0377-2217(02)00497-6 [6] K. Kim, I. Song, J. Kim and B. Jeong, “Supply Planning Model for Remanufacturing System in Reverse Logistics Environment,” Computers & Industrial Engineering, Vol. 51, No. 2, 2006, pp. 279-287. doi:10.1016/j.cie.2006.02.008 [7] S. Ray and T. Boyaci, “Optimal Prices and Trade-in Re- bates for durable, Remanufacturable Products,” Manu- facturing & Service Operations Management, Vol. 7, No. 3, 2005, pp. 208-228. doi:10.1287/msom.1050.0080 [8] Q. Gu, T. Gao and L. Shi, “Price Decision Analysis for Reverse Supply Chain Based on Game Theory,” Systems Engineering-Theory & Practice, Vol. 20, No. 3, 2005, pp. 20-25. [9] T. Guide, “Matching Demand and Supply to Maximize Profits from Remanufacturing,” Manufacturing & Service Operations Management, Vol. 5, No. 4, 2003, pp. 303- 316. doi:10.1287/msom.5.4.303.24883 [10] K. M. Samar, “Reverse Logistics in e-Business,” Interna- tional Journal of Physical Distribution & Logistics Ma- nagement, Vol. 34, No. 2, 2004, pp. 70-88. [11] Y. Liang, S. Pokharel, G. H. Lim, “Pricing Used Products for Remanufacturing,” European Journal of Operational Research, Vol. 193, No. 2, 2009, pp. 390-395. doi:10.1016/j.ejor.2007.11.029 Copyright © 2011 SciRes. ICA
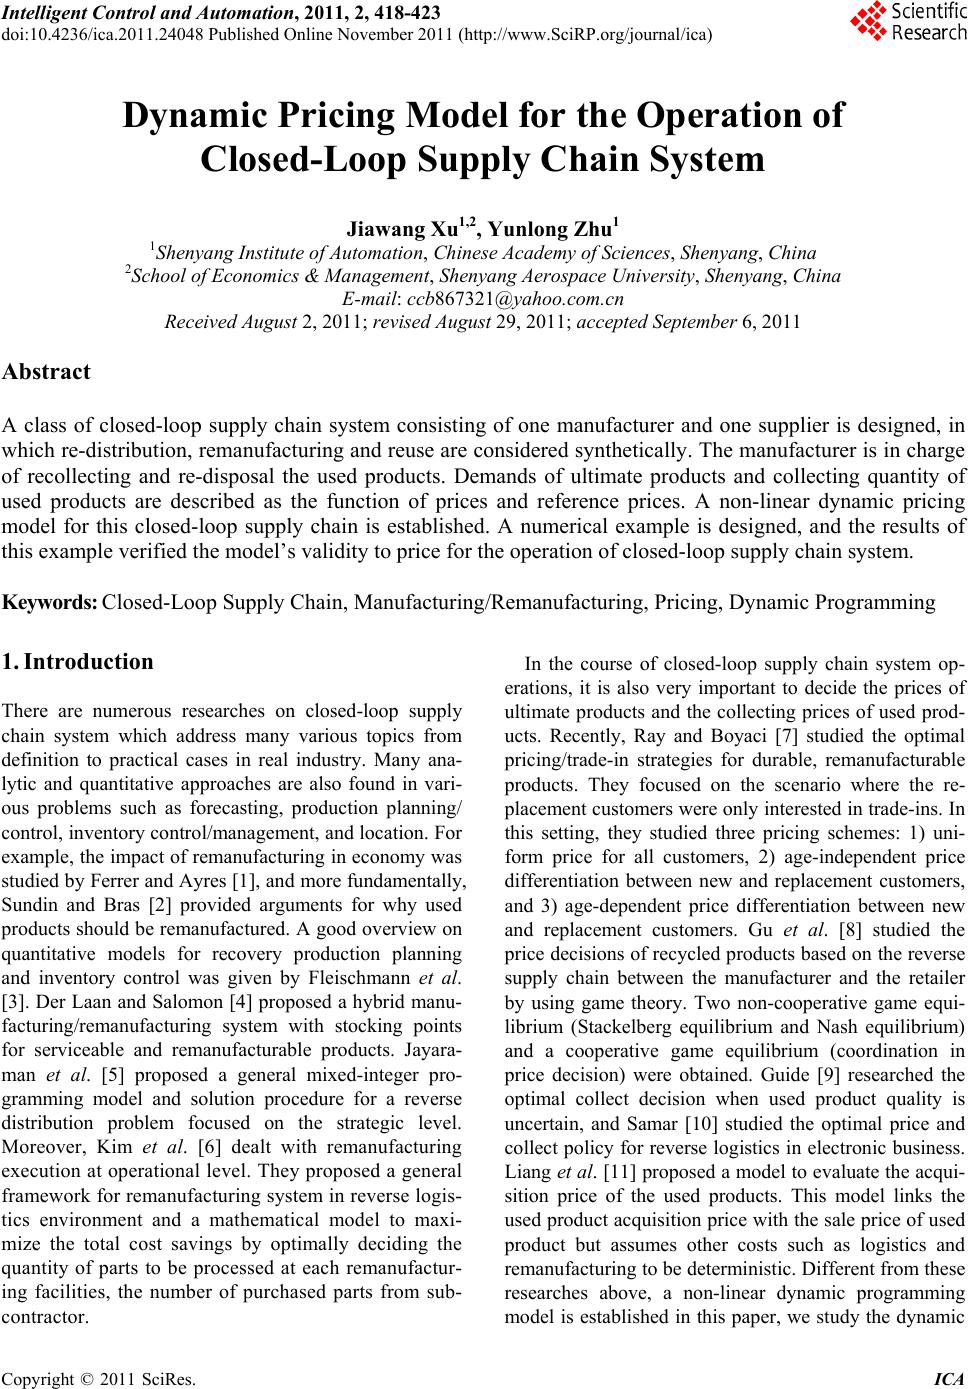
|