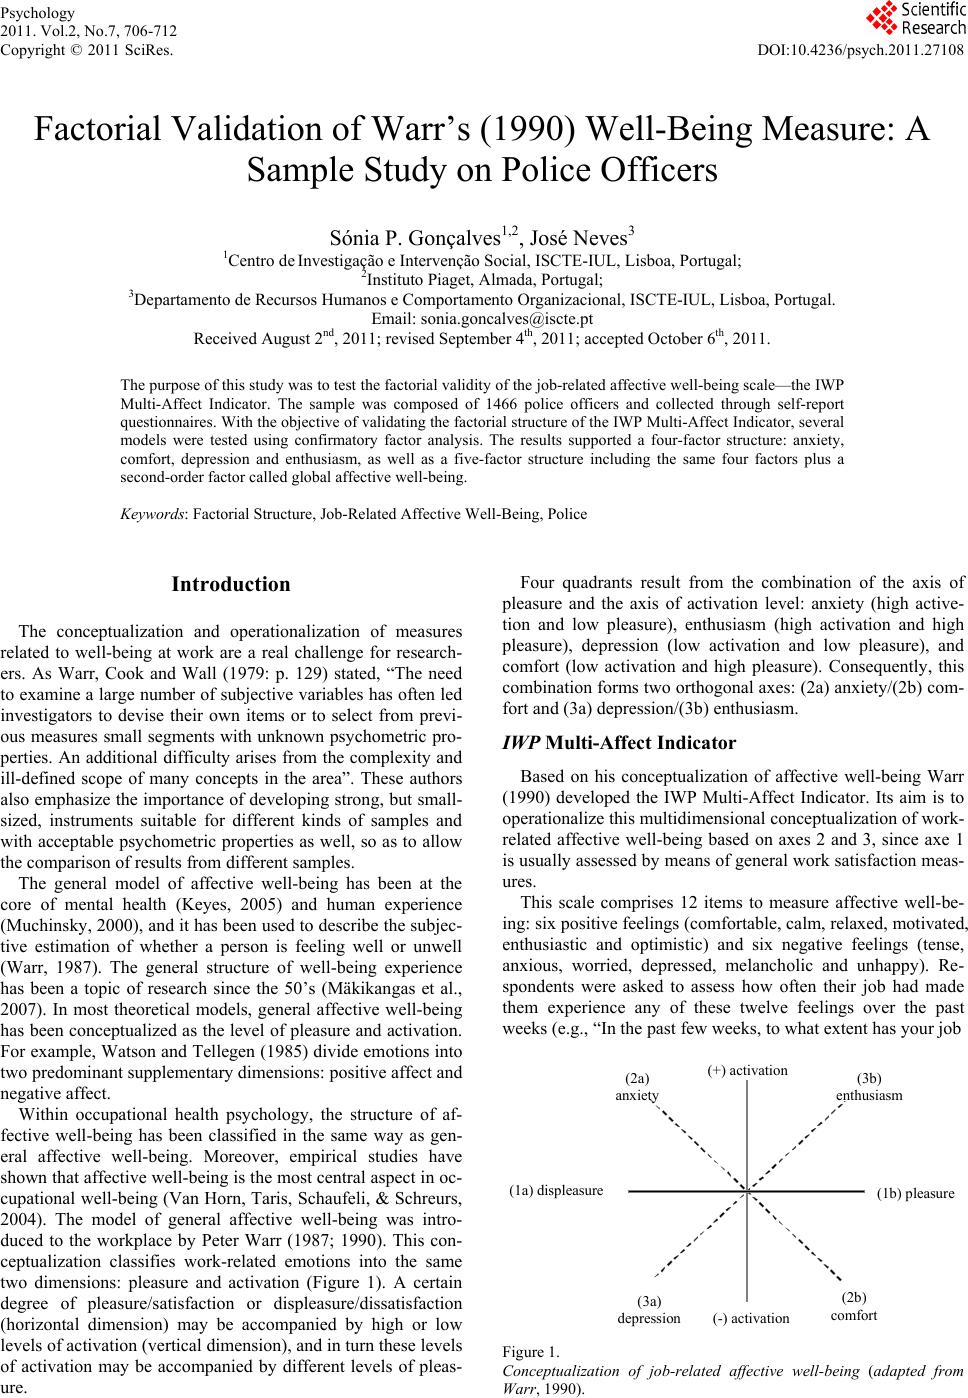
 Psychology 2011. Vol.2, No.7, 706-712 Copyright © 2011 SciRes. DOI:10.4236/psych.2011.27108 Factorial Validation of Warr’s (1990) Well-Being Measure: A Sample Study on Police Officers Sónia P. Gonçalves1,2, José Neves3 1Centro de Investigação e Intervenção Social, ISCTE-IUL, Lisboa, Portugal; 2Instituto Piaget, Almada, Portugal; 3Departamento de Recursos Humanos e Comportamento Organizacional, ISCTE-IUL, Lisboa, Portugal. Email: sonia.goncalves@iscte.pt Received August 2nd, 2011; revised September 4th, 2011; accepted October 6th, 2011. The purpose of this study was to test the factorial validity of the job-related affective well-being scale—the IWP Multi-Affect Indicator. The sample was composed of 1466 police officers and collected through self-report questionnaires. With the objective of validating the factorial structure of the IWP Multi-Affect Indicator, several models were tested using confirmatory factor analysis. The results supported a four-factor structure: anxiety, comfort, depression and enthusiasm, as well as a five-factor structure including the same four factors plus a second-order factor called global affective well-being. Keywords: Factorial Structure, Job-Related Affective Well-Being, Police Introduction The conceptualization and operationalization of measures related to well-being at work are a real challenge for research- ers. As Warr, Cook and Wall (1979: p. 129) stated, “The need to examine a large number of subjective variables has often led investigators to devise their own items or to select from previ- ous measures small segments with unknown psychometric pro- perties. An additional difficulty arises from the complexity and ill-defined scope of many concepts in the area”. These authors also emphasize the importance of developing strong, but small- sized, instruments suitable for different kinds of samples and with acceptable psychometric properties as well, so as to allow the comparison of results from different samples. The general model of affective well-being has been at the core of mental health (Keyes, 2005) and human experience (Muchinsky, 2000), and it has been used to describe the subjec- tive estimation of whether a person is feeling well or unwell (Warr, 1987). The general structure of well-being experience has been a topic of research since the 50’s (Mäkikangas et al., 2007). In most theoretical models, general affective well-being has been conceptualized as the level of pleasure and activation. For example, Watson and Tellegen (1985) divide emotions into two predominant supplementary dimensions: positive affect and negative affect. Within occupational health psychology, the structure of af- fective well-being has been classified in the same way as gen- eral affective well-being. Moreover, empirical studies have shown that affective well-being is the most central aspect in oc- cupational well-being (Van Horn, Taris, Schaufeli, & Schreurs, 2004). The model of general affective well-being was intro- duced to the workplace by Peter Warr (1987; 1990). This con- ceptualization classifies work-related emotions into the same two dimensions: pleasure and activation (Figure 1). A certain degree of pleasure/satisfaction or displeasure/dissatisfaction (horizontal dimension) may be accompanied by high or low levels of activation (vertical dimension), and in turn these levels of activation may be accompanied by different levels of pleas- ure. Four quadrants result from the combination of the axis of pleasure and the axis of activation level: anxiety (high active- tion and low pleasure), enthusiasm (high activation and high pleasure), depression (low activation and low pleasure), and comfort (low activation and high pleasure). Consequently, this combination forms two orthogonal axes: (2a) anxiety/(2b) com- fort and (3a) depression/(3b) enthusiasm. IWP Multi-Affec t Indicator Based on his conceptualization of affective well-being Warr (1990) developed the IWP Multi-Affect Indicator. Its aim is to operationalize this multidimensional conceptualization of work- related affective well-being based on axes 2 and 3, since axe 1 is usually assessed by means of general work satisfaction meas- ures. This scale comprises 12 items to measure affective well-be- ing: six positive feelings (comfortable, calm, relaxed, motivated, enthusiastic and optimistic) and six negative feelings (tense, anxious, worried, depressed, melancholic and unhappy). Re- spondents were asked to assess how often their job had made them experience any of these twelve feelings over the past weeks (e.g., “In the past few weeks, to what extent has your job (2a) anxiety (3b) enthusiasm (3a) depression (2b) comfort (+) activation (-) activation (1b) pleasure (1a) displeasure Figure 1. Conceptualization of job-related affective well-being (adapted from Warr, 1990).  S. P. GONÇALVES ET AL. 707 made you feel ...?”) on a 6-point Likert scale (1 = Never to 6 = All the time). According to Warr and Parker (2010), this scale allows us to obtain scores for each of the quadrants (anxiety, enthusiasm, depression and comfort); the authors have defined this as “pri- mary score for general use” (p. 3). Furthermore, the authors also refer to a “secondary specialized use” (p. 3), i.e., the scores of axes/dimensions (anxiety-comfort and depression-enthu- siasm; the anxiety and depression items are reversed), the score of negative affects (left quadrant in Figure 1) and positive af- fects (right quadrant in Figure 1), as well as an overall score of well-being at work (all quadrants) where higher values reflect greater well-being (the anxiety and depression items are re- versed). The scores are created using the average of the corre- sponding items for each factor. These dimensions are necessar- ily intercorrelated and, according to the authors, it is desirable to analyze multiple defaults. This measure of affective well-being at work has a set of valuable assets (Warr & Parker, 2010): 1) It is a context-spe- cific measure (“context-specific”) that addresses the feelings experienced at work, and not general feelings, and therefore should be a better predictor of work-related outcomes than free-context measures (“free-context”); 2) It is based on the model of affection—a circumplex model of affect (Russel, 1980), which has already been thoroughly studied, hence theo- retically and strongly supported; 3) It covers all four quadrants, while similar measures only cover them partially. For instance, PANAS does not cover the low activation quadrants (i.e., de- pression and comfort). Studies on the factorial structure of the job-related affective well-being scale (Table 1) have resorted primarily to principal components analysis, which has resulted in two- or three-factor solutions. Within a large sample, Warr (1990) found a two- factor solution, in which the six items “tense”, “anxious”, “wor- ried”, “calm”, “comfortable”, and “relaxed” compose the anxi- ety-comfort factor, whereas the remaining six items (depressed, melancholic, unhappy, motivated, enthusiastic, optimistic) con- stitute the depression-enthusiasm factor. Nevertheless, items “anxious” and “comfortable” gave great weight to both factors. This same structure was later replicated in other studies, except for differences in terms of the contribution exerted by some items (Cifre & Salanova, 2002; Sevastos, Smith, & Cordery, 1992). Two studies (Daniels, Brough, Guppy, Peters-Bean, & Weatherstone, 1997; Mäkikangas, Feldt, & Kinnunen, 2007) were found on the factorial structure of affective well-being at work through confirmatory factor analysis, which is “consid- ered the best way to examine the dimensionality of the prede- fined structure of a scale” (Mäkikangas et al., 2007: p. 199). The study by Daniels et al. (1997) confirmed that the three- factor structure was the one with better adjustment: positive affect (enthusiasm and optimism), negative affect (tense, wor- ried, anxious, calm and relaxed), and pleasure-displeasure fac- tor (comfortable , motivated, depressed, melancholic and un- happy); this structure is in line with the model of humor by Watson and Tellegen (1985). The results of the confirmatory factor analysis study by Mäkikangas et al. (2007) showed that the four-factor model is the one that best describes the structure of affective well-being at work, i.e., anxiety, comfort, depress- sion and enthusiasm. There are other studies that use the IWP Multi-Affect Indi- cator together with other measures to explore, on the one hand, different dimensions of affective well-being in a workplace context, e.g., anxiety-comfort, depression-pleasure, boredom- enthusiasm, tiredness-vigor and angriness-placidness (e.g., Daniels, 2000) and, on the other, different aspects of occupa- tional well-being, including, for instance, cognitive, profess- sional, social and psychosomatic dimensions (e.g., Van Horn et al., 2004). Objective The purpose of this study was to test the factorial structure of Warr’s (1990) IWP Multi-Affect Indicator scale, which has operationalized affective well-being at work. To accomplish this task, various models were tested using confirmatory factor analysis. Method Participants The study involved 1 466 police officers (91.9% males), aged 20 to 59 years (M = 35.91, SD = 8.33) and with different tenure levels, from less than one year to 41 years (M = 13.90; SD = 8.06). The majority of participants (58.7%) were married, and 48.7 % had from 10 to 12 years of schooling. Measures Affective well-being at work. The IWP Multi-Affect Indi- cator scale contains 12 items proposed by Warr (1990) to measure affective well-being at work according to the concept- tualization already outlined (Table 2). The participants’ task was to indicate to what extent their job had made them experi- ence any of those feelings over the past weeks on a Likert scale ranging from 1 (never) to 6 (all times). Procedure Data were collected through a questionnaire. Telephone and face-to-face contacts were established with the commanding officers, and they were explained the study as well as the pro- cedure for collecting data. The questionnaires were distributed and, after a period of approximately three weeks, we collected the questionnaires that had already been completed, either in person or via internal mail. The response rate was approxi- mately 80%. Results Descriptive Statistics and Correlations between Items Table 3 shows mean and standard deviations and item corre- lation matrix. All the items are significantly correlated with each other. The correlations between items of positive and ne- gative affect are negative, and the correlations between items of the same pole are positive. The coefficients are high, thus sug- gesting the existence of factors underlying the relationships between variables. Analysis of the Factorial Structure In order to validate the factorial structure of the IWP Multi- Affect Indicator various models were tested using confirmatory factor analyses. In all analyses, the estimated parameters were based on the variance-covariance matrix of the items in the scale. The method of maximum likelihood was used to estimate these parameters. The factors were specified as latent variables and represented by the components hypothesized by Warr  S. P. GONÇALVES ET AL. 708 Table 1. Summary of the studies on the IWP Multi-Affect Indicator. Authors (date) Sample Main results Warr (1990) 1686 workers of different professions Explanato r y analysis: – Factor analysis with varimax rotation confirmed the two dimensions provided: anxiety-comfort and depression-enthusiasm, thus corroborating the pleasure/activation model; – Items “anxious” and “comfortable” gave weight to both dimensions; – The remaining items carried the expected weight. Reliability: – Cronbach’s Alphas for anxiety-comfort: .76 – Cronbach’s Alphas for depression-enthusiasm: .80 Sevastos, Smith, & Cordery (1992) 3044 civil servants and white collar workers Exploratory a nalysis: – Factor analysis with varimax rotation replicated Warr’s (1990) results; – Factor analysis with oblimin rotation: only the item “anxious” added weight to both dimensions. Confirmatory analysis: – Single-factor model: χ2(54) = 14689.56, p < .001, GFI = .784, AGFI = .688, RMSR = .076 – Two-orthogonal factor model: χ2(53) = 13614.91, p < .001, GFI = .846, AGFI = .773, RMSR = .067 – The two-factor model showed better adjustment than the single-factor model (χ2(1) = 1074.65, p < .001) – Items suggested by modification indices are responsible for the mismatch: “comfortable”, “motivated”, “anxious” Reliability: – Cronbach’s Alphas for anxiety-comfort: .82 – Cronbach’s Alphas for depression-enthusiasm: .85 Daniels et al. (1997) 267 civil servants 156 police officers Confirmatory analysis (workers/police officers): – It tested the model proposed and found by Warr, Sevastos et al. and Watson & Tellegen – Model with better adjustment: Watson & Tellegen – Warr’s Model: χ2(41) = 176.02, p < .001, AIC = 94.02; NFI = 0.91; NNFI = 0.89; CFI = 0.93/χ2(41) = 84.64, p < .001, AIC = 2.64; NFI = 0.93; NNFI = 0.94; CFI = 0.96 – Sevastos et al.’s Model.: χ2(40) = 152.54, p < .001, AIC = 72.54; NFI = 0.93; NNFI = 0.91; CFI = 0.94/χ2(40) = 81.47, p < .001, AIC = 1.47; NFI = 093; NNFI = 0.94; CFI = 0.96 – Warson & Tellegen’s Model: χ2(38) = 95.79, p < .001, AIC = 19.79; NFI = 0.95; NNFI = 0.91; CFI = 0.97/χ2(38) = 1.75, p < .001, AIC = –9.37; NFI = 0.94; NNFI = 0.95; CFI = 0.97 Cifre & Salanova (2002) 299 factory workers and blue-collar workers Exploratory a nalysis: – Factor analysis supports the existence of two dimensions; – Items ‘comfortable’ and ‘motivated’ gave weight to both dimensions; – The solution without rotation refers to a single factor. Reliability: – Cronbach’s Alphas for anxiety-comfort: .86 – Cronbach’s Alphas for depression-enthusiasm: .77 Mäkikangas, Feldt, & Kinnunen (2007) 615 managers (longitudinal study) Confirmatory a nalysis (t1/t2) – Model with better adjustment: four-factor model (anxiety, comfort, depression, enthusiasm): χ2(48) = 270.62, p < .001, CFI = .97; RMSEA = 0.08; NNFI = .95; AIC = 330.62/χ2(48) = 205.66, p < .001, CFI = .98; RMSEA = 0.07; NNFI = .97; AIC = 265.66 – Two-factor model (anxiety-comfort/depression-enthusiasm): χ2(53) = 1722.63, p < .001, CFI = .84; RMSEA = 0.23; NNFI = .80; AIC = 1772.63/χ2(53) = 1784.56, p < .001, CFI = .88; RMSEA = 0.23; NNFI = .85; AIC = 1834.56 – Two-factor model (positive/negative): χ2(53) = 665.01, p < .001, CFI = .92; RMSEA = 0.14; NNFI = .91; AIC = 715.01/χ2(53) = 594.89, p < .001, CFI = .90; RMSEA = 0.21; NNFI = .87; AIC = 1421.07 – Three-factor model (negative affect/positive affect/pleasure-displeasure): χ2(51) = 1394.57, p < .001, CFI = .86; RMSEA = 0.21; NNFI = .82; AIC = 1448.57/χ2(51) = 1367.07, p < .001, CFI = .90; RMSEA = 0.21; NNFI = .87; AIC = 1421.07 – Single-factor model: χ2(54) = 1715.05, p < .001, CFI = .82; RMSEA = 0.22; NNFI = .78; AIC = 1763.05/χ2(54) = 1753.19, p < .001, CFI = .87; RMSEA = 0.23; NNFI = .84; AIC = 1801.19 Reliability (t1/t2): – Cronbach’s Alphas for anxiety: .74/.78 – Cronbach’s Alphas for comfort: .80/.83 – Cronbach’s Alphas for depression: .83/.85 – Cronbach’s Alphas for enthusiasm: .82/.85 (1990) to conceptualize affective well-being at work. The cor- relations between the factors were specified to be estimated freely. To guarantee the statistical identification of the meas- urement model, the variance of the factors was fixed at 1.00. Five-factor models were tested based on Warr’s alternative conceptualization of affective well-being and on the factorial validation studies of the IWP Multi-Affect Indicator, previously systematized. Model 1 (M1) supports a model of four correlated factors (anxiety, comfort, enthusiasm and depression), which are as- sumed to represent the four quadrants of emotional-affective states, based on the level of pleasure and activation as hypothe- sized by Warr (1990). Furthermore, this factor structure has demonstrated good adjustment in previous and recent studies (e.g., Mäkikangas et al., 2007). This model was used as a basis for comparison with the other models. Given the conceptualize- tion proposed by Warr, the emergence of these four basic fac- tors and their scores are considered of primary importance. Model 2 (M2) specifies a factor structure consisting of two correlated factors (anxiety-comfort and depression-enthusiasm) which were not only conceptualized by Warr (1990) but also found in other exploratory studies (e.g., Cifre & Salanova, 2002). Model 3 (M3) supports a factor structure composed of five  S. P. GONÇALVES ET AL. 709 Table 2. Items of the IWP Multi-Affect Indicator of affective well-being. Items Factor (quadrant) Factor (axis) Tense Anxious Worried Anxiety Comfortable Calm Relaxed Comfort Anxietya-comfort Depressed Melancholic Unhappy Depression Motivated Enthusiastic Optimistic Enthusiasm Depressiona-enthusiasm Note: aIn this case the negative items should be reversed. factors. It contains the four first-order factors hypothesized in Model 1 plus a general second-order factor. The hypothesis tested was that the four first-order factors are different dimen- sions of the same latent factor: the global affective well-being at work. Model 4 (M4) specifies a factor structure consisting of two factors that include both positive and negative affects, respect- tively. It is in line with Watson and Tellegen’s (1985) work and also with Warr and Parker’s (2010) recent proposals. Finally, Model 5 (M5) specifies a factor structure consisting only of a first-order factor. This model assumes that all items in the scale measure just one latent variable. One of the important phases when using confirmatory factor analysis is to assess the model’s general quality of adjustment. This is not, however, a consensual issue. Various authors refer to different cutoff values for the quality levels of adjustment (e.g., Bollen, 1990; Hu & Bentler, 1999), whereas others point up values more or less restrictive. Bollen (1990) considers the RMSEA values of <.08; GFI, NFI, and CFI > .90 to be acceptable. The authors Hu and Bentler (1999) believe that the PCFI and PGFI values above 0.6, RMSEA close to .06, and CFI and TLI near .95 reveal a good adjustment. The AMOS manual (SPSS, 2006) mentions CFI values above .90 and GFI values above .80. Marôco (2010) reports the following as reference values: X2 and p-value, the smaller the better; for the CFI, GFI and TLI values <0.8 reveals poor adjustment; [0.8; 0.9] values reveal poor adjustment; [0.0; 0.95] values show a very good adjustment; ≥0.95 shows a very good adjustment; RMSEA >0.10 means unacceptable adjust- ment: [0.05; 0.10] equal good adjustment and ≤0.05 very good adjustment; finally, the AIC is used for comparing models and the lower the better. The reference values presented in the literature refer to mod- els with excellent adjustment, which does not mean that values slightly below should be excluded (Marsh, Kit-Tai, & Wen, 2004). One must consider value combination instead of ex- cluding values that are just a notch bellow excellent. The values of our models are based on this reading. In addition, as stated by Howieson (2008: p. 222): Table 3. Descriptive statistics and it em-correlation matrix f o r the job-related affe c tive well-being scale. Descriptive statistics Correlation matrix M SD 2 3 4 5 6 7 8 9 10 11 12 1. Tense 2.95 1.15 .773** .641** –.358**–.425**–.426**.596**.575**.564** –.342** –.327**–.328** 2. Anxious 3.04 1.15 .667** –.304**–.366**–.383**.577**.562**.528** –.313** –.261**–.281** 3. Worried 3.33 1.21 –.257**–.320**–.334**.496**.456**.453** –.262** –.209**–.223** 4. Comfortable 3.26 1.21 .671**.664**–.337**–.289**–.309** .618** .614**.556** 5. Calm 3.55 1.24 .812**–.374**–.339**–.345** .562** .552**.558** 6. Relaxed 3.41 1.25 –.323**–.284**–.325** .541** .547**.543** 7. Depressed 2.46 1.30 .820**.727** –.361** –.314**–.354** 8. Melancholic 2.39 1.19 .770** –.369** –.323**–.365** 9. Unhappy 2.32 1.33 –.390** –.345**–.377** 10. Motivated 3.51 1.32 .862** .750** 11. Enthusiastic 3.46 1.30 .796** 12. Optimistic 3.63 1.36 – N ote: **p < .05. M = Mean, SD = Standard Deviation 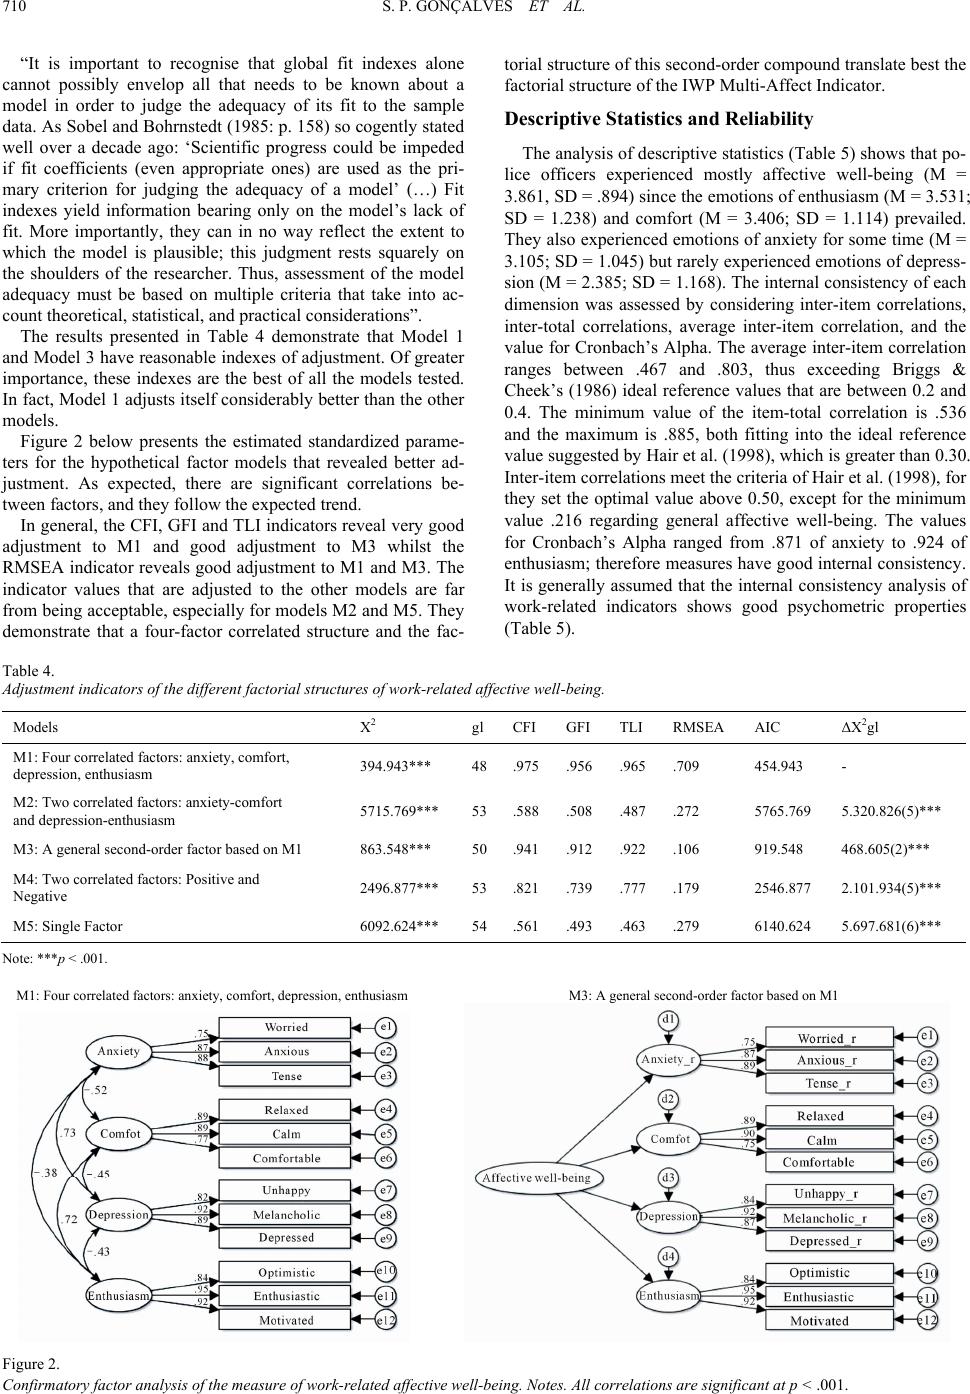 S. P. GONÇALVES ET AL. 710 “It is important to recognise that global fit indexes alone cannot possibly envelop all that needs to be known about a model in order to judge the adequacy of its fit to the sample data. As Sobel and Bohrnstedt (1985: p. 158) so cogently stated well over a decade ago: ‘Scientific progress could be impeded if fit coefficients (even appropriate ones) are used as the pri- mary criterion for judging the adequacy of a model’ (…) Fit indexes yield information bearing only on the model’s lack of fit. More importantly, they can in no way reflect the extent to which the model is plausible; this judgment rests squarely on the shoulders of the researcher. Thus, assessment of the model adequacy must be based on multiple criteria that take into ac- count theoretical, statistical, and practical considerations”. The results presented in Table 4 demonstrate that Model 1 and Model 3 have reasonable indexes of adjustment. Of greater importance, these indexes are the best of all the models tested. In fact, Model 1 adjusts itself considerably better than the other models. Figure 2 below presents the estimated standardized parame- ters for the hypothetical factor models that revealed better ad- justment. As expected, there are significant correlations be- tween factors, and they follow the expected trend. In general, the CFI, GFI and TLI indicators reveal very good adjustment to M1 and good adjustment to M3 whilst the RMSEA indicator reveals good adjustment to M1 and M3. The indicator values that are adjusted to the other models are far from being acceptable, especially for models M2 and M5. They demonstrate that a four-factor correlated structure and the fac- torial structure of this second-order compound translate best the factorial structure of the IWP Multi-Affect Indicator. Descriptive Statistics and Reliability The analysis of descriptive statistics (Table 5) shows that po- lice officers experienced mostly affective well-being (M = 3.861, SD = .894) since the emotions of enthusiasm (M = 3.531; SD = 1.238) and comfort (M = 3.406; SD = 1.114) prevailed. They also experienced emotions of anxiety for some time (M = 3.105; SD = 1.045) but rarely experienced emotions of depress- sion (M = 2.385; SD = 1.168). The internal consistency of each dimension was assessed by considering inter-item correlations, inter-total correlations, average inter-item correlation, and the value for Cronbach’s Alpha. The average inter-item correlation ranges between .467 and .803, thus exceeding Briggs & Cheek’s (1986) ideal reference values that are between 0.2 and 0.4. The minimum value of the item-total correlation is .536 and the maximum is .885, both fitting into the ideal reference value suggested by Hair et al. (1998), which is greater than 0.30. Inter-item correlations meet the criteria of Hair et al. (1998), for they set the optimal value above 0.50, except for the minimum value .216 regarding general affective well-being. The values for Cronbach’s Alpha ranged from .871 of anxiety to .924 of enthusiasm; therefore measures have good internal consistency. It is generally assumed that the internal consistency analysis of work-related indicators shows good psychometric properties (Table 5). Table 4. Adjustment indicators of the different factorial structures of work-related affective well-being. Models X2 gl CFI GFI TLI RMSEA AIC ΔX2gl M1: Four correlated factors: anxiety, comfort, depression, enthusiasm 394.943*** 48 .975 .956 .965 .709 454.943 - M2: Two correlated factors: anxiety-comfort and depression-enthusiasm 5715.769*** 53 .588 .508 .487 .272 5765.769 5.320.826(5)*** M3: A general second-order factor based on M1 863.548*** 50 .941 .912 .922 .106 919.548 468.605(2)*** M4: Two correlated factors: Positive and Negative 2496.877*** 53 .821 .739 .777 .179 2546.877 2.101.934(5)*** M5: Single Factor 6092.624*** 54 .561 .493 .463 .279 6140.624 5.697.681(6)*** Note: ***p < .001. M1: Four correlated factors: anxiety, comfort, depression, enthusiasm M3: A general second-order factor based on M1 Figure 2. Confirmatory factor analysis of the measure of work-related affective well-being. Notes. All correlations are significant at p < .001.  S. P. GONÇALVES ET AL. 711 Table 5. Cronbach’s Alphas, inter-item and total-item correlations, and descriptive statistics. Inter-Item Correlations Total-Item Correlations Dimension1 No. Items Cronbach’s Alpha Min Max Inter-Item Average Correlations Min Max M2 SD MinMax Anxiety 3 .871 .640 .773 .693 .693 .793 3.105 1.045 1.006.00 Comfort 3 .883 .665 .813 .716 .702 .815 3.406 1.114 1.006.00 Depression 3 .912 .730 .824 .715 .785 .857 2.385 1.168 1.006.00 Enthusiasm 3 .924 .750 .861 .803 .801 .885 3.531 1.238 1.006.00 Affective well-being 12 .913 .216 .866 .467 .536 .696 3.861 .894 1.006.00 Note: M = Mean, SD = Standard Deviation; Min = Minimum; Max = Maximum;1Scale response from 1 to 6; composite variables based on the average of the correspond- ing items for each factor; Scale response from 1 to 5; 2Higher values translate higher levels of the dimension. Discussion and Conclusions The IWP Multi-Affect Indicator was put forward as the fac- torial validation of the job-related affective well-being scale. The validation was performed in three steps. First, the psycho- metric parameters were estimated for different types of items. Second, the adjustment (goodness of fit) of the basic model was compared with the adjustment of several alternative models. Finally, additional tests were conducted with the aim of im- proving the adjustment of the hypothesized factor models that had shown better adjustments in the previous step. The analysis demonstrated that the best factorial solution for affective well-being at work is the four factors one: depression, comfort, anxiety and enthusiasm, as stated by Mäkikangas et al. (2007). The solution of a general second-order factor also showed acceptable adjustment values. It suggested that the above four factors are different dimensions of the same latent factor: general work-related affective well-being, as already proposed by Warr (1990; Warr & Parker, 2010). These results reinforce the multi-dimensionality of work-related affective well-being, as already suggested by several authors who advocate the abandonment of one-dimensional vision to represent emotional experiences at work (e.g., Daniels et al., 1997; Warr, 2002; Van Horn et al., 2004), where “measures predicted upon multidi- mensional models may help to provide a more precise descrip- tion of the relationship between work-related affective well- being and other organizational phenomena” (Daniels et al., 1997: p. 137). The factor structure comprises two factors, i.e., negative and positive affects, thus revealing itself to be the second best model according to the study by Mäkikangas et al. (2007). However, our study did not reach acceptable values; the two- factor structure—anxiety-comfort and depression-enthusiasm— did not reach acceptable adjustment values. This structure has shown inconsistent results; the results of Sevastos et al. (1992), for example, support it, yet the results of Mäkikangas et al. (2007) do not. It should be examined in future studies. Finally, as theoretically expected, the single-factor model did not pre- sent a good adjustment. These last two factorial structures proved to be the least adjusted structures of data and revealed the lowest adjustment value indicators. In summary, the estimated parameters indicate that two of the factorial structures reported are valid and can be used in investigations that need to measure work-related affective well-being. Although further studies are necessary to examine other types of validity (e.g. predictive validity), this study con- tributes to reducing the lack of scales with good psychometric parameters in Portugal, particularly when it comes to assessing well-being at work. This tool would benefit from the broaden- ing of the validation process of its sample to other more differ- entiated samples, so as to generalize its use to the Portuguese working population. Until now there were no studies on the factorial analysis of Warr’s scale based on a Portuguese sample, although the scale and some dimensions have already been used on Portuguese samples (e.g., Chambel & Curral, 2005). The present study and its factorial analysis have revealed that work-related affective well-being, as general affective well- being, may be understood as a multi-dimensional phenomenon. Thus, broader conceptualizations of affective well-being may help occupational health professionals develop a correspond- ingly extensive repertoire of intervention strategies. In this sense, as previously mentioned, these conceptualizations enrich both the theory and practice of occupational psychology. The IWP Multi-Affect Indicator supports this multi-dimensional approach, and so it can potentially capture subtleties, complexi- ties and changes in the experience of work that general, uni- dimensional measures can/may not. Acknowledgements This work was funded by The Foundation for Science and Technology (FCT—Lisbon, Portugal) through a PhD scholar- ship granted to the first author (ref. SFRH/BD/38801/2007). The authors thank Isabel Carvalho for providing the Portu- guese version of the Multi-Affect Indicator used in this work. References Bindl, U. K., Warr, P. B., Parker, S. K., & Inceoglu, I. (submitted for presentation). Multiple patterns of affect-behavior associations. An- nual SIOP Conference, Atlanta. Bollen, K. A. (1990). A comment on model evaluation and modifica- tion. Multivariate B ehavioral Research, 25, 181-185. doi:10.1207/s15327906mbr2502_5 Briggs, S. R., & Cheek, J. M. (1986). The role of factor analysis in the development and evaluation of personality scales. Journal of Per- sonality, 54, 106-148. doi:10.1111/j.1467-6494.1986.tb00391.x Chambel, M. J., & Curral, L. (2005). Stress in academic life: Work characteristics as predictors of student well-being and performance. Applied Psychology: An International Review, 54, 135-147. doi:10.1111/j.1464-0597.2005.00200.x Cifre, E., & Salanova, M. (2002). Multidimensionality and bipolarity of a Spanish Version of Warr’s (1990) well-being measure. The Journal  S. P. GONÇALVES ET AL. 712 of Psychology, 136, 69-74. doi:10.1080/00223980209604139 Daniels, K. (2000). Measure of five aspects of affective well-being. Human Relations, 53, 275-294. Daniels, K., Brough, P., Guppy, A., Peters-Bean, K. M., & Weather- stone, L. (1997). A note on a modification to Warr’s measures of work-related affective well-being. Journal of Occupational and Or- ganizational Psychology, 70, 129-138. doi:10.1111/j.2044-8325.1997.tb00638.x Hair, J. F. Jr. et al. (1998). Multivariate data analysis. New Jersey: Prentice-Hall International, Inc. Howieson, W. B. (2008). A quantitative evaluation of the reformulated 1996 path-goal theory of work unit leadership via structural equa- tion modeling. Edinburgh: University of Edinburgh. Hu, L.-T., & Bentler, P. (1999). Cutoff criteria for fit indexes in co- variance structure analysis: Coventional criteria versus new alterna- tives. Structural Equation Modeling, 6, 1-55. doi:10.1080/10705519909540118 Keyes, C. L. M. (2005). Mental illness and/or mental health? Investi- gating axioms of the complete state model of health. Journal of Con- sulting and Clinical Psychology , 73, 539-548. doi:10.1037/0022-006X.73.3.539 Mäkikangas, A., Feldt, T., & Kinnunen, U. (2007). Warr’s scale of job-related affective well-being: A longitudinal examination of its structure and relationships with work characteristics. Work & Stress, 21, 197-219. doi:10.1080/02678370701662151 Marôco, J. (2010). Structural equation analysis: Theoretical founda- tions, software & application s. Pêro Pinheiro: Report Number, Lda. Marsh, H. W., Kit-Tai, H., & Wen, Z. L. (2004). In search of golden rules: Comment on hypothesis testing approaches to setting cutoff values for fit indexes and dangers in overgeneralizing Hu and Bentler’s (1999) findings. Structural Equation Modeling, 11, 320- 341. doi:10.1207/s15328007sem1103_2 Muchinsky, P. M. (2000). Emotions in the workplace: The neglect of organizational behavior. Journal of Organizational Behaviour, 21, 801-805. doi:10.1002/1099-1379(200011)21:7<801::AID-JOB999>3.0.CO;2- A Russell, J. A. (1980). A circumplex model of affect. Journal of Person- ality and Social Psychology, 39, 1161-1178. doi:10.1037/h0077714 Sevastos, P., Smith, L., & Cordery, J. L. (1992). Evidence on the reli- ability and construct validity of Warr’s (1990) well-being and mental health measures. Journal of Occupational and Organizational Psy- chology, 65, 33-49. doi:10.1111/j.2044-8325.1992.tb00482.x SPSS (2006). Guide on how to u s e the AMOS. Lisboa: SPPSS. Van Horn, J. E., Taris, T. W., Schaufeli, W. B., & Schreurs, P. J. G. (2004). The structure of occupational well-being: A study among Dutch teachers. Journal of Occupational and Organizational Psy- chology, 77, 365-375. doi:10.1348/0963179041752718 Warr, P., & Parker, S. (2010). IWP multi-affect Indicator. Sheffield: Institute of Work Psychology, University of Sheffield. Paper no pub- lished. Warr, P. (1987). Work, unemployment, and mental health. Oxford: Oxford University Press. Warr, P. (1990). The measurement of well-being and other aspects of mental health. Journal o f Oc cu pa ti onal Psychology, 63, 193-210. doi:10.1111/j.2044-8325.1990.tb00521.x Warr, P., Cook, J., & Wall, T. (1979). Scales for the measurement of some work attitudes and aspects of psychological well-being. Jour- nal of Occupational Psychology, 52, 129-148. doi:10.1111/j.2044-8325.1979.tb00448.x
|