 Journal of Information Security, 2011, 2, 195-201 doi:10.4236/jis.2011.24019 Published Online October 2011 (http://www.SciRP.org/journal/jis) Copyright © 2011 SciRes. JIS 195 Tanimoto Based Similarity Measure for Intrusion Detection System Alok Sharma, Sunil Pranit Lal* Faculty of Science, Technology and Environment, University of the South Pacific, Suva, Fiji E-mail: *lal_s@usp.ac.fj Received September 2, 2011; revised September 21, 2011; accepted October 4, 2011 Abstract In this paper we introduced Tanimoto based similarity measure for host-based intrusions using binary feature set for training and classification. The k-nearest neighbor (kNN) classifier has been utilized to classify a given process as either normal or attack. The experimentation is conducted on DARPA-1998 database for intrusion detection and compared with other existing techniques. The introduced similarity measure shows promising results by achieving less false positive rate at 100% detection rate. Keywords: Intrusion Detection, kNN Classifier, Similarity Measure, Anomaly Detection, Tanimoto Similarity Measure 1. Introduction Intrusion detection is an important area in the field of computers and security, and in the recent years it has generated considerable interest in the research commu- nity. The intrusion detection system (IDS) can be subdi- vided into two main categories namely, signature-based detection and behavior-based detection. In this paper we focus on behavior-based detection which is also known as anomaly detection. An important feature of anomaly detection is that it can detect unknown attacks. Behavior modeling can be done by either modeling the user-be- havior or process. The system call data is one of the most common types of data used for modeling process behav- ior. Host-based anomaly detection systems mostly focus on system call sequences with the assumption that a ma- licious activity results in an abnormal trace. Such data can be collected by logging the system calls using oper- ating system utilities e.g. Linux strace or Solaris Basic Security Module (BSM). In this framework, it is as- sumed that the normal behavior can be profiled by a set of patterns of sequence of system calls. Any deviation from the normal pattern is termed as intrusion in this framework. An intrusion detection system needs to learn the normal behavior patterns from the previously col- lected data and this is normally accomplished by data mining or machine learning techniques. The problem of intrusion detection thus boils down to a supervised clas- sification problem to identify anomalous sequences, which are measurably different from the normal behavior. The system call sequences of normal instances are used as the training set. Though anomaly-based IDS can de- tect unknown attacks, it suffers from having unaccept- able false-positive rate [1]. This is because of the fact that it is hard to perfectly model a normal behavior. Unlike the traditional pattern recognition approach for classification, the aim in the present context is not only to achieve high accuracy rate but also to minimize the false positive rate. In recent years, a lot of research ac- tivities in anomaly detection focus on learning process behaviors and building the profiles with system call se- quences as data sources. Various machine learning techniques such as Support Vector Machines [2] and Neural Network [3] have been proposed for designing intelligent intrusion detection systems. Interested readers are directed to Tsai et al. [4] for a comprehensive overview on this subject. In this paper we use the kNN classification scheme [5-7] as an efficient means for intrusion detection. In carrying out the classification, it is a common practice to use features represented as frequency of system calls observed. While this approach has produced outstanding results [7], we are more interested in reducing the computational cost associated with classification task. Instead of represent- ing features as frequency, which involves repetitive counting, we only consider absence or presence of a sys- tem call and represent it as a single bit of data. Needless to say binary representation consumes less storage space  A. SHARMA ET AL. 196 compared to integer representation. To this end, we pro- pose a Tanimoto binary similarity measure, and empiri- cally evaluate and compare its performance. To the best of authors’ knowledge the result is better than other bi- nary similarity schemes for intrusion detection reported in literature. 2. A Brief Description of the Preceding Work In this section we briefly describe the research work on behavior-based intrusion detection procedures. Denning [8] did a pioneering work on behavior-based intrusion detection. In this approach profiles of subjects are learnt and statistical methods are used to compute deviations from the normal behavior. Lane and Brodly [9] propose another approach for capturing a user’s behavior. A da- tabase of sequences of UNIX commands that normally a user issues, is maintained for each user. Any new com- mand sequence is compared with this database using a similarity measure. Forrest et al. [10,11] introduce a sim- ple anomaly detection method based on monitoring the system calls invoked by active and privileged processes. The profile of normal behavior is built by enumerating all fixed length of unique and contiguous system calls that occur in the training data, and unmatched sequences in actual detection are considered abnormal. A similar approach is followed by Lee et al. [12], but they make use of a rule learner RIPPER, to form the rules for clas- sification. Lee and Stolfo [13] use data mining approach to study a sample of system call data to characterize the sequences contained in normal data by a small set of rules. In monitoring and detection, the sequences violat- ing those rules are treated as anomalies [14]. Warrender et al. [15] propose Hidden Markov Model (HMM) me- thod for modeling and evaluating invisible events based on system calls. It is believed that the entire sequence of system calls in a process need not exhibit intrusive be- havior, but few subsequences of very small lengths may possess the intrusive characteristics. Rawat et al [16] showed using rough set technique that the intrusive be- havior in a process is very localized. Sharma et al. [7] introduce kernel based similarity measure for host-based intrusions. They have used kNN classifier to classify a process as either normal or abnormal. Most of the IDSs that model the behavior of processes in terms of subsequences, take fixed-length, contiguous subsequences of system calls. One potential drawback of this approach is that the size of the database that contains fixed-length contiguous subsequences increases expo- nentially with the length of the subsequences. Wespi et al. [17] propose a variable length subsequence approach. Asaka et al. [18] develop another approach based on the discriminant method in which an optimal classification surface is first learned from samples of the properly la- beled normal and abnormal system call sequences. Wang et al. [19] develop another Principle Component Analy- sis based method for anomaly intrusion detection with less computation efforts. Tandon and Chan [20] propose to consider system calls arguments and other parameters, along with the sequences of system calls. They make use of the variant of a rule learner LERAD (Learning Rules for Anomaly Detection). In order to detect the deviation of anomalous system call sequences from the normal set of sequences, Liao and Vemuri [5] used a similarity measure based on the frequencies of system calls used by a program (process), rather than the temporal ordering. Their approach draws an analogy between text categorization and intrusion detection, such that each system call is treated as a word and a set of system calls generated by a process as a document. They used a ‘bag of system calls’ representa- tion. Liao and Vemuri [5,21] adopted this representation to profile the behavior according to the trace of each process independently and a kNN method is used for classification. In this method, each system call is treated as a word and a collection of system calls during the execution of a process is treated as a document. The sys- tem call trace of a process is converted into a vector and cosine similarity measure is used to calculate the similar- ity among processes. In another study [22] by the same group, the Robust Support Vector Machine (RSVM) is applied to anomaly-based IDS. Recently, the emphasis of this RSVM study is on exhibiting the effectiveness of the method in the presence of noisy data. Rawat et al. [6] propose anomaly-based IDS. A new similarity measure called binary weighted cosine (BWC) is proposed and it is shown that by kNN classifier with the new measure, one can reduce the false positive rate substantially with- out sacrificing the detection rate. The authors have shown that by defining appropriate similarity measures, the detection by simple kNN can be as efficient as the sophisticated classification techniques like SVMs. Sharma et al. [7] propose a very efficient anomaly based IDS. They have introduced kernel based similarity measure and showed that it can capture similarity at very accurate level. They have used kNN as their classification scheme. The success of any such classification is hinged on two important aspects the similarity measure and the classi- fication scheme. 3. Notations and Descriptions In the remaining discussion S = {s1, s2, s3,…, sm} de- notes a set of unique system calls where m = |S| is the number of system calls. The training set is defined Copyright © 2011 SciRes. JIS  A. SHARMA ET AL. 197 ,as a set of labeled sequences where Zi is an input sequence of system calls or a process, i is a corresponding class label denoting 0 for “normal” label and 1 for “intrusion” label and S* is the set of all finite strings of symbol of S. In this representa- tion, the ordering information of adjacent system calls in the input sequence is not considered to be significant and only the frequency of each system call is preserved. Given the data set * {,|;{0 ii ii ZcZS c 1} } c , the goal of the learning algorithm is to find a classifier h: S* → {0, 1} that maximizes de- tection rate and minimizes false positive rate. The vector-space model of Information Retrieval (IR) is also often used to represent the set of processes. A process is depicted as a binary vector to represent the occurrences of system call. The value 1 represents the occurrences of a system call in a process and its absence is represented by 0. Thus we define Zbi the binary repre- sentation of Zi, where the entries of Zbi is 1, if the corre- sponding system call is present, and 0, otherwise. 4. Tanimoto Similarity Measure The concept of Tanimoto coefficient [23], is presented here for binary similarity. It is an extension of Jacquard coefficient, which is a binary similarity measure. Given two vectors of binary features, Zbi and, Zbj the binary Tanimoto coefficient is represented as 2 2 BT(), )ij iji j iji Zb Zb bZb,ZZ (TZ j bZbZbZb (1) where is the Euclidean norm. || || The Jacquard and Tanimoto coefficients have been ex- tensively applied in several fields ranging from studying the diversity of species in ecosystem [24], to measuring similarity between chemical compounds [25]. In this paper we experiment using Tanimoto coefficient to measure the similarity between processes represented as binary features. 5. Binary Tanimoto Weighted Cosine (BTWC) Similarity Measure In order to define BTWC similarity measure, we first define cosine similarity measure [5]. The cosine similar- ity measure λ(Zi, Zj) between any two processes i and Zj is defined as follows. . (, ij Z)(,) |||| . |||| ij ij ij ZZ sSim ZZZCo (2) Z The motive behind multiplying binary Tanimoto and CosSim is that CosSim(Zi, Zj) measures the similarity based on the frequency and binary Tanimoto is the weight associated with i and Zj. In other words, bi- nary Tanimoto tunes the similarity score CosSim(Zi, Zj) according to the number of similar and dissimilar system calls between the two processes. The BTWC similarity measure can be given as BTWC(,)(,) (,) iji jij ZT ZbZbCosSimZZ (3) Therefore, the similarity measure BTWC takes fre- quency and the number of common system calls into consideration while calculating similarity between two processes. 6. K-Nearest Neighbors with the Similarity Measures The kNN classifier is a generalized form of NN classifier. In this approach the behavior of a new process is classi- fied by collecting the majority of k closest training proc- esses. The average of these majority k measures is com- puted which is compared with the threshold value to de- termine if the process is normal or attack. The pseudo code of kNN procedure with similarity measure is as follows. Let the training set X has n processes such that j Z . Let P be any new process. for j = 1 to n sm j = similarity_measure(P, )1; end smk = find_top_k(smj); avg = average(smk); if avg > threshold P = ‘normal’ else P = ‘attack’ end 7. An Illustration In this section, we analyze the proposed scheme with the help of an example. To illustrate, consider two training processes Z1 and Z2 associated with 10 unique system call . Let also consider a test process S to measure the similarity with the training processes. The processes and the unique system call set are defined as fol- lows: S {auditon, chdir, close, creat, kill, login, mkdir, stat, su, sysinfo} S 1{login, stat, stat, stat, stat, auditon, auditon, auditon, auditon} Z 1In place of similarity_measure, equation 1 or 3 will be used. Copyright © 2011 SciRes. JIS  A. SHARMA ET AL. 198 2{login, close, su, sysinfo, stat, chdir, chdir, mkdir, creat, kill} Z {login, auditon, auditon, stat, mkdir, close, close, creat, kill} Z To find the similarity between a test and train proc- esses, we observe that there are only three common sys- tem calls between and 1 . However, there are six common system calls between and 2 . This in- ferred that there is more similarity between and 2 . Therefore, hypothetically 21 Si,Sim)m()( , ZZ Co Z, where is any similarity measure function. Computing the similarity score between these processes using , binary Tanimoto and BTWC similarity measures, we get, Sim sSim 1 (,) 0.6276CosSim ZZ 1 BT( ,)0.4286ZZ 1 BTWC( ,)0.2690ZZ 2 ( ,)0.5604CosSim ZZ 2 BT( ,)0.6000ZZ 2 BTWC( ,)0.3363ZZ According to similarity measure, CosSim is more similar to 1 than to 2 , since 1 2. However, this contradicts with the hy- pothesis. On the other hand, using binary Tanimoto and BTWC similarity measures, Z appeared to be more simi- lar to (, )CosSZ Zim (,CosSim Z 2 )Z than to 1 , since 21 BT( ,)(,)BT ZZZ and 21 BTWC( ,)BTWC( ,) ZZZ. The similarity scores measured by binary Tanimoto and BTWC validate the hypothesis. Therefore, it is more likely that by using these two techniques, better results for intrusion detec- tion problem can be achieved. In order to see the application of kNN classifier with binary Tanimoto and BTWC similarity measures, let us assume a third training process 3 , such that BT( , 3 and 2 )0.5ZBTWC( ,)ZZ 0.3 . Suppose the thre- shold for binary Tanimoto is BT 0.58 and for BTWC is BTWC 0.32 . If the classification procedure to label a process into either as attack or normal is conducted by comparing the highest similarity score then by binary Tanimoto the process will be classified as normal since, 2BT BT( ,)ZZ0.6 and by BTWC it will also be classified as normal since, 2 BT BTWC WC (,)0ZZ .3 3 6 3 . This could give statistically unstable results as the classification is dominated by a single training proc- ess (with the highest similarity score). A better classifi- cation scheme would be to evaluate the average of top scores to arrive to the labeling of processes. If k2k then for binary Tanimoto using kNN classifier the aver- age of top 2 similarity scores would be BT avg . This means that the process is now classified as an attack since, BT avg . In a similar way, process will be classified as an attack for BTWC using kNN classifier since, BTWC 0.3181avg . Therefore binary Tanimoto and BTWC similarity measures with kNN classifier are expected to give statistically stable results by comparing the average similarity measure of top processes. k 8. Experimentation In order to perform experimentation we use BSM audit logs from the 1998 DARPA data [26] for training and testing of our algorithm. This is the same data set used in previous research efforts [5-7] and thus it enables us compare the results. There are 50 unique system calls in the training data. All the 50 system calls are shown in Table 1. In this dataset about 2000 normal sessions reported in the four days of data and the training data set consists of 606 unique processes. There are 412 normal sessions on the fifth day and we extract 5285 normal processes from these sessions. We use these 5285 normal processes as testing data. In order to test the detection capability of our method, we considered 54 intrusive sessions as test data. Table 2 lists these attacks. A number in the begin- ning of the name denotes the week and day followed by the name of the session (attack). Table 1. List of 50 unique system calls. access, audit, auditon, chdir, chmod, chown, close, creat, ex- ecve, exit, fchdir, fchown, fcntl, fork, fork1, getaudit, getmsg, ioctl, kill, link, login, logout, lstat, memcntl, mkdir, mmap, munmap, oldnice, oldsetgid, oldsetuid, oldutime, open, path- donf, pipe, putmsg, readlink, rename, rmdir, setaudit, setegid, seteuid, setgroups, setpgrp, setrlimit, stat, statvfs, su, sysinfo, unlink, vfork Table 2. List of 54 attacks used in test data. 1.1_it_ffb clear, 1.1_it_format_clear, 2.2_it_ipsweep, 2.5_it_ftpwrite, 2.5_it_ftpwrite_test, 3.1_it_ffb_clear, 3.3_it_ftpwrite, 3.3_it_ftpwrite_test, 3.4_it_warez, 3.5_it_warezmaster, 4.1_it_080520warezclient, 4.2_it_080511warezclient, 4.2_it_153736spy, 4.2_it_153736spy_test, 4.2_it_153812spy, 4.4_it_080514warezclient, 4.4_it_080514warezclient_test, 4.4_it_175320warezclient, 4.4_it_180326warezclient, 4.4_it_180955warezclient, 4.4_it_181945warezclient, 4.5_it_092212ffb, 4.5_it_141011loadmodule, 4.5_it_162228loadmodule, 4.5_it_174726loadmodule, 4.5_it_format, 5.1_it_141020ffb, 5.1_it_174729ffb_exec, 5.1_it_format, 5.2_it_144308eject_clear, 5.2_it_163909eject_clear, 5.3_it_eject_steal, 5.5_it_eject, 5.5_it_fdformat, 5.5_it_fdformat_chmod, 6.4_it_090647ffb, 6.4_it_093203eject, 6.4_it_095046eject, 6.4_it_100014eject, 6.4_it_122156eject, 6.4_it_144331ffb, test.1.2_format, test.1.2_format2, test.1.3_eject, test.1.3_httptunnel, test.1.4_eject, test.2.1_111516ffb, test.2.1_format, test.2.2_xsnoop, test.2.3_ps, test.2.3_ps_b, test.2.5_ftpwrite, test.2.4_eject_a, test.2.2_format1 Copyright © 2011 SciRes. JIS 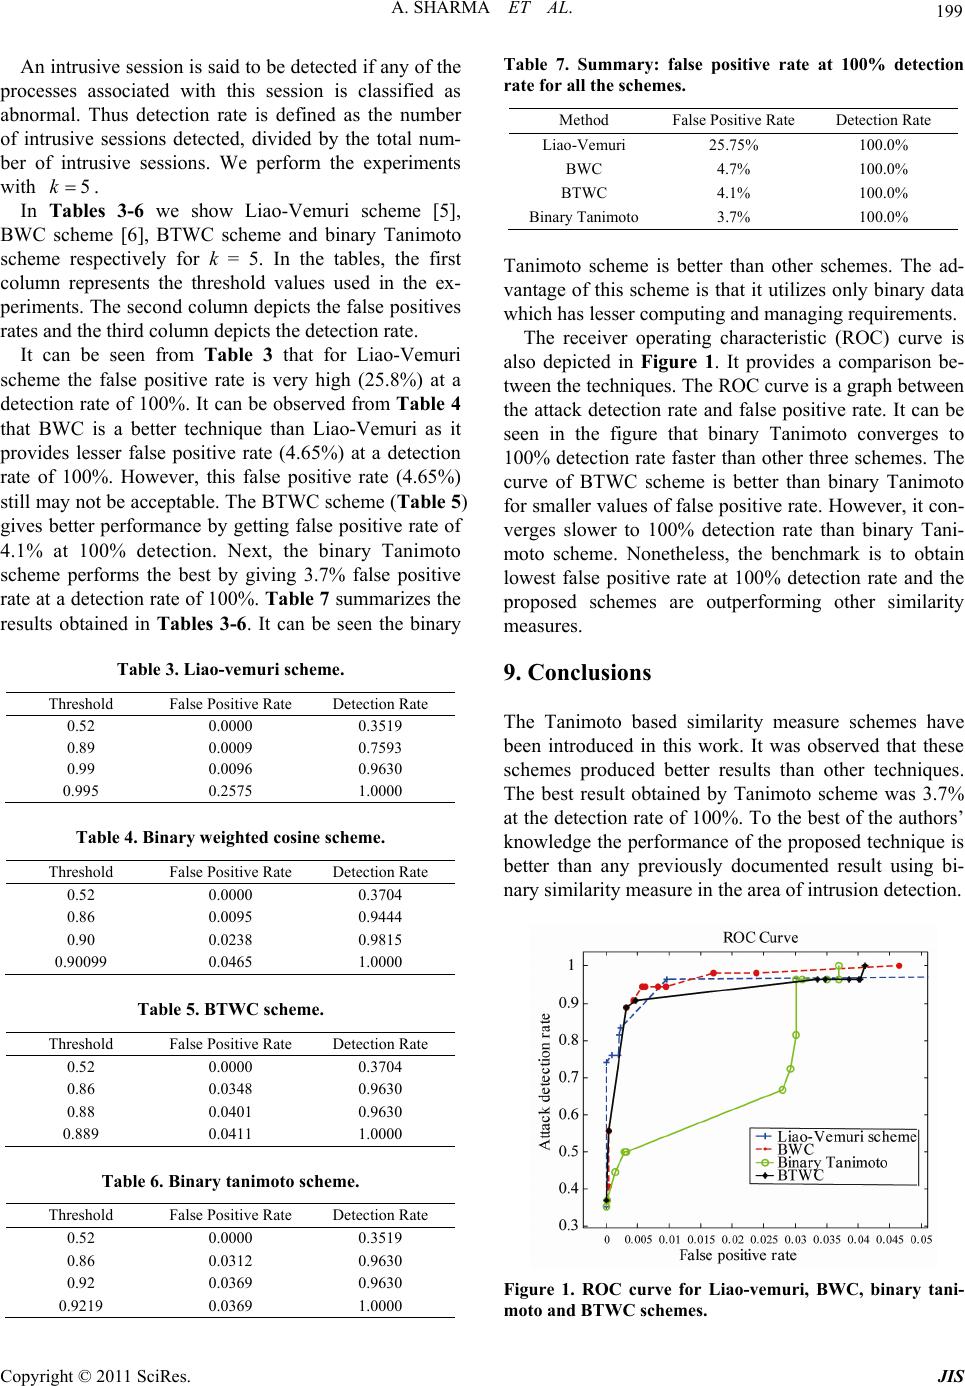 199 A. SHARMA ET AL. An intrusive session is said to be detected if any of the processes associated with this session is classified as abnormal. Thus detection rate is defined as the number of intrusive sessions detected, divided by the total num- ber of intrusive sessions. We perform the experiments with . 5k In Tables 3-6 we show Liao-Vemuri scheme [5], BWC scheme [6], BTWC scheme and binary Tanimoto scheme respectively for k = 5. In the tables, the first column represents the threshold values used in the ex- periments. The second column depicts the false positives rates and the third column depicts the detection rate. It can be seen from Table 3 that for Liao-Vemuri scheme the false positive rate is very high (25.8%) at a detection rate of 100%. It can be observed from Table 4 that BWC is a better technique than Liao-Vemuri as it provides lesser false positive rate (4.65%) at a detection rate of 100%. However, this false positive rate (4.65%) still may not be acceptable. The BTWC scheme (Table 5) gives better performance by getting false positive rate of 4.1% at 100% detection. Next, the binary Tanimoto scheme performs the best by giving 3.7% false positive rate at a detection rate of 100%. Table 7 summarizes the results obtained in Tables 3-6. It can be seen the binary Table 3. Liao-vemuri scheme. Threshold False Positive Rate Detection Rate 0.52 0.0000 0.3519 0.89 0.0009 0.7593 0.99 0.0096 0.9630 0.995 0.2575 1.0000 Table 4. Binary weighted cosine scheme. Threshold False Positive Rate Detection Rate 0.52 0.0000 0.3704 0.86 0.0095 0.9444 0.90 0.0238 0.9815 0.90099 0.0465 1.0000 Table 5. BTWC scheme. Threshold False Positive Rate Detection Rate 0.52 0.0000 0.3704 0.86 0.0348 0.9630 0.88 0.0401 0.9630 0.889 0.0411 1.0000 Table 6. Binary tanimoto scheme. Threshold False Positive Rate Detection Rate 0.52 0.0000 0.3519 0.86 0.0312 0.9630 0.92 0.0369 0.9630 0.9219 0.0369 1.0000 Table 7. Summary: false positive rate at 100% detection rate for all the schemes. Method False Positive Rate Detection Rate Liao-Vemuri 25.75% 100.0% BWC 4.7% 100.0% BTWC 4.1% 100.0% Binary Tanimoto 3.7% 100.0% Tanimoto scheme is better than other schemes. The ad- vantage of this scheme is that it utilizes only binary data which has lesser computing and managing requirements. The receiver operating characteristic (ROC) curve is also depicted in Figure 1. It provides a comparison be- tween the techniques. The ROC curve is a graph between the attack detection rate and false positive rate. It can be seen in the figure that binary Tanimoto converges to 100% detection rate faster than other three schemes. The curve of BTWC scheme is better than binary Tanimoto for smaller values of false positive rate. However, it con- verges slower to 100% detection rate than binary Tani- moto scheme. Nonetheless, the benchmark is to obtain lowest false positive rate at 100% detection rate and the proposed schemes are outperforming other similarity measures. 9. Conclusions The Tanimoto based similarity measure schemes have been introduced in this work. It was observed that these schemes produced better results than other techniques. The best result obtained by Tanimoto scheme was 3.7% at the detection rate of 100%. To the best of the authors’ knowledge the performance of the proposed technique is better than any previously documented result using bi- nary similarity measure in the area of intrusion detection. Figure 1. ROC curve for Liao-vemuri, BWC, binary tani- moto and BTWC schemes. Copyright © 2011 SciRes. JIS  A. SHARMA ET AL. 200 It is worth highlighting that a binary representation of features captures less detailed information about a proc- ess compared with features represented as frequency. Even with this limitation, we obtained good results, which gives validity to our proposed approach. 10. Acknowledgements The authors would like to thank the reviewers and the Editor for providing constructive comments about the paper. 11. References [1] T. Lane and C. E. Brodley, “Temporal Sequence Learn- ing and Data Reduction for Anomaly Detection,” In Pro- ceedings of 5th ACM Conference on Computer & Com- munication Security, San Francisco, November 3-5, 1998, pp. 150-158. [2] Y. Yi, J. Wu and W. Xu, “Incremental SVM Based on Reserved Set for Network Intrusion Detection,” Expert Systems with Applications, Vol. 38, No. 6, 2011, pp. 7698- 7707. doi:10.1016/j.eswa.2010.12.141 [3] G. Wang, J. Hao, J. Ma and L. Huang, “A New Approach to Intrusion Detection Using Artificial Neural Networks and Fuzzy Clustering,” Expert Systems with Applications, Vol. 37, No. 9, 2010, pp. 6225-6232. doi:10.1016/j.eswa.2010.02.102 [4] C. F. Tsai, Y. F. Hsu, C. Y. Lin and W. Y. Lin, “Intrusion Detection by Machine Learning: A Review,” Expert Sys- tems with Applications, Vol. 36, No. 10, 2009, pp. 11994- 12000. doi:10.1016/j.eswa.2009.05.029 [5] Y. Liao and V. R. Vemuri, “Use of K-Nearest Neighbor Classifier for Intrusion Detection,” Computers & Security, Vol. 21, No. 5, 2002, pp. 439-448. doi:10.1016/S0167-4048(02)00514-X [6] S. Rawat, V. P. Gulati, A. K. Pujari and V. R. Vemuri, “Intrusion Detection Using Text Processing Techniques with a Binary-Weighted Cosine Metric,” Journal of In- formation Assurance and Security, Vol. 1, 2006, pp. 43- 50. [7] A. Sharma, A. K. Pujari and K. K. Paliwal, “Intrusion Detection Using Text Processing Techniques with a Ker- nel Based Similarity Measure,” Computers & Security, Vol. 26, No. 7-8, 2007, pp. 488-495. doi:10.1016/j.cose.2007.10.003 [8] D. E. Denning, “An Intrusion-Detection Model,” In Pro- ceedings of the 1986 IEEE Symposium on Security and Privacy (SSP ’86), IEEE Computer Society Pressm, 1990, pp. 118-133. [9] T. Lane and C. E. Brodly. “An Application of Machine Learning to Anomaly Detection,” In Proceeding of the 20th National Information System Security Conference, Baltimore, MD, 1997, pp. 366-377. [10] S. Forrest, S. A. Hofmeyr, A. Somayaji and T. A. Long- staff, “A Sense of Self for Unix Processes,” Proceedings of the 1996 IEEE Symposium on Research in Security and Privacy, Los Alamos, 1996, pp.120-128. [11] S. Forrest, S. A. Hofmeyr and A. Somayaji, “Computer Immunology,” Communications of the ACM, Vol. 40, No. 10, 1997, pp. 88-96. doi:10.1145/262793.262811 [12] W. Lee, S. Stolfo and P. Chan. “Learning Patterns from Unix Process Execution Traces for Intrusion Detection,” In Proceedings of the AAAI97 Workshop on AI Methods in Fraud and Risk Management, AAAI Press, Menlo Park, 1997, pp. 50-56. [13] W. Lee and S. Stolfo, “Data Mining Approaches for In- trusion Detection,” Proceedings of the 7th USENIX Secu- rity Symposium, Usenix Association, 1998, pp.79-94. [14] E. Eskin, A. Arnold, M. Prerau, L. Portnoy and S. Stolfo, “A Geometric Framework for Unsupervised Anomaly Detection: Detecting Intrusions in Unlabeled Data,” Ap- plications of Data Mining in Computer Security, Kluwer Academics Publishers, Berlin, 2002, pp. 77-102. [15] C. Warrender, S. Forrest and B. Pearlmutter, “Detecting Intrusions Using System Calls: Alternative Data Models,” Proceedings of 1999 IEEE Symposium on Security and Privacy, Oakland, 1999, pp. 133-145. [16] S. Rawat, V. P. Gulati and A. K. Pujari, “A Fast Host- Based Intrusion Detection System Using Rough Set The- ory,” Computer Science, Vol. 3700, No. 2005, 2005, pp. 144-161. doi:10.1007/11574798_8 [17] A. Wespi, M. Dacier and H. Debar, “Intrusion Detection Using Variable-Length Audit Trail Patterns,” Proceed- ings of the Third International Workshop on the Recent Advances in Intrusion Detection (RAID’2000), Toulouse, No. 1907, 2000. [18] M. Asaka, T. Onabuta, T. Inove, S. Okazawa and S. Goto, “A New Intrusion Detection Method on Discriminant Analysis,” IEICE Transaction on Information and Sys- tems E84D, Vol. 5, 2001, pp. 570-577. [19] W. Wang, X. Guan and X. Zhang, “A Novel Intrusion Detection Method Based on Principle Component Analy- sis in Computer Security,” Proceedings of the Interna- tional IEEE Symposium on Neural Networks, Dalian, Lecture Notes in Computer Science, Vol. 3174, No. 2004, 2004, pp. 657-662. doi:10.1007/978-3-540-28648-6_105 [20] G. Tandon and P. K. Chan, “Learning Useful System Call Attributes for Anomaly Detection,” Proceedings of the 18th International Florida Artificial Intelligence Re- search Society (FLAIRS) Conference, Clearwater Beach, 2005, pp. 405-410. [21] Y. Liao and V.R. Vemuri, “Using Text Categorization Techniques for Intrusion Detection,” Proceedings USE NIX Security 2002, San Francisco, 2002, pp. 51-59. [22] H. Wenjie, Y. Liao and V.R. Vemuri, “Robust Support Vector Machines for Anomaly Detection in Computer Se- curity,” In International Conference on Machine Learning, Los Angeles, 2003. [23] T. T. Tanimoto, “IBM Internal Report 17th,” November 1957. http://en.wikipedia.org/wiki/Jaccard_index for details. Copyright © 2011 SciRes. JIS  A. SHARMA ET AL. Copyright © 2011 SciRes. JIS 201 [24] J. A. Wallwork, “The Distribution and Diversity of Soil Fauna,” Academic Press, London. 1976. [25] P. Willett, “Chemical Similarity Searching,” Journal of Chemical Information and Computer Sciences, Vol. 38, 1998, pp. 983-996. doi:10.1021/ci9800211 [26] DARPA 1998 Data, “MIT Lincoln Laboratory,” 2007. http://www.ll.mit.edu/IST/ideval/data/data index.html
|