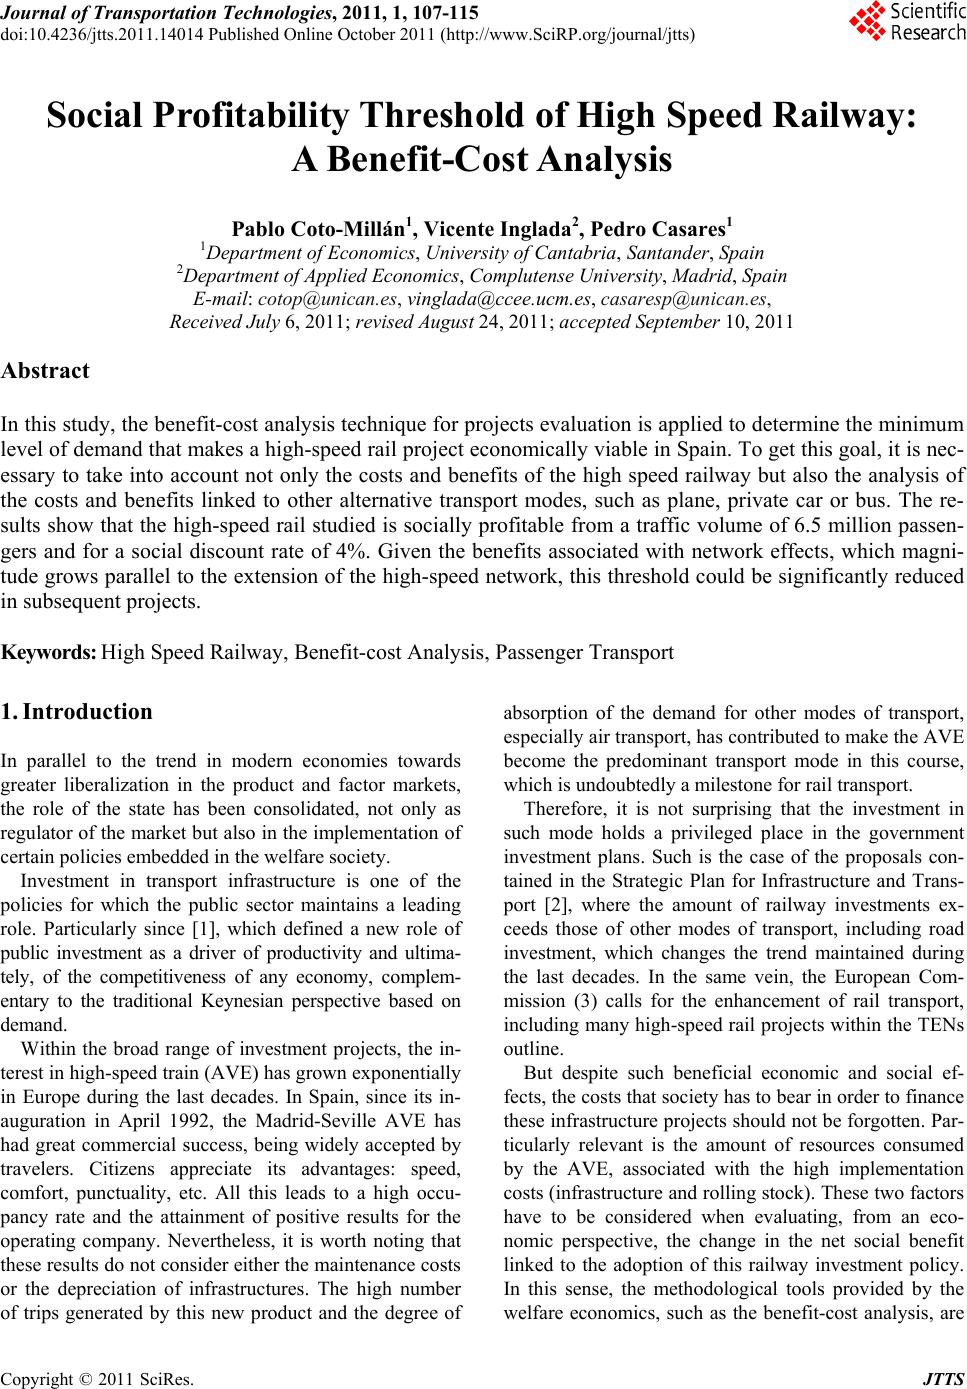
 Journal of Transportation Technologies, 2011, 1, 107-115 doi:10.4236/jtts.2011.14014 Published Online October 2011 (http://www.SciRP.org/journal/jtts) Copyright © 2011 SciRes. JTTS Social Profitability Threshold of High Speed Railway: A Benefit-Cost Analysis Pablo Coto-Millán1, Vicente Inglada2, Pedro Casares1 1Departmen t o f Economics, University of Cantabria, Santander, Spain 2Department of Applied Economics, Complutense University, Madrid, Spain E-mail: cotop@unican.es, vinglada@ccee.ucm.es, casaresp@unican.es, Received July 6, 2011; revised August 24, 2011; accepted S e pt ember 10 , 20 11 Abstract In this study, the benefit-cost analysis technique for projects evaluation is applied to determine the minimum level of demand that makes a high-speed rail project economically viable in Spain. To get this goal, it is nec- essary to take into account not only the costs and benefits of the high speed railway but also the analysis of the costs and benefits linked to other alternative transport modes, such as plane, private car or bus. The re- sults show that the high-speed rail studied is socially profitable from a traffic volume of 6.5 million passen- gers and for a social discount rate of 4%. Given the benefits associated with network effects, which magni- tude grows parallel to the extension of the high-speed network, this threshold could be significantly reduced in subsequent projects. Keywords: High Speed Railway, Benefit-cost Analysis, Passenger Transport 1. Introduction In parallel to the trend in modern economies towards greater liberalization in the product and factor markets, the role of the state has been consolidated, not only as regulator of the market but also in the implementation of certain policies embedded in the welfare society. Investment in transport infrastructure is one of the policies for which the public sector maintains a leading role. Particularly since [1], which defined a new role of public investment as a driver of productivity and ultima- tely, of the competitiveness of any economy, complem- entary to the traditional Keynesian perspective based on demand. Within the broad range of investment projects, the in- terest in high-speed train (AVE) has g rown expon en tially in Europe during the last decades. In Spain, since its in- auguration in April 1992, the Madrid-Seville AVE has had great commercial success, being widely accepted by travelers. Citizens appreciate its advantages: speed, comfort, punctuality, etc. All this leads to a high occu- pancy rate and the attainment of positive results for the operating company. Nevertheless, it is worth noting that these results do not co nsider either the maintenance co sts or the depreciation of infrastructures. The high number of trips generated by this new product and the degree of absorption of the demand for other modes of transport, especially air transport, has contributed to make the AVE become the predominant transport mode in this course, which is undoubtedly a milesto ne for rail transport. Therefore, it is not surprising that the investment in such mode holds a privileged place in the government investment plans. Such is the case of the proposals con- tained in the Strategic Plan for Infrastructure and Trans- port [2], where the amount of railway investments ex- ceeds those of other modes of transport, including road investment, which changes the trend maintained during the last decades. In the same vein, the European Com- mission (3) calls for the enhancement of rail transport, including many high-speed rail projects within the TENs outline. But despite such beneficial economic and social ef- fects, the costs that society has to bear in order to finance these infrastructure projects should not be forgotten . Par- ticularly relevant is the amount of resources consumed by the AVE, associated with the high implementation costs (infrastructure and rolling stock). These two factors have to be considered when evaluating, from an eco- nomic perspective, the change in the net social benefit linked to the adoption of this railway investment policy. In this sense, the methodological tools provided by the welfare economics, such as the benefit-cost analysis, are  P. COTO-MILLÁN ET AL. 108 especially useful. Among the various factors that modulate the AVE so- cial return, the volume of demand is shown as the most important [3,4 ,5], limiting the econo mic viability of each project. The basic aim of this paper is to determine the volume of demand that makes an AVE project economi- cally viable. The delimitation of this social breakeven can serve as a useful tool in planning and designing the public policy for infrastructures and transport services. 2. AVE Products As it can be seen in the Madrid-Seville corridor, the so-called high-speed rail service includes both the "pure" AVE, which is called long-distance, and two other seg- ments: shuttles and variable width, which have specific characteristics. Table 1 shows the distinguishing features of each of these segments for the corridor Madrid-Barcelona, which line became operational in February 2008. This is the model chosen for the project type of this research. The main discriminating factors between Shuttle and Long Distance are demand met and price, while the segment of variable width differs from the others be- cause it has to use different rolling stock, due to the need of using infrastructure with different track gauges. The use of the existing infrastructure in part of the journey, along with the necessary width change operation in the exchanger, makes the average speed, and therefore the cost reduction, less widespread than in other segments of the High Speed supply. 3. Methodology Used The methodology used in this paper for assessing the social benefit in the benefit-cost analysis of the AVE p- roject type is a generalization of that used in [8] and ex- tensively describe d in [9,10] for the AVE Madrid-Sev illa and in [7] for the case of the Madrid-Barcelona-French border AVE. Next, a summary of the basic points in relation to ti me savings is shown: For users of conventional train and bus, as shown in Figure 1, the generalized cost1 (gt) composed of the rate (pt) and the total time spent on the trip (gt – pt) decreases to the value of the generalized cost of travelling on the AVE (gh). The benefits of this reduction can be ex- pressed for each mode of transport as: 12 C C thtth ht hh ttth ggqgg qq pq pq This expression is equivalent to the areas of the rec- tangles t and ht less the net cost needed to obtain such benefits. Such cost corresponds to that of setting the AVE less the savings resulting from the elimination of the conventional train and bus services. gh bg epfpj However, as shown in the Figure 1, and without con- sidering who gets the surplus, the social benefit can be obtained, for trips diverted from other modes, by the time savings resulting from the introduction of a faster mode of transport. Therefore, it is sufficient to calculate the time reduction in travel and access, an d multiply it b y th e value of time. Figure 1. AVE benefits for train and car travelers. Table 1. Discriminating factors of the submarkets of the AVE Madrid-Barcelona. Shuttles Long distance Variable width [Barcelona- Tarragona] [Madrid- Barcelona] [Madrid- Soria] [Barcelona- Gerona] [Madrid- Zaragoza] [Madrid- Logroño] Routes [Barcelona- Lérida, etc.] Other Other Material Alsthom Talgo and Siemens Brava Infrastruc- ture New high speed lines New high speed lines New and conventional line Price per passenger / km (Euro cents of 2008) 8.11 10.82 9.32 Occupancy 0.60 0.65 0.60 Type of demand Suburban train with high rate of commuting trips (conmuter) Long dis- tance Long d i s - tance (1) 1Generalized cost is defined as a lineal combination of three elements: monetary component of the trip, value of the total time consumed and valuation of other travel elements such as comfort and safet .Source: [7] and own elaborati on. Copyright © 2011 SciRes. JTTS  109 P. COTO-MILLÁN ET AL. The total benefit for the trips generated is represented in this chart by the area under the demand function (the trapezius bdqhqt) minus the area of the rectangle (edif), which represents travel time consumed, and which can be decomposed in two components. The first one, repre- sented in the graph by the rectangle (fiqtqh) is given by the income derived from such trips (qh – qt) × (ph) and the second component, represented by the triangle (bde), is half the product of the difference of the generalized cost for the trips generated by the number of such trips (qh – qt) × (gt – gh)/2. Thanks to the existence of surveys for the Ma- drid-Seville corridor, made after its commissioning, it has been possible to distinguish within the trips gener- ated, those derived from an increased frequency of travel (from previous users of other modes of transport ) and those truly generated. For those who already traveled in the past, the generalized cost of the original mean of transport has been taken as a reference, while for the new ones, the weighted average of the generalized costs of the different modes has been used. In this case, the weighing has been determined from data from the survey conducted on the substitution effect. This methodology is valid for conventional rail and bus, but it needs to be adjusted on plane and private car. As regards private car, the saving on travel diverted re- sources has to be extended to the operational cost savings of not travelling by car. Due to the existence of several alternative modes, the AVE costs should be added to just one of them, to avoid double counting. Finally, in the case of the plane, it is noteworthy that although the generalized cost is lower for the AVE, the cost reduction is entirely d ue to lower prices as the travel time component is still less on the plane. So when di- rectly applying the aforementioned methodology, the result would be a negative benefit. However, it is neces- sary to keep in mind other important components of the generalized cost: comfort, safety, etc. which reduce the disutility in the AVE in parallel with the price. In this perspective, it was decided to bring about a reduction in the AVE widespread cost compared to the other modes, according to the results of the survey on the reasons to choose the AVE instead of the plane2. This framework has been extended with the method- ology for the valuation of externalities in transport, as detailed in [11]. In addition, all the characteristic endpoints of the so- cial assessment of projects, such as shadow prices, ex- cluding taxes, etc as detailed in [7], have been used. Table 2 shows the costs and benefits used for evalu- ating the project type. Therefore the macroeconomic, sectorial and regional effects have not been directly con- sidered. Such effects are analyzed in detail by [13] and [14]. Finally, the benefit implied by the introduction of the AVE for the territories concerned is quite obviou s, espe- cially when taking into account the peripheral situation of Spain regarding the main centers of production and decision of the European economy. In [15] the author describes the regional effects produced by the TGV. According to [7], the methodology to evaluate costs and benefits is the following: 3.1. Cost As for any other product, the AVE costs can be divided into fixed, semi-fixed and variable, naturally depending on the term considered. Fixed costs are those corre- sponding to the construction of the infrastructure and its maintenance (even though in the long term such costs will probably evolve in parallel to the demand). Semi-fixed costs correspond to the purchase of rolling stock and, lastly, variable costs are those commonly called operating costs, characterized by being highly sensitive to the evolution of the demand. Taxes are ex- cluded from the cost sections. Table 2. Costs and benefits considered in evaluating the project type. Costs Benefits Total cost of infra- structure, maintenance and operation (TC = I – R + RS + IM + O) Total benefits (IGT + TS + CR + REC) Infrastructure (I) Income from Generated Trips (IGT) Residual value (R) Time saving (TS) for users from: Rolling Stock (RS) Other methods of tr a ns p o rt Infrastructure mainte- nance (IM) Cost reduction (CR) in: Operation (O) Conventional railway Airplane Coaches Operational car costs Reduction of external costs (REC) in: Congestion Accidents Environment Infrastructure maintenance 2According to the assessments given by users and expressed in surveys, the generalized cost of alternative ways has been expanded, to intro- duce other useful components such as comfort, security, etc. To this end, these costs have been increased by 1.8 for car, 1.2 for rail, 1.15 fo coach and 1.5 for airplane. Source: Authors’ compilation based on [7,11,12]. Copyright © 2011 SciRes. JTTS  P. COTO-MILLÁN ET AL. 110 Regarding prices, it has been assumed that all sections are valued at constant prices of 2008. Thus, the method- ology applied for quantifying each of those costs is as follows: 3.1.1 Infrastructure Construction Costs The AVE infrastructure includes the track as well as the earthworks, signalling, stations, catenary, etc. The total cost of the 855 kilometres amounts to 7,928 million Eu- ros. Each kilometre of infrastructure built amounts to a cost of 9.27 mill i on Eur os. 3.1.2. Infrastructure Maintenance Costs The annual maintenance cost for the infrastructure3 has been estimated at 11.75 thousand Euros per km. It is im- portant to point out that in the long term this cost is probably slightly sensitive to the levels of demand. This effect has not been considered, as it has been assumed that it would be offset by a probable downward trend of the maintenance unit costs linked to the economies of scale. 3.1.3. Rolling Stock Costs The costs considered for the three different types of roll- ing stock are as follows: 20.7 million Euros for long- distance trains; 9.6 for regional shuttle trains; and 11.4 for variable gauge trains. 3.1.4. Costs for Obtaining The Necessary Rolling Stock Units The methodology used to determine the necessary units, according to [10], is as follows. The average capacity of Siemens and Talgo trains for long haul is 361 passengers. A load factor of 0.63, which means 228 passengers car- ried per unit, was considered. When multiplying this value by the average mileage covered by each unit (450,000 kilometers) per year, the result is that every 102.60 million passenger-kilometers per year are neces- sary to incorporate a new train. For shuttle trains and variable gauge trains a new train is necessary every 57.12 and 54.72 million passenger-kilometers. It is necessary to should point ou t that the calculations are based on ideal operating conditions or maximum efficiency conditions in the incorporation of the new rolling stock. 3.1.5. Oper ating Costs This chapter includes all costs derived from operating the AVE, which have been obtained separately for both types of material. For long-haul material, the cost is 8.21 Euro cents in 2008 per passenger-kilometer, while for the other segments of supply it is 6.98 cents. 3.1.6. Resid ual Value For the rolling stock, the useful life considered is 20 years. Together with this, a linear depreciation during this pe- riod has been assumed. For the entire infrastructure, a value of 45 years has been estimated [16]. Therefore, af- ter 40 years of operation, and assuming a linear deprecia- tion rate, the residual value would be minimal, approxi- mately 10% of val ue of the investm e nt made. 3.2. Benefits The benefits considered in the project and the methodol- ogy used for their assessment are detailed below. 3.2.1. Time Savings Part of the benefits related to the introduction of the AVE consists of the time savings for passengers origin- nating from other means of transport and also for new passengers. For its assessment, it is necessary to know the modal travel times from the origin to the destination for each mean of transport (including the times to and from the station or airport) and the monetary values as- signed to the total travel time (see Table 3). Likewise, in order to calculate the savings corresponding to the gen- erated trips, it is necessary to have access to the mone- tary costs of each means of transport that makes it possi- ble to obtain the income (see Table 3). Table 3. Model travel times, Modal monetary values of travel time and monetary costs per transport mean. route Madrid-Barcelona. Model travel times Car Airplane Coach Train AVE Journey time5 h 45'55' 7 h 35' 6 h 35'2 h 35' Access and dispersion time 1 h 35' 50' 1h 50' Total time 5 h 45'2 h 25' 8 h 25' 7 h 35'3 h 25' Modal monetary values of t r a v e l t i m e (Euros of 2008 per p as se ng er/ ho ur ) Car Airplane Coach Train 6.04 25.56 3.25 13.01 Monetary costs per transp or t mean (Euros of 2008) Airplane Coach Conventional train AVE 1ª Class 2ª Class Busi- ness Tourist 122.05 22.84 58 44 128.6886.70 3This value includes other concepts such as station maintenance (ADIF). Source: [7,16] and ow n el aboration. Copyright © 2011 SciRes. JTTS  111 P. COTO-MILLÁN ET AL. The modal monetary values of travel time used in this work have been provided by the Administrative Depart- ment responsible for transport in Spain. Such values, which are detailed in [16], have been updated. The same values have been used in [10] for the Madrid-Sevilla AVE and in [7] for the Madrid-Barcelona-French bor- der. 3.2.2. Cost Reduction in Alternative Means of Transport Another type of benefits, inherent to the operation of the new product, consists of the reduction of costs in the alternative means of transport: conventional railway, airplane, coach and car. 3.2.3. Redu ction of Costs in Co nventional Railway The intermodal substitution produced by the AVE is es- pecially pronounced for the conventional railway, which practically becomes a marginal mean of transport on this route in terms of its passenger transport function.. In order to determine the corresponding cost reduction, the structure of the production4 cost of the average day- time train has been used, it being the most affected by the reduction of the offer. Of all its components, only half of the cost associated to the chapter of stations has not been included. However, the entire amortisation chapter has been included, based on the fact that the train could be used alt ernat i vely in another route. As the offer along this route has practically disap- peared, in order to determine the total cost it is valid to use a unit cost ratio per passenger-km, which has been obtained by applying to the national average value a co- efficient representing the occupancy differential existing in this route with regard to the na tional average. This has been estimated at 4.63 euro cents per travel- ler-kilometre originating from conventional train travel. 3.2.4. Reduction of Costs in Air Transport The transfer of travellers from air transport to the AVE brings about a reduction in costs for air transport opera- tors in the Madrid-Barcelona route. In this mode of transport, unlike the case of the conventional train, aside from the cut in the number of fligh ts, the reduction of the offer takes place through a reduction of the average oc- cupancy. For this reason, instead of basing itself on a unit cost per traveller-km, the method used is based on establish- ing the reduction of the number of flights in order to ob- tain the cost savings for the trip by applying the average cost of a flight. The cost savings per unit per trip have been obtained by subtracting from the total cost the fixed items such as structural costs and part of the commercialisation costs, as well as all taxes. The amortisation chapter has been kept, given that an aircraft can be used on another line, as it is clearly understood when the operator is renting the aircraft. The final result is 15.23 Euro cents for the year 2008 per passenger-km originating from air travel. 3.2.5. Red u ction of Costs in Coaches In coaches, the effect of the intermodal substitution brought about by the introduction of the AVE generates cost savings for the operating co mpanies, essentially as a result of the reduced number of trips. In order to calcu- late these savings, the costs structure of a representative coach gathered by the [16] has been used. It is worth noting that in the cost saving calculation, all of its com- ponents have been considered, including depreciation, as there is a possibility, in the form of opportunity cost, to use the vehicle for another line in the medium term. Therefore only the costs of taxes have been excluded, since it is assumed that the costs of structure or organiza- tion are included in the discretionary coach data. The savings determined amount to 3.92 Euro cents perpas- senger-km. 3.2.6. Red u ction of Car Costs In the case of private vehicles, it is not possible (except if the vehicle is rented) to substitute the trip planned ini- tially by another one in a different place during the same period of time. Therefore cost chapters considered as “fixed”, such as part of the amortisation and insurance, should not be included in determining cost savings. As to the part of the amortisation chapter included, [16] has been used as starting point, where the authors estimate that half of said chapter corresponds to the passing of time, whereas the other half is related to the use of the vehicle. Continuing with this assumption, the structure of the cost savings has been obtained, eliminating the fixed chapters and the taxes, for each of the routes that make up the corridor. The costs considered in each section and for which specific methods have been used are: vehicle amortisation, maintenance, fuel consumption, lubricant consumption and tyre wear. The calculated savings per unit amount to 52.87 euro cents per passenger-km. 3.2.7. Red u ction of External Costs For the assessment of external costs, the results of [7], which ar e shown in Table 4, have been considered. 4Therefore, organizational costs, known as structural costs have no been included. Copyright © 2011 SciRes. JTTS  P. COTO-MILLÁN ET AL. 112 Table 4. External marginal social costs (euro cents perpas- senger-km). Environ- mental Infrastructu re conservation Accidents Congestio - n Car 1.89 0.84 3.05 2.14 Train 0.60 2.62 0.17 - Coach 0.67 0.16 0.78 0.37 Airplane 2.46 - - - AVE 0.49 - - - Source: [7] and own elaboration. 4. Parameters In the simulations conducted on the project type and in order to bring this work to a rigorous sens itivity analysis, several parameters have been considered. The empirical evidence shows that the following parameters are the ones that have greater impact on the profitability of the project. 4.1. The Discount Rate Parameter In order to determine the final net benefit of the project, it is necessary to update the annual benefits and costs with regard to the year considered as base, by means of a real social discount rate r, in such a way that the present value (NPV) of the investment is: 00 11 nn t t tt BC NPV rr t t (2) Where; Bt, Ct and r represent for benefits, costs and real social discount rate respectively. The Manuals for the assessment of projects of the Spanish Ministry of Development, responsible for trans- port infrastructures, recommend the use of a social dis- count rate of 6% in real terms. This value has also been used in other infrastructure projects (especially roads) carried out in Spain during the nineties. [17] uses even higher rates (8% and 10%) for the economic evaluation of the Barcelona rounds. However, since the incorporation of the Spanish Economy to the European Economic and Monetary Un- ion, the consolidation of favourable economic expecta- tions has been translated into a consolidation of low val- ues of real interest rates below 3%. Therefore, it seems logical to use as a basic alternative in our assessment of the model project a magnitude of 4% for the real dis- count rate in the medium term. 4.2. Project Duration Parameter Two project’s life periods have been considered, 40 and 60 years, which seem particularly suitable given the pro- ject’s size and the Madrid-Sevilla AVE experience, par- ticularly bearing in mind that u sing a discount rate of 4 % would penalize less net income in future years. The evaluation is made with constant prices of 2008. It involves the maintenance of relative prices of different goods and services during the life of the project. 4.3. Economic Growth Rate Parameter It has been assumed that the annual GDP growth rate is 3% during the entire project. This value would corre- spond to the growth rate of the potential Spanish GDP according to the many studies carried out on the Spanish economy until the 2008 crisis and matches the average growth rates over the past 10 years. For the sensitivity analysis, annual economic growth rates of 2.5% and 3.5% have been con si dered. 5. The Demand Given its importance in relation to the magnitude of AVE net benefit, the main characteristics of the AVE demand are analyzed, distinguishing its two components. The introduction of the high-speed rail brings a sig- nificant reduction in the generalized cost of rail transport, this fact generates a significant volume of demand linked to this new mode of transportation. Such reduction, which occurs in the non-cash components of the cost (time, comfort, etc.) produces two effects on the demand which are called, induction and substitution. They corre- spond to the trips that would not have been done if this new service had not existed and to those that would have been developed in another mode of transport. 5.1. Induction The component of the AVE demand, usually termed in- duced, is comprised by all the new trips. This “genera- tion effect” must not only include passengers who have never made such a trip, but also another component formed by the increased frequency of trips by those who were already travelling on that rou te before the existence of the AVE. The average of annual trips made by users in the Madrid-Seville route increases very significantly, from 11.1 to 15.2 [18]. In addition, according to RENFE Operadora, in the route Madrid-Barcelona, 40% of travelers move fre- Copyright © 2011 SciRes. JTTS 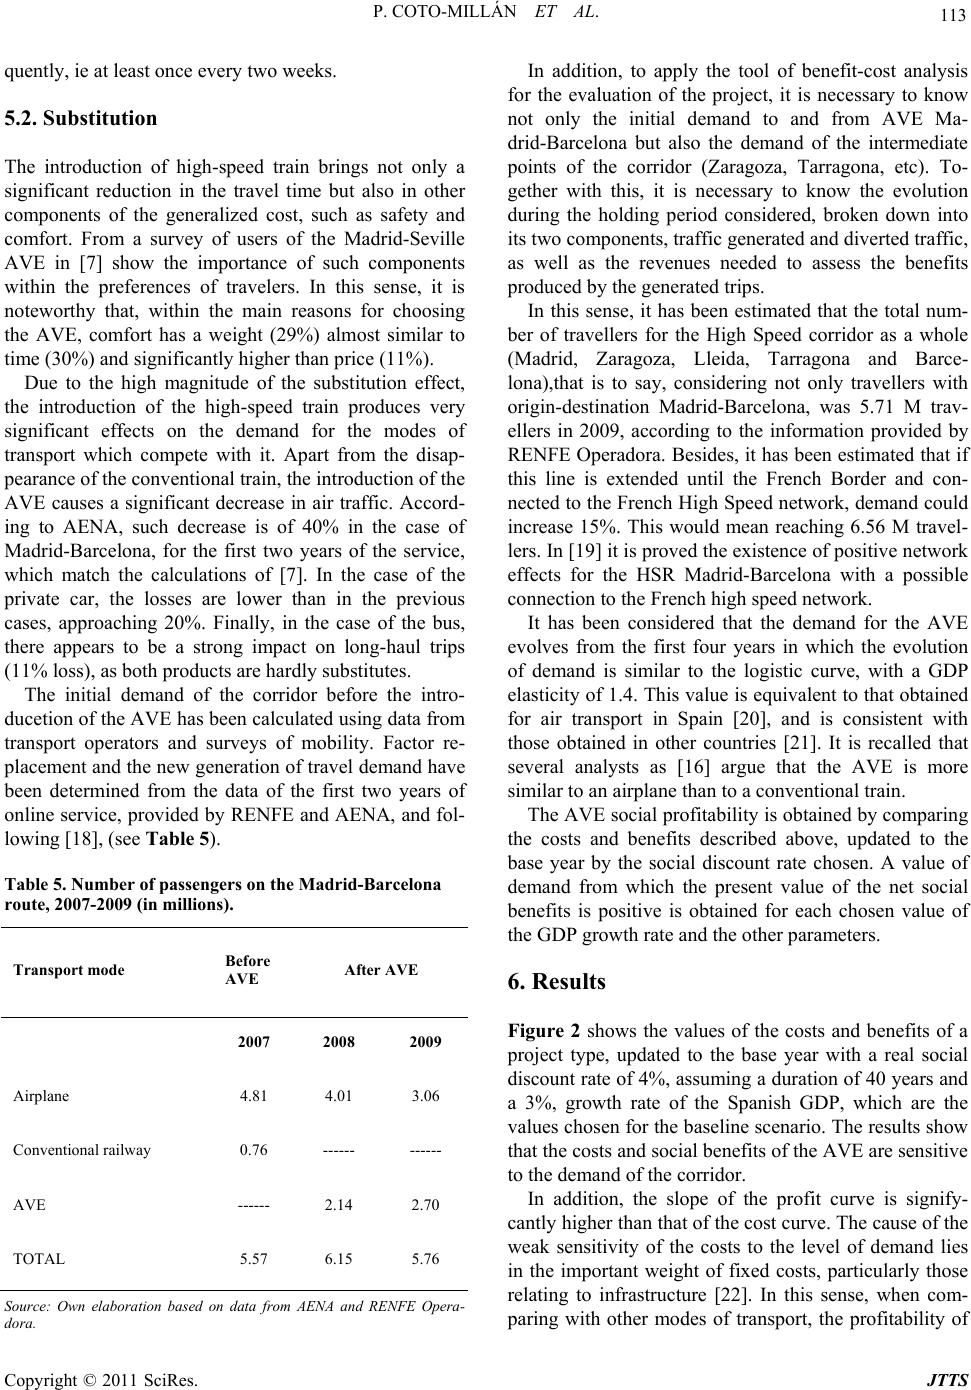 113 P. COTO-MILLÁN ET AL. quently, ie at least once every two weeks. 5.2. Substitution The introduction of high-speed train brings not only a significant reduction in the travel time but also in other components of the generalized cost, such as safety and comfort. From a survey of users of the Madrid-Seville AVE in [7] show the importance of such components within the preferences of travelers. In this sense, it is noteworthy that, within the main reasons for choosing the AVE, comfort has a weight (29%) almost similar to time (30%) and significantly higher than price (11%). Due to the high magnitude of the substitution effect, the introduction of the high-speed train produces very significant effects on the demand for the modes of transport which compete with it. Apart from the disap- pearance of the conventional train, the introduction of the AVE causes a significant decrease in air traffic. Accord- ing to AENA, such decrease is of 40% in the case of Madrid-Barcelona, for the first two years of the service, which match the calculations of [7]. In the case of the private car, the losses are lower than in the previous cases, approaching 20%. Finally, in the case of the bus, there appears to be a strong impact on long-haul trips (11% loss), as both products are hardly substitutes. The initial demand of the corridor before the intro- ducetion of the AVE has been calculated using data from transport operators and surveys of mobility. Factor re- placement and the new generation of travel demand have been determined from the data of the first two years of online s ervice, prov ided by RENFE and AENA, and fol- lowing [18], (s ee Table 5). Table 5. Number of passengers on the Madrid-Barcelona route, 2007-2009 (in millions). Transport mode Before AVE After AVE 2007 2008 2009 Airplane 4.81 4.01 3.06 Conventional railway 0.76 ------ ------ AVE ------ 2.14 2.70 TOTAL 5.57 6.15 5.76 Source: Own elaboration based on data from AENA and RENFE Opera- dora. In addition, to apply the tool of benefit-cost analysis for the evaluation of the project, it is necessary to know not only the initial demand to and from AVE Ma- drid-Barcelona but also the demand of the intermediate points of the corridor (Zaragoza, Tarragona, etc). To- gether with this, it is necessary to know the evolution during the holding period considered, broken down into its two components, traffic generated and diverted traffic, as well as the revenues needed to assess the benefits produced by the generated trips. In this sense, it has been estimated that the total num- ber of travellers for the High Speed corridor as a whole (Madrid, Zaragoza, Lleida, Tarragona and Barce- lona),that is to say, considering not only travellers with origin-destination Madrid-Barcelona, was 5.71 M trav- ellers in 2009, according to the information provided by RENFE Operadora. Besides, it has been estimated that if this line is extended until the French Border and con- nected to the French High Speed network, demand could increase 15%. This would mean reaching 6.56 M travel- lers. In [19] it is proved the existen ce of positive network effects for the HSR Madrid-Barcelona with a possible connection to the French high speed network. It has been considered that the demand for the AVE evolves from the first four years in which the evolution of demand is similar to the logistic curve, with a GDP elasticity of 1.4. This value is equivalent to that obtained for air transport in Spain [20], and is consistent with those obtained in other countries [21]. It is recalled that several analysts as [16] argue that the AVE is more similar to an airplane than to a conventional train. The AVE social profitab ility is ob tained by comparing the costs and benefits described above, updated to the base year by the social discount rate chosen. A value of demand from which the present value of the net social benefits is positive is obtained for each chosen value of the GDP growth rate and the other parameters. 6. Results Figure 2 shows the values of the costs and benefits of a project type, updated to the base year with a real social discount rate of 4%, assu ming a duration of 40 year s and a 3%, growth rate of the Spanish GDP, which are the values chosen for the baseline scenario. Th e results show that the costs and social ben efits of the AVE are sensitive to the demand of the corridor. In addition, the slope of the profit curve is signify- cantly higher than that of the cost curv e. The c aus e of the weak sensitivity of the costs to the level of demand lies in the important weight of fixed costs, particularly those relating to infrastructure [22]. In this sense, when com- paring with other modes of transport, the profitability of Copyright © 2011 SciRes. JTTS  P. COTO-MILLÁN ET AL. 114 the AVE is much more dependent on traffic density in the corridor as the supply of additional units of rail ser- vice incorporates a much smaller additional cost due to the intense effect of the economies of scale. It is also shown that the level of demand for the inter- section point of both curves, which represents the mini- mum level of traffic that makes the project type socially profitable, is 6.5 million of equivalent passengers. Table 6 shows the results of the sensitivity analysis performed with different parameter values. The values obtained for the threshold of demand vary between 6.1 and 8.4 million passengers. Additionally, the introduce- tion of higher values for human life and the duration of the project (60 years) slightly reduced the magnitude cited. For values of the AVE demand lower than those ob- tained previously, a first option to consider in order to make the project profitable is reducing costs, particularly those related to infrastru cture, which would move up the cost curve. Source: Own research. Figure 2. Evolution of costs and profits in relation to de- mand. (Assumptions: Rate of discount 4%; Growth rate 3% and duration 40 years). Table 6. Minimum volume of demand for a profitable high speed train (Millions of equivalent passengers), (sensitivity analysis). GDP growth rate Rate of discount 2% 2.5% 3% 3.5% 4% 7 6.7 6.5 6.1 6% 8.4 8 7.6 7.1 Source: Own research Alternatively, the profit curve could be moved up- wards, by decreasing the threshold of demand that lev- erages the project. An example of this alternative is the use of the AVE for the transport of goods, which would generate increases in various chapters of the benefits: time savings, reduced maintenance costs of conventional road and rail infrastructure, etc. 7. Conclusions The evaluation of any AVE project reveals the existence of numerous factors that influence to a greater or lesser extent its profitability. The demand is pointed out as the most important factor, as this new mode of transportation is characterized by its high speed, more than twice that of the conventional rail, but also by high fixed costs of inf- rastructure, virtually independent of the number of pas- sengers, which make it necessary to hand le high volumes of demand to achieve an acceptable level of profitability. In addition, the AVE profitability is sensitive to other parameters such as: social discount rate, economic growth rate, project duration or value of human life. The various simulations performed for the expected values of 4% for the real social discount rate, 3% for the GDP growth rate and project duration of 40 years, makes it possible to verify that the volume of traffic that marks the threshold of social return is 6.5 million equivalent passengers. In the case of the Madrid-Barcelona AVE, the number of travellers in the corridor as a whole was 5.71 M, ac- cording to RENFE Operadora. If no other possible ef- fects are considered, the project shows a negative bal- ance in the present circumstances. These results can be applied to other HSR projects with similar characteristics, that is, covering similar distance trips, with the same alternative transport modes (bus, private vehicle, con- ventional train and plane) and which generalized cost is similar too. Failure to meet this demand threshold, it would be necessary to consider alternative projects, associated with lower costs or higher profit levels. Furthermore, the development of a high performance network on these corridors, taking advantage of the ex- isting infrastructure, would generate new profits—net- work effects—in the high-speed network service. Given the benefits associated with these network eff ects, which magnitude grows parallel to the extension of the high- speed network, the threshold of demand obtained from 6.5 million passengers could be reduced significantly in subsequent projects. 8. Acknowledgements The authors gratefully acknowledge the suggestions and Copyright © 2011 SciRes. JTTS  P. COTO-MILLÁN ET AL. Copyright © 2011 SciRes. JTTS 115 criticisms from two anonymous rev iewers and the editor. However, errors and omissions that may exist are the sole responsibility of the authors. 9. References [1] D. A. Aschauer, “Is Public Expenditure Productive?” Jo- urnal of Monetary Economics, Vol. 23, 1989, pp.7- 7-100. doi:10.1016/0304-3932(89)90047-0 [2] PEIT, Plan Estratégico de Infraestructuras y Transportes 2005-2020. Madrid, Department of Transportation, 2005. [3] COM, 2001/370-European Commission, WHITE PAPER, “European Transport Policy for 2010: Time to Decide,” Brussels, COM (2001) 370 final. [4] N. Adler, C. Nash and E. A. J. H. Pels, “High-Speed Rail&Air Transport Competition: Game Engineering as Tool for Cost-Benefit Analysis,” Tinbergen Institute Discussion, , 2010, Paper No. 08/103/3. [5] G. De Rus and C. Nash, “In what circumstances is in- vestment in HSR worthwhile?”.Working paper 4th, An- nual Conference on “Railroad Industry Structure, Com- petition and Investment,” Universidad Carlos III de Ma- drid, 2006. [6] G. De Rus, “The BCA of HSR: Should the Government Invest in High Speed Rail Infrastructure?” The Journal of Benefit-Cost Analysis, Vol. 2, No. 1, 2011, pp.1-26. [7] P. Coto-Millán and V. Inglada, “Social Benefits of In- vestment Projects: the Case for High-Speed Rail,” In Es- says on Microeconomics and Industrial Organization, Second Edition, Physica-Verlag, Springer-Verlag Com- pany, Germany, 2003, Chapter 23. [8] J. Dodgson, “Railways Costs and Closures,” Journal of Transports Economics and Policy, Vol. 18, No. 3, 1984, pp. 219-235. [9] G. De Rus and V. Inglada, “Análisis Coste-Beneficio del Tren de Alta Velocidad en España,” Revista de Economía Aplicada, Vol. 1, No 3, 1993, pp. 27-48. [10] G. De Rus and V. Inglada, “Cost-Benefit Analysis of the High-Speed Train in Spain,” The Annals of Regional Science, Vol. 31, 1997, pp. 175-188. doi:10.1007/s001680050044 [11] P. Coto-Millán and V. Inglada, “Market Failures: The Case for Road Congestion Externalities,” In Essays on Microeconomics and Industrial Organization, Second Edition, Physica-Verlag, Springer-Verlag Company, Germany, 2003, Chapter 22. [12] P. Coto-Millán and V. Inglada, “Innovación en el Transporte: El Tren de Alta Velocidad,” Economía Industrial, No. 353, 2003, pp. 83-88. [13] O. Álvarez and J. A. Herce, “Líneas Ferroviarias de Alta Velocidad en España,” Economía Aplicada, Vol. 1, No. 1, 1993, pp. 5-32. [14] V. Inglada, “El Papel de las Infraestructuras en la Competitividad y el Desarrollo Económico,” Estudios Territoriales, Vol. 1, No. 97, 1993, pp. 397-409. [15] A. Bonnafous, “The Regional Impact of the TGV,” Transportation, No. 14, 1987, pp. 127-137. doi:10.1007/BF00837589 [16] MOPT, “Manual de Evaluación de Inversiones en Ferrocarril de Vía Ancha,” Ministerio de Obras Públicas y Transportes, Madrid, Department of Transportation, 1991. [17] P. Riera, “Rentabilidad Social de las infraestructuras: Un Análisis Coste-Beneficio,” Civitas, Madrid, 1993. [18] V. Inglada, “Análisis Empírico del Impacto del AVE Sobre la Demanda de Transporte en el Corredor Madrid-Sevilla,” Revista de Estudios de Transportes y Comunicaciones, No. 62, 1994, pp. 35-51. [19] V. Inglada, P. Coto-Millán and B. Rey, “Effects of Net- work Economics in High Speed Rail: The Spanish Case,” Annals of Regional Science, No. 41, 2007, pp. 911-925. doi:10.1007/s00168-007-0134-6 [20] P. Coto-Millán, V. Inglada and J. Baños-Pino, “Marshal- lian Demands of Intercity Passenger Transport in Spain, An Economic Analysis 1980-1992,” Transportation Re- search E, Logistics and Transportation Review, Vol. 33, No. 2, 1997, pp. 79-96. [21] A. D. Owen and G. D. A. Phillips, “The Characteristics of Railways Passenger Demand,” Journal of Transport Economics and Policy, Vol. 21, No. 3, 1987, pp. 231-253. [22] L. S. Thompson, “High-Speed Rail in the Unites States: Why isn’t There More? ” Japan Railway & Transport Re- views, October, 1994, pp. 32-39.
|