 Vol.3, No.10, 895-905 (2011) Natural Science http://dx.doi.org/10.4236/ns.2011.310115 Copyright © 2011 SciRes. OPEN ACCESS Natural radioactivity and the resulting radiation doses in some kinds of commercially marble collected from different quarries and factories in Egypt S. Fares1*, Ali. A. M. Yassene1, A. Ashour1, M. K. Abu-Assy2, M. Abd El-Rahman1 1Department of Radiation Physics, National Center of Radiation Research and Technology NCRRT, Atomic Energy Authority, Cairo, Egypt; *Corresponding Author: sfares2@yahoo.com 2Physics Department, Faculty of Science, Suez-Canal University, Ismailia, Egypt. Received 21 August 2011; revised 27 September 2011; accepted 5 October 2011. ABSTRACT Fourteen samples of marble were collected from different factories in Egypt. The samples were crushed, dried in controlled furnace for around twenty four hours, and then stored for five weeks in plastic Marinelli beakers. Concentrations and the U- and Th-bearing minerals were studied by scanning electron microscopy (SEM) and energy dispersive X-ray spectrometry (EDS).The gamma radiation of the samples was measured, employ- ing high resolution γ-ray spectroscopy with an accumulating time for about 80000 sec. each. From the measured γ-ray spectra, activity con- centrations were determined for marble samples 226Ra (37. 6 ± 1.7 - 100.54 ± 3.2 Bq/kg), 232Th (3.57 ± 0.64 - 9.37 ± 1.80 Bq/kg) and 40K (30.68 ± 1.1 - 1196 ± 4.9 Bq/kg). The absorbed dose rates, annual effective dose rates, radium equivalent activities as well as the radiation hazard indices were estimated. The radium equivalent activities (Raeq) are lower than the limit of 370 Bq·kg−1 set by the Organization for Economic Cooperation and Development (Exposure to radiation from the natural radioactivity in building materials. Report by a Group of Experts of the OECD, Nuclear Energy Agency, OECD, Paris, 1979) [1]. All obtained results referred to the fact that all the concentrations were within the allowed limits to domestic use. Comparing the results in this work with those published by International Atomic Energy Agency and local and universal researches, it was found that these concentra- tions were within the allowed limits for agricul- tural and domestic uses. Keywords: Marble; Effective Dose; External and Internal Hazard Indexes; NORMS; Gamma Spectrometry; Radium Equivalent. 1. INTRODUCTION Radionuclides in our environment are of three general types: primordial, cosmogenic, and anthropogenic (man- made). Natural radionuclides are present in all rocks in varying amounts depending on their concentration levels in source rock materials. It is known that the radionuclides 238U, 235U and 232Th may become incorporated in igneous materials when they are originally formed from the molten state. The use of building materials rich in gamma-emitting primordial radionuclides may cause substantial exposures to those inhabiting dwellings built with these products. The main products of concern are building stones, concrete, plaster and industrial by-products and residues used as ballast in building materials. The background levels in rocks from the 238U and 232Th series and 40K make similar contributions to the externally incident gamma radiation as the median concentrations of 238U, 232Th and 40K in the earth s crust, and are typically around 35, 30 and 400 Bq/kg respectively. The use of these building materials is mostly used for floors and therefore assessment of exposure should be based on scenarios where the material is used in a typical way. Natural building stones are made from different types of material. The radionuclide content is lowest in basic rocks of magmatic origin. Also marbles, limestone and various detrital sedimentary rocks contain only small amounts of natural radionuclides. Higher concentrations are generally found in acid magmatic rocks, especially in late-magmatic granites, and in some metamorphic rocks. In minerals the incorporation of uranium and thorium into the crystal lattice depends on the abundance of these elements in the rock during crystallization and on the  S. Fares et al. / Natural Science 3 (2011) 895-905 Copyright © 2011 SciRes. OPEN ACCESS 896 matching of the chemical properties and the atomic radii of hosts and substitutes. Based on these general expecta- tions the ratio of the uranium or thorium contents of individual minerals should be more or less constant. The absolute concentrations of uranium and thorium in the minerals should be related to the geochemical charac- teristics of the rock from which the detrital grains origi- nate, and give an indication of their provenance [2] . Marbles show variety of textures on account of exist- ing minerals & re-crystallization patterns. Texture depends upon form, size, and uniformity of grain arrangements. Marbles can be classified on the basis of the following factors: 1) Calcite Marble—Mostly CaCo3; MgCo3 < 0.50% 2) Dolomite Marble—Having > 40% MgCo3. 3) Magnesium Marble—MgCo3 between 5% to 40%. 4) Serpentine Marble-remobilised marble due to the effect of thermodynamic metamorphic wherein serpentine is prominent. 5) Onyx Marble—Lime carbonate deposition on account of cold water solution activity. The major mineral impurities in marble (Quartz, Tremolite Actinolite, Chert, Garnet, Biotite, Muscovite, Microline, Talc, Fosterite. While the major chemical impurities in marble (SiO2, Fe2O3, 2Fe2O3, 3H2O, Li- monite, Manganese, Al2O3·FeS2 (pyrite). On account of the mineral composition of marble the color variations. All building materials including marble contain various amounts of natural radioactive nuclides. Materials derived from rock and soil contain mainly natural radionuclides of the uranium 238U and thorium 232Th series as well as potassium 40K. Marbles, in particular, exhibit an enhanced elemental concentration of these natural radionuclides in comparison to the very low abundance of these elements observed in the mantle and the crust of the Earth. The igneous rocks of marble composition are strongly enriched in U and Th (on an average 5 ppm of U and 15 ppm of Th), compared with rocks of basaltic or ultramafic composition (<1 ppm of U) [3-5]. In the 238U series, the decay chain segment starting from radium (226Ra) is radiologically the most important and therefore reference is often made to 226Ra instead of 238U. The worldwide average concentrations of 226Ra, 232Th and 40K in the earth’s crust are about (50, 50 and 500) Bq kg–1, respectively [6,7]. The presence of the radioisotopes in materials causes external exposure to the people who live in the building. 226Ra and 232Th can also increase the concentration of 222Rn and 220Rn and of its daughters in the building. 40K and part of the above-mentioned radionuclides cause external exposure while the inhalation of 22 2 Rn, 220Rn and their short lived progeny leads to internal exposure of the respiratory tract to alpha particles [8,9]. Any beneficial practices involving the use of radioactive materials obviously give rise to radioactive waste that, by definition, should be viewed as one aspect of the practice. In the world, many rich marble deposits in countries like Portugal, Spain, Italy, Greece, Turkey, Iran and Pakistan are located in Alpine-Himalayan belt. As a result of its geological location, Egypt possesses very rich, natural stone reserves in various colors and patterns. Currently, Egypt has about 500 marble and granite factories. According to specialists in the industry, there are 3 types of factories: factories that are just involved in cutting the blocks into plates of marble and then distributing them to workshops that handle further cutting and polishing, factories that cut and polish the plates, and factories that do the whole process until the final product is produced. The area of “Shak El Thoban” in Katameyya has become a conglomeration of factories working in the marble and granite industry. This area was first occupied by quarrymen quarrying the limestone in the hills and mountains of Katameyya. In order to be able to assess radiological risk, it is important to study the levels of radiation emitted from building materials. In this context, the present work aims at determining the specific activities (in Bq·kg−1) of 226Ra, 232Th and 40K in some Marble samples of wide use locally. In order to estimate their radiological effects, the total absorbed dose rate (D), the radium equivalent (Raeq), the external hazard index (Hex) and the internal hazard index (Hin) have been estimated. Due to the health risks associated with the exposure to indoor radiation, many governmental and international bodies such as the International Commission on Radiological Protection [10], the World Health Organization, etc. have adopted strong measures aimed at minimizing such exposures. Hence, this work is important from both health and science perspectives. Even though the work cannot cover all the building material samples in Egypt, it can be a pointer for similar works if the findings are significant. It may also help adopt policies with respect to regulating the use of building materials that might be of risk to public. Authorities in areas such as Minister of Com- merce and Industry and the Egypt Standards Organiza- tion can benefit from the outcome of this project. 2. EXPERIMENTAL METHODSE 2.1. Samples Collection and Preparation A total of 14 different sample of marble tiles used in constructing houses and other buildings, were collected from different location in Egypt. These tiles, are widely used as building and ornamental materials. The samples were crushed and homogenized in grinders at the labo-  S. Fares et al. / Natural Science 3 (2011) 895-905 Copyright © 2011 SciRes. OPEN ACCESS 897 897 ratory. They were then sieved through a 40-mesh sieve and then heated at 110˚C in an oven for 24 h to get rid of moisture if any. The samples were then cooled and transferred to plastic Marinelli beakers of volume 500 ml each and then properly sealed so as to keep the 222Rn gas that emanate from the crushed samples to be confined to the beaker, as much as possible. The sealed Marinelli beakers were then kept for a period of 1 month to allow the short-lived progenies of 226Ra and 232Th to reach secular equilibrium. The radioactivity concentrations of 226Ra, 232Th and 40K in all of them were then determined. Fourteen samples of marble from locations were collected from different factories in Egypt. 14 samples of Marble (8 sample from Sinai, 3 sample from Suez Golf, 2 sam- ple from Upper Egypt and one sample from Red Sea) where collected from different places in (A.R.E) as shown in Figure 1. 2.2. Mineralogical Study The 14 kinds of marble used in this study are the most popular types, according to the factories that provided the samples. Selected thin sections of fresh rocks were examined by petrographic and scanning electron mi- croscopy {SEM micrographs were obtained with a JSM- 5400 (Jeol/Japan)}. Fracture surfaces were obtained by compression of the specimens. Surface of fracture was sputtered with thin layer of gold. Minerals were ana- lyzed by Energy Dispersive Spectrometry (EDS) at Na- tional Center of Radiation Research and Technology NCRRT, Atomic Energy Authority, Cairo, Egypt. For XRD analysis, X-Ray Diffraction patterns were ob- tained with XRD—DI series, Shimadzu apparatus using Ni—filter and Cu—K target. 2.3. Gamma Spectrometric Analysis The HPGe detector had a relative efficiency of 30% and full width at half maximum (FWHM) of 1.89 keV for the 1332 keV γ-ray line of 60Co. The detector was surrounded by a special heavy lead shield of about 10 cm thickness with inside dimensions 28 cm diameter 40.5 cm high to reduce background radiation originating from building materials and cosmic rays. The spectro- meter was calibrated using both uranium nitrate source and potassium chloride standard sources in the same geometry as the samples. A set of high quality certified reference materials (IAEA, RG-set) was used. The analysis of output spectrum was carried out with the help of Canberra Genie 2000 software version 3.0. Figure 1. Location of marble quarries and factories in Egypt.  S. Fares et al. / Natural Science 3 (2011) 895-905 Copyright © 2011 SciRes. OPEN ACCESS 898 The 226Ra activities (or 238U activities for samples as- sumed to be in radioactive equilibrium) were estimated from 214Pb (351.9 keV), 214Bi (609.3, 1764.5 keV) and 226Ra (185.99 KeV). Several 214Pb and 214Bi peaks were also monitored. The Gamma ray energies of 212Pb (238.6 keV) and 228Ac (338.4, 911.07, 968.90 keV) were used to estimate the concentration of 232Th. The natural abundance of 235U is only 0.72% of the total uranium content and hence was not considered in the present study. The activity concentrations of 40K were measured directly by its own gamma rays (1460.8 keV). The activ- ity concentrations were calculated from the intensity of each line taking into account the mass of the sample, the branching ratios of the γ-decay, the time of counting and the efficiencies of the detector. The activity concentra- tions of the investigated samples were calculated from Eq.1: EiEiEd s AN tM (1) where NEi is the Net Peak Area of a peak at energy Ε, εE is the detection efficiency at energy Ε, t is the counting lifetime, γd is the number of gammas per disintegration of this nuclide for a transition at energy E, and Ms is the mass in kg of the measured sample. If there is more than one peak in the energy analysis range for a nuclide, then an attempt to average the peak activities is made. The result is then the weighted average nuclide activity. The correction for the contribution of 232Th via its daughter nuclide 228Ac (1459.2 keV peak) to the 1460.8 keV peak of 40K was made according to [11] The error in 40 %9.3 Th K K activityAA (2) Activity concentrations, calculated from the intensity of several γ-rays emitted by a nuclide, are grouped to- gether to produce a weighted average activity per nu- clide. Errors arise due to a number of factors, like effi- ciency calibrations, peak area determination and random uncertainties associated with background and sample counts. Each sample was measured during an accumu- lating time between 20 and 24 h in the Laboratory of Atomic and Nuclear Physics, Department of Physics, Suez Canal University. After each sample counting, an empty cylindrical plastic container was placed in the detection system, during a counting period of 24 h, in order to collect the background count rates. 2.4. Assessment of Radiological Risk In order to assess the radiological impact of marble used as building materials, the model of a rectangular parallel lepipedon house building( 3 m × 3 m × 3 m), with infinite thin walls and no doors and windows (standard room model) was commonly considered [6]. The absorbed gamma dose rate in air 1m above the ground surface for the uniform distribution of radionu- clides (238U, 232Th and 40K) was computed on the basis of guidelines provided by UNSCEAR (1993, 2000) [6,7]. The conversion factors used to compute absorbed ga- mma dose rate (D)in air per unit activity concentration in (1 Bq·kg–1) samples correspond to 0.621 nGyh–1 for 232Th, 0.462 nGyh–1 for 238U, and 0.0417nGyh–1 for 40K [12]: D = (0.621 ATh + 0.462 ARa + 0.0417 AK ) nGy·h–1 (3) where, ATh, ARa and AK represent the average activity concentrations of 232Th ,226Ra and 40K in Bq·kg–1, respec- tively. Finally, in order to make a rough estimate for the an- nual effective dose outdoors, one has to take into account the conversion coefficient from absorbed dose in air to effective dose and the outdoor occupancy factor. In the UNSCEAR recent reports [6,7], the Committee used 0.7 Sv·Gy−1 for the conversion coefficient from absorbed dose in air to effective dose received by adults, and 0.2 for the outdoor occupancy factor. Annual effective dose rate outdoors in units of μSv per year is calculated by the following formula: AEDR (Indoor) = dose rate (in nGy·h−1) × 24 h × 365.25 d × 0.8 × 0.7 SvGy−1 × 10⁻⁶ (4) AEDR (Outdoor) = dose rate (in nGy·h−1) × 24 h × 365.25 d × 0.2 × 0.7 SvGy−1 × 10⁻⁶ (5) According to most recent regulations and especially the recommendation No. 112 issued by the European Union in 1999 [13], building materials should be ex- empted from all restrictions concerning their radioactive- ity, if the excessive gamma radiation due to those mate- rials causes the increase of the annual effective dose received by an individual by a maximum value of 0.3 mSv. Effective doses exceeding the dose criterion of 1 mSv · y−1 should be taken into account in terms of radia- tion protection. It is therefore recommended that controls should be based on a dose range of 0.3 - 1.0 mSv·y−1, which is the building material gamma dose contribution to the dose received outdoors. Marbles are widely used in the building construction that includes tiling, ornamental and covering both for exterior and interior use. In order to assess the radiation hazard associated with the building materials used, the Raeq have been evaluated, where it is assumed that all the decay products of 226Ra and 232Th are in radioactive equilibrium with their precursors. The Raeq is calculated according to the following formula [14,15]: Raeq = ARa 1.43 + ATh + 0.077 AK (6) where ARa, ATh and AK are The activity concentrations (Bq·kg−1) of 226 Ra, 232Th and 40K, respectively. This  S. Fares et al. / Natural Science 3 (2011) 895-905 Copyright © 2011 SciRes. OPEN ACCESS 899 899 formula is based on the estimation that 1 Bq·kg−1 of 238U, 0.7 Bq·kg−1 of 232Th and 13 Bq·kg−1 of 40K produce the same gamma-ray dose rates. To estimate the gamma-radiation dose expected to be delivered externally from building materials, a model was suggested by various researchers to limit the radia- tion dose from building materials to 1.5 mSv·y−1. In this model the external hazard index has been defined (Hex) defined by some workers [15,16]: Hex= ARa/370 + ATh/259 + AK/4810 (7) The radiation risk is negligible when the maximum value of the external hazard index is less than unity (Hex ≤ 1), which is equivalent to a maximum value of the Raeq activity < 370 Bq·kg−1. In terms of dose equivalent, this index must be less than unity so that the annual ef- fective dose due to radioactivity in the material will be ≤ 1.5 mSv·y−1. Internal exposures arise from the inhalation of radon (222Rn) gas and its short-lived decay products as well as from the inhalation or ingestion of other radionuclides. Radon is part of the radioactive series of 238U, which is present in building materials. To assess the internal ex- posure to 222Rn gas, the internal hazard index has been defined as [15]: Hin =ARa/370 + ATh/259+AK/4810 (8) The use of a material in the construction of dwellings is considered safe when the maximum value of the in- ternal hazard index is less than unity (Hin ≤ 1), As the marble are widely used as building and covering materi- als, it is also possible to use an activity utilization index, proposed by [7 and/or 13], that facilitates the derivation of dose rates in air from different combinations of these three radio nuclides [17]. According to the EC, the following gamma activity concentration index (Iγr) (representative level index) is derived for identifying whether a dose criterion is met: Iγr = ARa/150 + ATh/100 + AK/15 00 (9) The index Iγr is correlated with the annual dose due to the excess external gamma radiation caused by superfi- cial material. Values of index I ≤ 1 correspond to 0.3 mSv/y, while I ≤ 3 correspond to 1 mSv/y. Thus, the activity concentration index should be used only as a screening tool for identifying materials which might be of concern to be used as covering material. According to this dose criterion, materials with I ≤ 3 should be avoided, since these values correspond to dose rates higher than 1 mSv/y [13] which is the highest value of dose rate in air recommended for population [6,7]. Due to radon inhalation originating from building materials [13]. The alpha index was determined using the following formula: Iα = ARa/200 (Bq·kg−1) (10) where ARa (Bq·kg−1) is the activity concentration of 226Ra assumed in equilibrium with 238U. The recommended exemption and upper level of 226Ra activity concentra- tions in building materials are 100 and 200 Bq·kg−1, re- spectively, as suggested by ICRP [10]. These considera- tions are reflected in the alpha index. The recommended upper limit concentration of 226Ra is 200 Bq·kg−1, for which Iα = 1. 3. RESULTS AND DISCUSSION Table 1 presents the various226Ra, 232Th and 40K ac- tivity concentrations and their associated absorbed dose rates and annual effective dose rates for the 14 Marble samples under investigation. The radioactivity concen- tration values in the selected Marble samples ranged from (3.57 ± 0.64) to (9.37 ± 1.8) Bq·kg−1 for 232Th, (37.6 ± 1.7) to (100.54 ± 3.2) Bq·kg−1 for 226Ra and (30.68 ± 1.1) to (1196 ± 4.9) Bq·kg−1 for 40K. It was clearly evident that 40K always contributed to the most specific activity compared with 232Th and 226Ra. The sample M14 presented the lowest activity concentrations for 232Th and 226Ra, whereas it presented the highest ac- tivity value for 40K. All samples have 40K activity con- centrations lower than the regular soil values, except sample M14 with activity concentrations higher than double those of the regular soil values of 1196 Bq/Kg. Moreover samples M4, M8 and M9 have 226Ra, active- ity concentrations higher more than double those of the regular soil concentrations. The measured minimum, maximum and mean activity concentration values, to- gether with the statistical uncertainty (1σ) and standard deviation (SD), of the above natural radionuclides are presented for the different regions in Table 1. Figure 2 shows a comparison of concentration for 226Ra, 232Th and 40K (Bq·kg−1). Figure 2. Histogram comparing the activity concentration 226Ra, 232Th and 40K.  S. Fares et al. / Natural Science 3 (2011) 895-905 Copyright © 2011 SciRes. OPEN ACCESS 900 Table 1. 226Ra, 232Th and 40K activity concentrations (Bq·kg−1), absorbed dose rate (nGy·h−1) and annual effective dose rate (indoor- outdoor) (mSv·y−1) for different marble samples. Sample name Region 226Ra (Bq·kg−1) 232Th (Bq·kg−1) 40K (Bq·kg−1) Absorbed Dose Rate D (nGy·h−1) AEDR (outdoor) (mSv·y−1) AEDR (indoor) (mSv·y−1) M1 Suez Golf 39.86 ± 3.1 5.94 ± 0.5 38.16 ± 1.3 23.70 0.03 0.12 M2 Sinai 39.10 ± 1.5 5.52 ± 1.2 53.04 ± 0.9 23.71 0.03 0.12 M3 Sinai 43.03 ± 2.8 8.85 ± 1.9 286.68 ± 0.537.33 0.05 0.18 M4 Suez Golf 100.54 ± 3.2 5.24 ± 1.4 37.56 ± 1.5 51.27 0.06 0.25 M5 Suez Golf 37.6 ± 1.7 4.36 ± 1.02 33.4 ± 2.1 21.47 0.03 0.11 M6 Sinai 54.47 ± 3.9 5.6 ± 1.11 33.8 ± 1.4 30.05 0.04 0.15 M7 Sinai 37.76 ± 1.6 5.97 ± 1.3 43.28 ± 0.7 22.96 0.03 0.11 M8 Sinai 96.46 ± 4.4 6.88 ± 1.21 57 ± 1.3 51.21 0.06 0.25 M9 Red Sea 79.99 ± 2.1 5.03 ± 0.84 34.12 ± 1.5 41.50 0.05 0.20 M10 Sinai 62.51 ± 2.5 7.53 ± 0.93 30.68 ± 1.1 34.85 0.04 0.17 M11 Sinai 40.15 ± 3.5 3.91 ± 0.95 40.8 ± 1.4 22.68 0.03 0.11 M12 Sinai 76.49 ± 1.3 9.37 ± 1.80 47.4 ± 1.7 43.13 0.05 0.21 M13 Aswan 42.66 ± 1.1 3.57 ± 0.64 66.92 ± 2.8 24.72 0.03 0.12 M14 Qena 44.26 ± 2.3 5.57 ± 1.50 1196 ± 4.9 73.78 0.09 0.36 Average Average 56.78 ± 2.5 5.95 ± 1.2 142.8 ± 1.7 35.88 0.044 0.18 Regular soil (global scale)* Regular soil (global scale) 35 30 400 55 0.3 - 1.0 0.3 - 1.0 *Regular Soil (global scale) from UNSCEAR(2000). The absorbed dose rates (D) indoor air calculated from the measured activities in marble samples are also given in Table 1. For the different marble types and the regions from where they were collected. The absorbed dose rates indoor air were found to vary from 21.47 to 73.78 nGy·h−1 with a mean value of 35.88 nGy·h−1. Average absorbed dose rates for all samples are lower than the world average value of 55 nGy/h [7], except for M14 sample. Studies indicate an average outdoor ter- restrial gamma dose rate of 60 nGy/h in the world rang- ing from 10 to 200 nGy/h [18]. From the present work we found that the average terrestrial gamma dose rate is 35.88 nGy/h which is lower than the world average. The calculated AEDR (outdoor and indoor) values are given in Table 1. The minimum, the maximum and the average values for outdoor are 0.03 mSv/y, 0.09 mSv/y and 0.044 mSv/y, respectively and the corresponding indoor values are 0.11 mSv/y, 0.36 mSv/y and 0.18 mSv/y respectively. The Raeq is related to the external gamma dose and the internal dose due to radon and its daughters [15]. In the present work, Raeq was estimated for the investi- gated samples and are given in Table 2. The highest value of radium equivalent in marble is 144.32 (Bq/kg). It is observed that the calculated radium equivalent for all samples are lower than the recommended maximum value 370 Bq/kg. As reference The world average per- missible dose limit for public which is recommended by ICRP [10] is 1.5 mSv·y−1 which equivalent to 370 Bq·kg−1. The values of the (Hex, Hin) indices must be less than unity for the radiation risk to be negligible [16]. For the maximum value of Hex to be less than unity, the maxi- mum value of Raeq must be less than 370 Bq/kg. This is the radiation exposure due to the radioactivity from a construction material, limited to 1.5 mGyyr−1. The maximum values of Hin equal to unity corresponds to the upper limit of Raeq (370 Bq·kg−1). The values of Hex for the studied marble samples range from 0.13 to 0.39, with an average value of 0.21, are less than unity, Table 2. The mean internal radiation hazard index Hin is for the studied marble samples is 0.36 (Table 2). The external and internal radiation hazard indices are less then 1, which means it is safe for human to carry out their ac- tivities in the area. The mean values of Iγ calculated from the measured activity concentrations of 226Ra, 232Th and 40K are pre- sented in Table 2 for different marble types and the re- gions from where they were collected. The calculated values of (Iγ) for the studied samples varied in the range between 0.32 - 1.15 for marble types are lower than the unity (except for M14), Iγ < 1 corresponds to a dose  S. Fares et al. / Natural Science 3 (2011) 895-905 Copyright © 2011 SciRes. OPEN ACCESS 901 901 creation of 1 mSv·y−1, while Iγ < 0.5 corresponds to 0.3 mSv · y−1. It is clear form in Table 2 that the mean value of the activity index Iγ is 0.53, which is less than the up- per limit for Iγ < 0.5. The mean computed Iα values for the studied samples are given in Table 2 for the different marble sample and the regions where they were col- lected. The values of Iα ranged from (0.19 to 0.5), with the mean value of 0.28 for the safe use of a material in the construction of dwellings, Iα should be less than unity. Table 3 compares the reported values of natural ra- dioactivity for marble obtained in other published data with those determined in this study. As shown in this table, the radioactivity in marble samples varied from one country to another. It is important to point out that these values were not the representative values for the countries mentioned but for the regions from where the samples were collected. The values of the radionuclides concentration for all the selected marble samples in pre- sent study were in the same range of the corresponding material in other published data except in some samples. As shown in Table 3 the values of radium equivalent obtained for present materials are found to be higher compared to that of other countries. Table 2. Calculated raeq (Bq·kg−1), Hex and Hin indices, gamma alpha indices (Iγ, Iα) for marble samples. Sample name Raeq (Bq·kg−1) Hin Hex I γ < 1 Iα < 1 M1 51.30 0.25 0.14 0.35 0.20 M2 51.08 0.24 0.14 0.35 0.20 M3 77.76 0.33 0.21 0.57 0.22 M4 110.93 0.57 0.30 0.75 0.50 M5 46.41 0.23 0.13 0.32 0.19 M6 65.08 0.32 0.18 0.44 0.27 M7 49.63 0.24 0.13 0.34 0.19 M8 110.69 0.56 0.30 0.75 0.48 M9 89.81 0.46 0.24 0.61 0.40 M10 75.67 0.37 0.20 0.51 0.31 M11 48.88 0.24 0.13 0.33 0.20 M12 93.54 0.46 0.25 0.64 0.38 M13 52.92 0.26 0.25 0.36 0.21 M14 144.32 0.51 0.39 1.15 0.22 Average 76.29 0.36 0.21 0.53 0.28 Table 3. Comparison of radionuclides concentrations (Bq·kg−1) and Raeq (Bq·kg−1) in Marble Samples with those obtained in other published data. Country/region Material 226Ra (Bq·kg−1) 232Th (Bq·kg−1)40K (Bq·kg−1)Ra eq (Bq·kg−1)Ref. Egypt Marble tiles 56.78 ± 2.5 5.95 ± 1.2 142.8 ± 1.7 76.29 Presen work Algerian Marble chips 23 ± 2 18 ± 2 310 ± 3 73 ± 4.1 Amrani and Tahtat(2001) [19] Cameroonian Marbles (by-products) 8 ± 2 0.35 ± 0.02 19 ± 2 10.15 M.Ngachin et al. (2007) [20] Jordan( Azraq) Marbles (by-products) 20.1 11.4 85 42.9 Ahmed and Hussein (1997) [21] Kuwait Marbles (by-products) 3.9 ± 0.5 0.22 ± 0.08 3.7 ± 0.5 4.2 Bou-Rabee and Bem (1996) [22] Egypt (Qena) Marbles (by-products) 205 ± 83 115 ± 60 865 ± 392 - Ahmed (2005) [23] Saudi Arabia Marbles (by-products 12.0 0.2 1.7 0.1 23.1 0.1 16.21 Fardous et al. (2007) [24]  S. Fares et al. / Natural Science 3 (2011) 895-905 Copyright © 2011 SciRes. OPEN ACCESS 902 Elemental Analysis’s of Material Chemical composition of samples shows in Table 4 which forgets by using analysis (EDEX). The samples marble M arrangement by increase the (Ca) element. Major element composition of the marble M are quite similar, but calc alkaline rocks are slightly richer in Fe, Mg and Ca. Potassium feldspar is commonly microcline and plagioclases are mainly sodic (i.e. albite and oligo- clase). Quartz contents are similar, mica abundance is variable, and biotite dominates over muscovite. The lat- ter can be considered as an accessory mineral in some of the analyzed rocks. The ESEM is used to investigate the semi-quantitative of the elemental composition for this region. It can be observed that in all of them, Ca is the predominant, followed by Na, Mg. The M (10, 12, 13 14) are characterized by appear Ti and M (12, 13, 14) appear K meanwhile disappear in other samples. In sample M (14) presents a significant amount of iron. The ESEM analysis was made for the selected spot in sample No (14) and the obtained results are shown in Table 4. The chemical composition of the Marble samples are summarized in Table 4. As the U and Th elemental con- centrations (mg/kg) are below the detection limit of the system used, the activity concentrations of 226Ra and 232Th (Bq·kg−1) are measured using gamma spectrome- try. Then, elemental concentrations of U, Th and K were calculated using 226Ra, 232Th and 40K (Bq·kg−1) activity concentrations, respectively [25] Calculated values are presented in Table 4 in units of ppm. Since Th and U elements are considered because of radioactive toxicity, it is important to check if they are above the interna- tional levels or not. Permissible concentrations of Th and U in the building materials should not exceed the inter- nationally accepted levels of 20 and 10 mg/kg, respect- tively [26]. The mean obtained values for Th and U are within the international accepted values in general. Table 4. Chemical composition of marble samples. Al Si S Cl Ca Ti Fe Cu Commercial name, Element Region 0.13 - 0.06 0.03 97.83 - - 0.89 Glalla ElSuez M1 Suez Golf 0.04 0.07 0.06 0.01 94.61 - 0.04 0.33 Alpastar Odysyi M2 Sinai 0.37 0.46 0.15 0.03 93.76 - 0.35 0.0 5 AswadPrown M3 Sinai 0.15 0.09 0.12 0.08 93.49 - 0.00 0.40 Glalla KasKremy M4 Suez Golf 0.16 0.21 0.05 0.04 93.24 - 0.18 1.18 Red Glalla M5 Suez Golf 0.19 0.47 0.06 0.07 92.74 - 0.49 0.29 Prechaa M6 Sinai 0.58 2.01 0.08 0.10 91.95 - 0.49 0.29 Khatemaa M7 Sinai 0.65 1.23 0.16 0.18 91.33 - 0.72 0.28 Kerstin M8 Sinai 0.72 6.68 0.06 0.10 76.78 - 0.86 0.50 Rass Garp M9 Red Sea 0.18 1.01 0.23 0.05 67.95 0.62 0.36 0.67 Empradoor M10 Sinai 1.02 2.03 0.06 0.29 63.72 - 0.83 - Karara M11 Sinai 5.51 21.94 3.47 2.06 52.60 0.51 7.2 0.09 Kerstin South M112 Sinai - 34.93 0.07 0.10 - 1.37 - 8.44 Zandpyaa M13 Aswan 13.18 26.42 0.09 0.25 3.76 12.411.59 14.35 Green Qena M14 Qena K* Th* U* Zn K Na Mg Commercial name, Element Region 0.15 1.47 3.20 0.92 - - 0.15 Glalla ElSuez M1 Suez Golf 0.20 1.36 3.14 0.19 - 3.63 1.03 Alpastar Odysyi M2 Sinai 1.11 2.19 3.46 0.05 - 3.44 1.36 AswadPrown M3 Sinai 0.15 1.29 8.08 0.39 - 4.44 0.83 Glalla KasKremy M4 Suez Golf 0.13 1.08 3.02 0.87 - 3.40 0.67 Red Glalla M5 Suez Golf 0.13 1.38 4.38 0.27 - 3.50 0.93 Prechaa M6 Sinai 0.17 1.47 3.03 0.27 - 3.12 1.11 Khatemaa M7 Sinai 0.22 1.70 7.75 - - 4.31 1.18 Kerstin M8 Sinai 0.13 1.24 6.43 0.65 - 3.62 10.34 Rass Garp M9 Red Sea 0.12 1.86 5.02 0.80 - 6.58 21.55 Empradoor M10 Sinai 0.16 0.97 3.23 - - 2.22 29.83 Karara M11 Sinai 0.18 2.31 6.14 - 1.14 1.46 4.01 Kerstin South M112 Sinai 0.26 0.88 3.43 1.02 0.93 8.65 44.49 Zandpyaa M13 Aswan 4.62 1.38 3.56 1.90 1.80 2.63 21.61 Green Qena M14 Qena 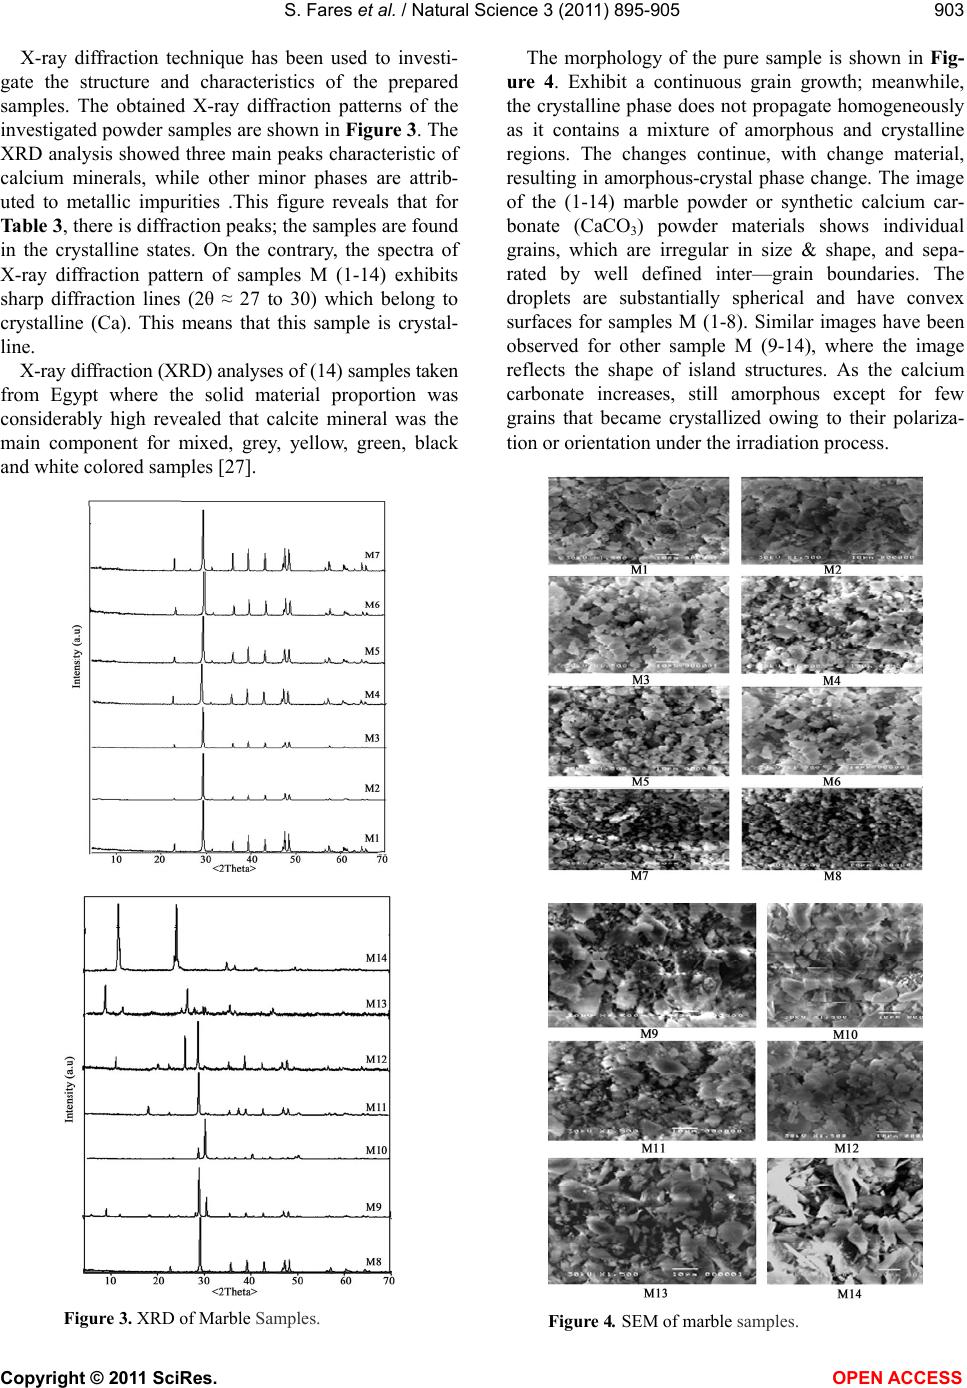 S. Fares et al. / Natural Science 3 (2011) 895-905 Copyright © 2011 SciRes. OPEN ACCESS 903 903 X-ray diffraction technique has been used to investi- gate the structure and characteristics of the prepared samples. The obtained X-ray diffraction patterns of the investigated powder samples are shown in Figure 3. The XRD analysis showed three main peaks characteristic of calcium minerals, while other minor phases are attrib- uted to metallic impurities .This figure reveals that for Table 3, there is diffraction peaks; the samples are found in the crystalline states. On the contrary, the spectra of X-ray diffraction pattern of samples M (1-14) exhibits sharp diffraction lines (2θ ≈ 27 to 30) which belong to crystalline (Ca). This means that this sample is crystal- line. X-ray diffraction (XRD) analyses of (14) samples taken from Egypt where the solid material proportion was considerably high revealed that calcite mineral was the main component for mixed, grey, yellow, green, black and white colored samples [27]. Figure 3. XRD of Marble Samples. The morphology of the pure sample is shown in Fig- ure 4. Exhibit a continuous grain growth; meanwhile, the crystalline phase does not propagate homogeneously as it contains a mixture of amorphous and crystalline regions. The changes continue, with change material, resulting in amorphous-crystal phase change. The image of the (1-14) marble powder or synthetic calcium car- bonate (CaCO3) powder materials shows individual grains, which are irregular in size & shape, and sepa- rated by well defined inter—grain boundaries. The droplets are substantially spherical and have convex surfaces for samples M (1-8). Similar images have been observed for other sample M (9-14), where the image reflects the shape of island structures. As the calcium carbonate increases, still amorphous except for few grains that became crystallized owing to their polariza- tion or orientation under the irradiation process. Figure 4. SEM of marble samples. 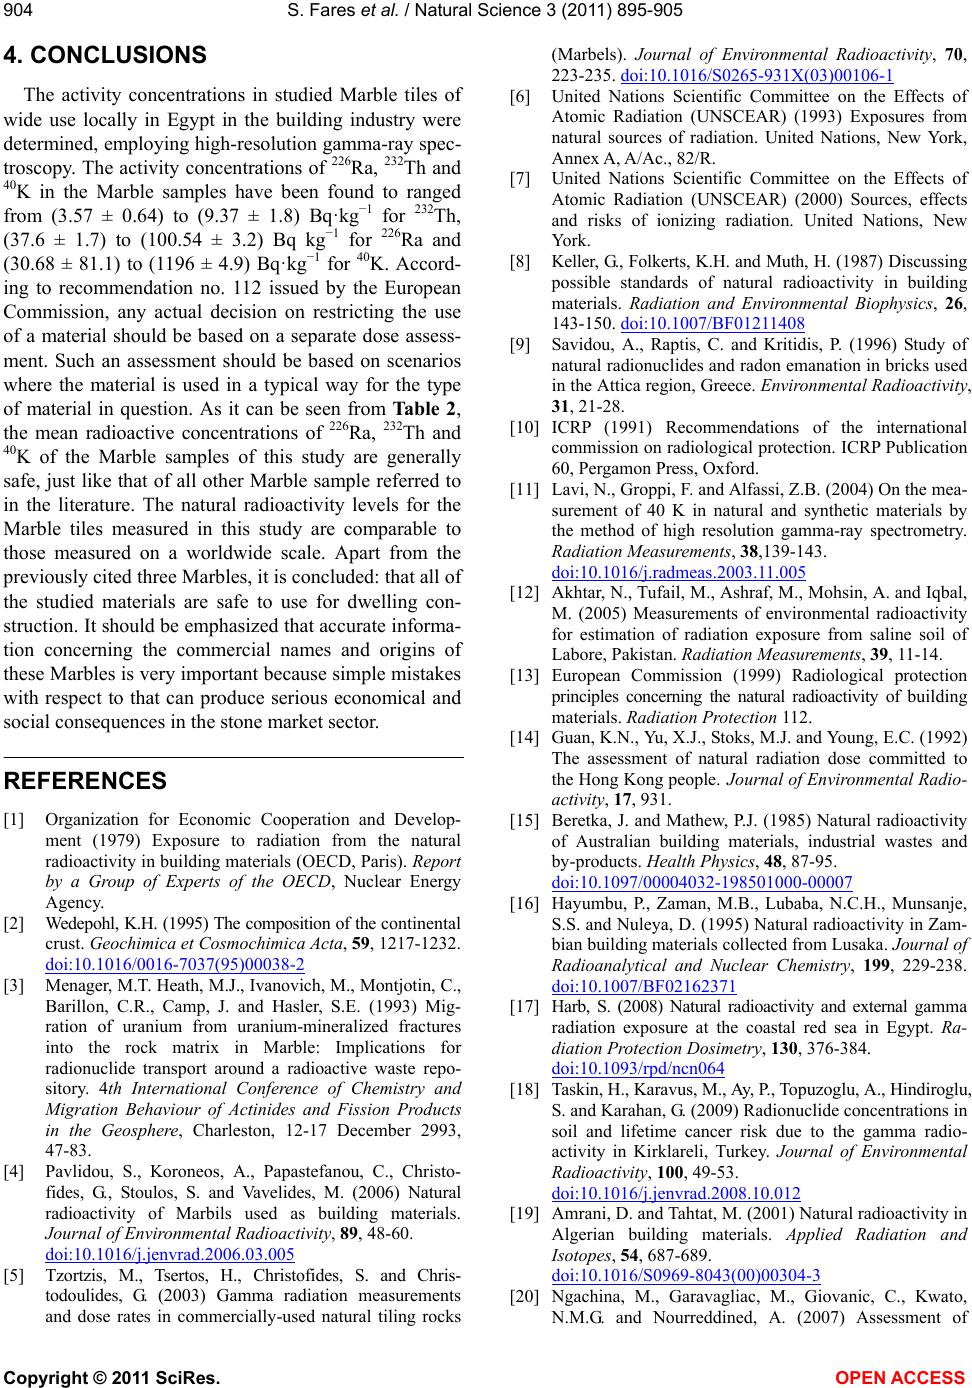 S. Fares et al. / Natural Science 3 (2011) 895-905 Copyright © 2011 SciRes. OPEN ACCESS 904 4. CONCLUSIONS The activity concentrations in studied Marble tiles of wide use locally in Egypt in the building industry were determined, employing high-resolution gamma-ray spec- troscopy. The activity concentrations of 226Ra, 232Th and 40K in the Marble samples have been found to ranged from (3.57 ± 0.64) to (9.37 ± 1.8) Bq·kg−1 for 232Th, (37.6 ± 1.7) to (100.54 ± 3.2) Bq kg−1 for 226Ra and (30.68 ± 81.1) to (1196 ± 4.9) Bq·kg−1 for 40K. Accord- ing to recommendation no. 112 issued by the European Commission, any actual decision on restricting the use of a material should be based on a separate dose assess- ment. Such an assessment should be based on scenarios where the material is used in a typical way for the type of material in question. As it can be seen from Table 2, the mean radioactive concentrations of 226Ra, 232Th and 40K of the Marble samples of this study are generally safe, just like that of all other Marble sample referred to in the literature. The natural radioactivity levels for the Marble tiles measured in this study are comparable to those measured on a worldwide scale. Apart from the previously cited three Marbles, it is concluded: that all of the studied materials are safe to use for dwelling con- struction. It should be emphasized that accurate informa- tion concerning the commercial names and origins of these Marbles is very important because simple mistakes with respect to that can produce serious economical and social consequences in the stone market sector. REFERENCES [1] Organization for Economic Cooperation and Develop- ment (1979) Exposure to radiation from the natural radioactivity in building materials (OECD, Paris). Report by a Group of Experts of the OECD, Nuclear Energy Agency. [2] Wedepohl, K.H. (1995) The composition of the continental crust. Geochimica et Cosmochimica Acta, 59, 1217-1232. doi:10.1016/0016-7037(95)00038-2 [3] Menager, M.T. Heath, M.J., Ivanovich, M., Montjotin, C., Barillon, C.R., Camp, J. and Hasler, S.E. (1993) Mig- ration of uranium from uranium-mineralized fractures into the rock matrix in Marble: Implications for radionuclide transport around a radioactive waste repo- sitory. 4th International Conference of Chemistry and Migration Behaviour of Actinides and Fission Products in the Geosphere, Charleston, 12-17 December 2993, 47-83. [4] Pavlidou, S., Koroneos, A., Papastefanou, C., Christo- fides, G., Stoulos, S. and Vavelides, M. (2006) Natural radioactivity of Marbils used as building materials. Journal of Environmental Radioactivity, 89, 48-60. doi:10.1016/j.jenvrad.2006.03.005 [5] Tzortzis, M., Tsertos, H., Christofides, S. and Chris- todoulides, G. (2003) Gamma radiation measurements and dose rates in commercially-used natural tiling rocks (Marbels). Journal of Environmental Radioactivity, 70, 223-235. doi:10.1016/S0265-931X(03)00106-1 [6] United Nations Scientific Committee on the Effects of Atomic Radiation (UNSCEAR) (1993) Exposures from natural sources of radiation. United Nations, New York, Annex A, A/Ac., 82/R. [7] United Nations Scientific Committee on the Effects of Atomic Radiation (UNSCEAR) (2000) Sources, effects and risks of ionizing radiation. United Nations, New York. [8] Keller, G., Folkerts, K.H. and Muth, H. (1987) Discussing possible standards of natural radioactivity in building materials. Radiation and Environmental Biophysics, 26, 143-150. doi:10.1007/BF01211408 [9] Savidou, A., Raptis, C. and Kritidis, P. (1996) Study of natural radionuclides and radon emanation in bricks used in the Attica region, Greece. Environmental Radioactivity, 31, 21-28. [10] ICRP (1991) Recommendations of the international commission on radiological protection. ICRP Publication 60, Pergamon Press, Oxford. [11] Lavi, N., Groppi, F. and Alfassi, Z.B. (2004) On the mea- surement of 40 K in natural and synthetic materials by the method of high resolution gamma-ray spectrometry. Radiation Measurements, 38,139-143. doi:10.1016/j.radmeas.2003.11.005 [12] Akhtar, N., Tufail, M., Ashraf, M., Mohsin, A. and Iqbal, M. (2005) Measurements of environmental radioactivity for estimation of radiation exposure from saline soil of Labore, Pakistan. Radiation Measurements, 39, 11-14. [13] European Commission (1999) Radiological protection principles concerning the natural radioactivity of building materials. Radiation Protection 112. [14] Guan, K.N., Yu, X.J., Stoks, M.J. and Young, E.C. (1992) The assessment of natural radiation dose committed to the Hong Kong people. Journal of Environmental Radio- activity, 17, 931. [15] Beretka, J. and Mathew, P.J. (1985) Natural radioactivity of Australian building materials, industrial wastes and by-products. Health Physics, 48, 87-95. doi:10.1097/00004032-198501000-00007 [16] Hayumbu, P., Zaman, M.B., Lubaba, N.C.H., Munsanje, S.S. and Nuleya, D. (1995) Natural radioactivity in Zam- bian building materials collected from Lusaka. Journal of Radioanalytical and Nuclear Chemistry, 199, 229-238. doi:10.1007/BF02162371 [17] Harb, S. (2008) Natural radioactivity and external gamma radiation exposure at the coastal red sea in Egypt. Ra- diation Protection Dosimetry, 130, 376-384. doi:10.1093/rpd/ncn064 [18] Taskin, H., Karavus, M., Ay, P., Topuzoglu, A., Hindiroglu, S. and Karahan, G. (2009) Radionuclide concentrations in soil and lifetime cancer risk due to the gamma radio- activity in Kirklareli, Turkey. Journal of Environmental Radioactivity, 100, 49-53. doi:10.1016/j.jenvrad.2008.10.012 [19] Amrani, D. and Tahtat, M. (2001) Natural radioactivity in Algerian building materials. Applied Radiation and Isotopes, 54, 687-689. doi:10.1016/S0969-8043(00)00304-3 [20] Ngachina, M., Garavagliac, M., Giovanic, C., Kwato, N.M.G. and Nourreddined, A. (2007) Assessment of 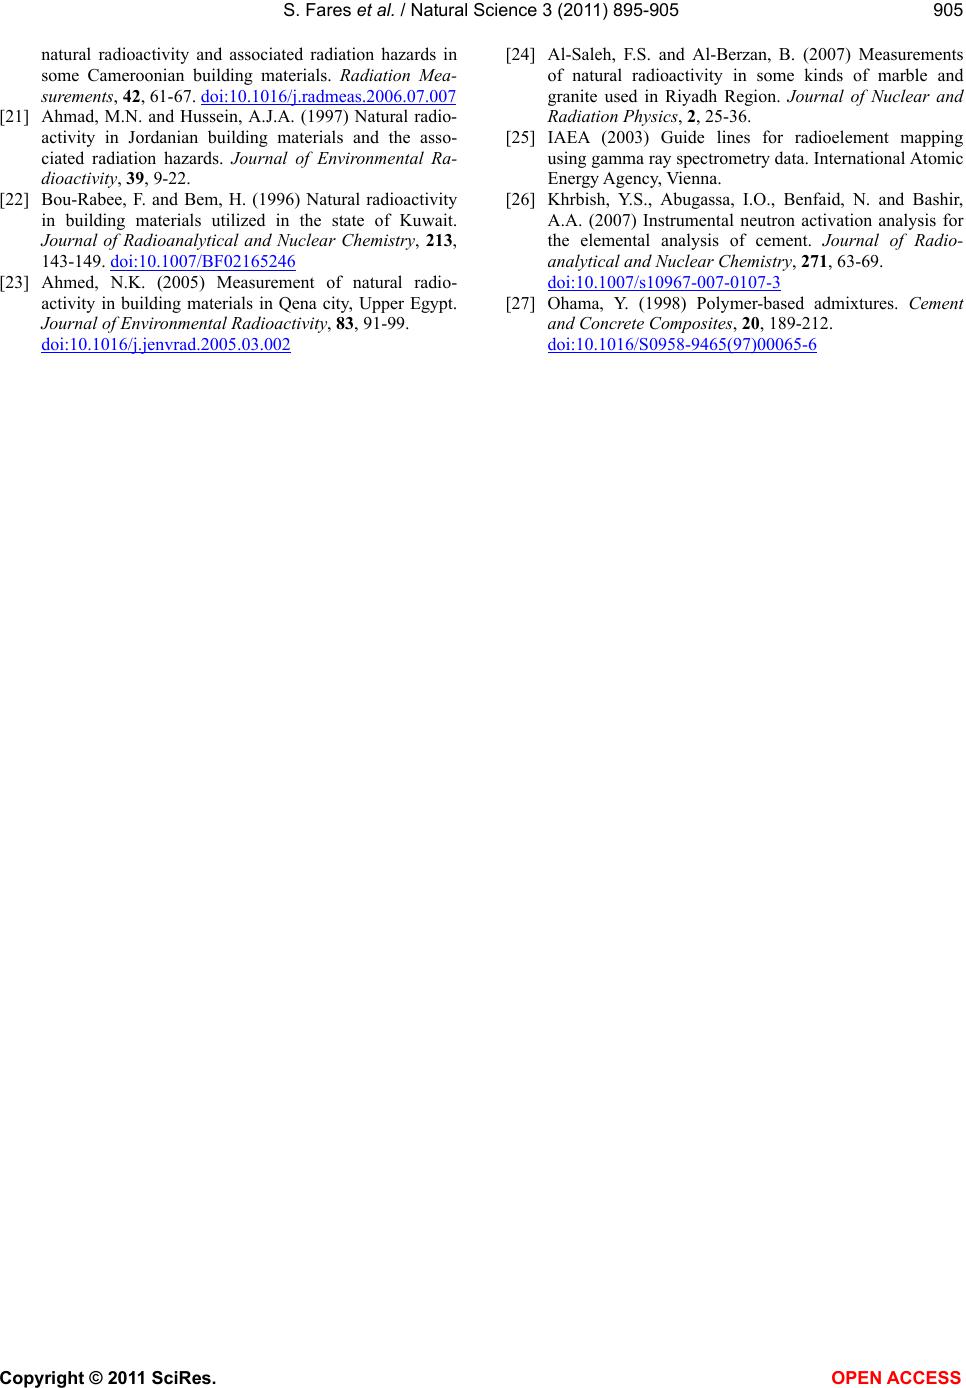 S. Fares et al. / Natural Science 3 (2011) 895-905 Copyright © 2011 SciRes. OPEN ACCESS 905 905 natural radioactivity and associated radiation hazards in some Cameroonian building materials. Radiation Mea- surements, 42, 61-67. doi:10.1016/j.radmeas.2006.07.007 [21] Ahmad, M.N. and Hussein, A.J.A. (1997) Natural radio- activity in Jordanian building materials and the asso- ciated radiation hazards. Journal of Environmental Ra- dioactivity, 39, 9-22. [22] Bou-Rabee, F. and Bem, H. (1996) Natural radioactivity in building materials utilized in the state of Kuwait. Journal of Radioanalytical and Nuclear Chemistry, 213, 143-149. doi:10.1007/BF02165246 [23] Ahmed, N.K. (2005) Measurement of natural radio- activity in building materials in Qena city, Upper Egypt. Journal of Environmental Radioactivity, 83, 91-99. doi:10.1016/j.jenvrad.2005.03.002 [24] Al-Saleh, F.S. and Al-Berzan, B. (2007) Measurements of natural radioactivity in some kinds of marble and granite used in Riyadh Region. Journal of Nuclear and Radiation Physics, 2, 25-36. [25] IAEA (2003) Guide lines for radioelement mapping using gamma ray spectrometry data. International Atomic Energy Agency, Vienna. [26] Khrbish, Y.S., Abugassa, I.O., Benfaid, N. and Bashir, A.A. (2007) Instrumental neutron activation analysis for the elemental analysis of cement. Journal of Radio- analytical and Nuclear Chemistry, 271, 63-69. doi:10.1007/s10967-007-0107-3 [27] Ohama, Y. (1998) Polymer-based admixtures. Cement and Concrete Composites, 20, 189-212. doi:10.1016/S0958-9465(97)00065-6
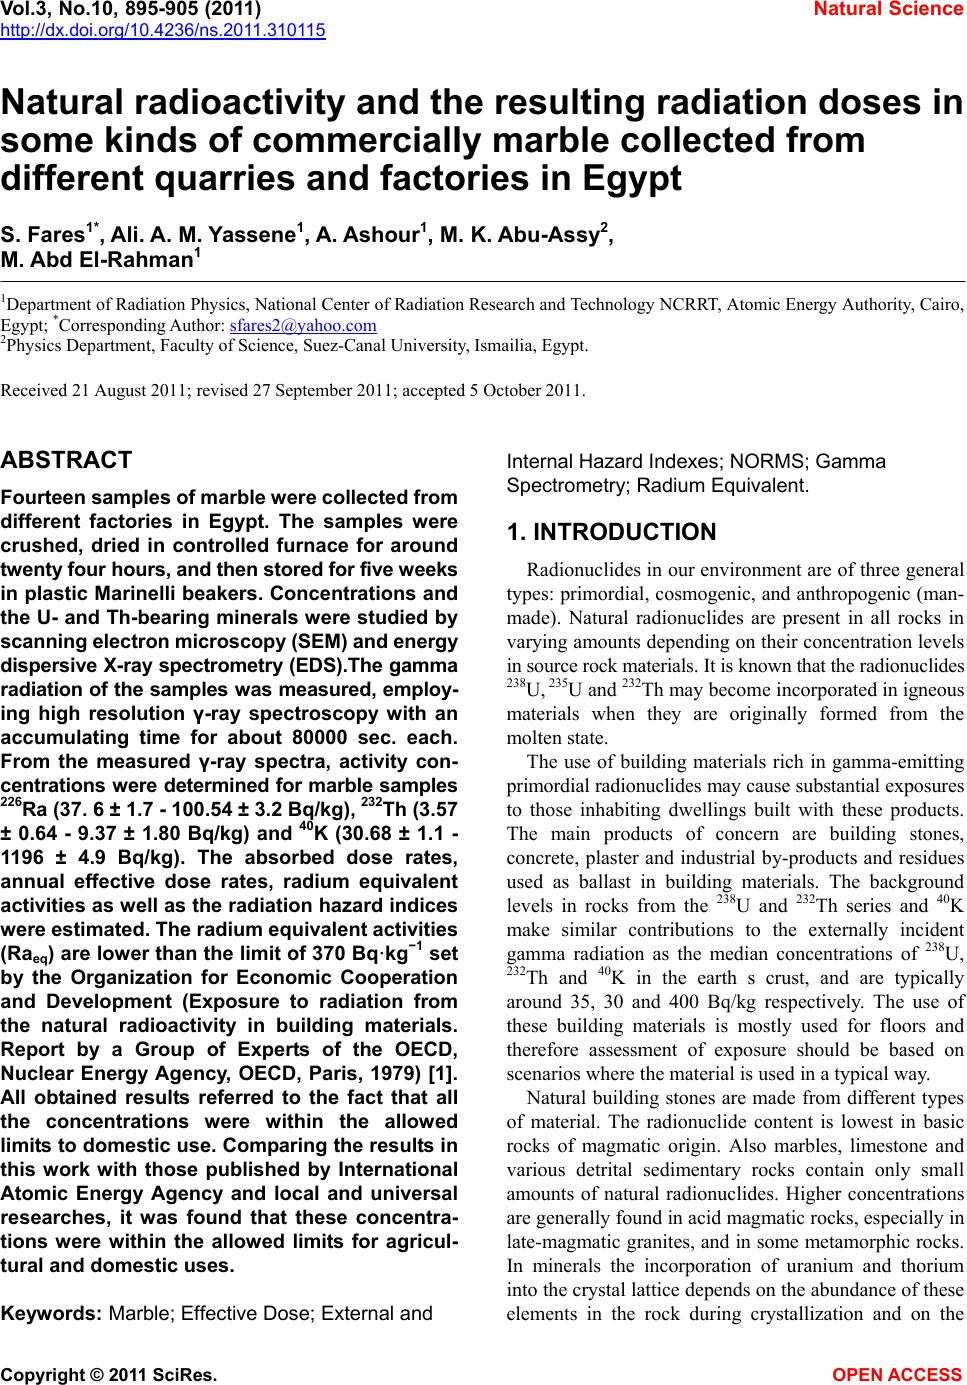
|