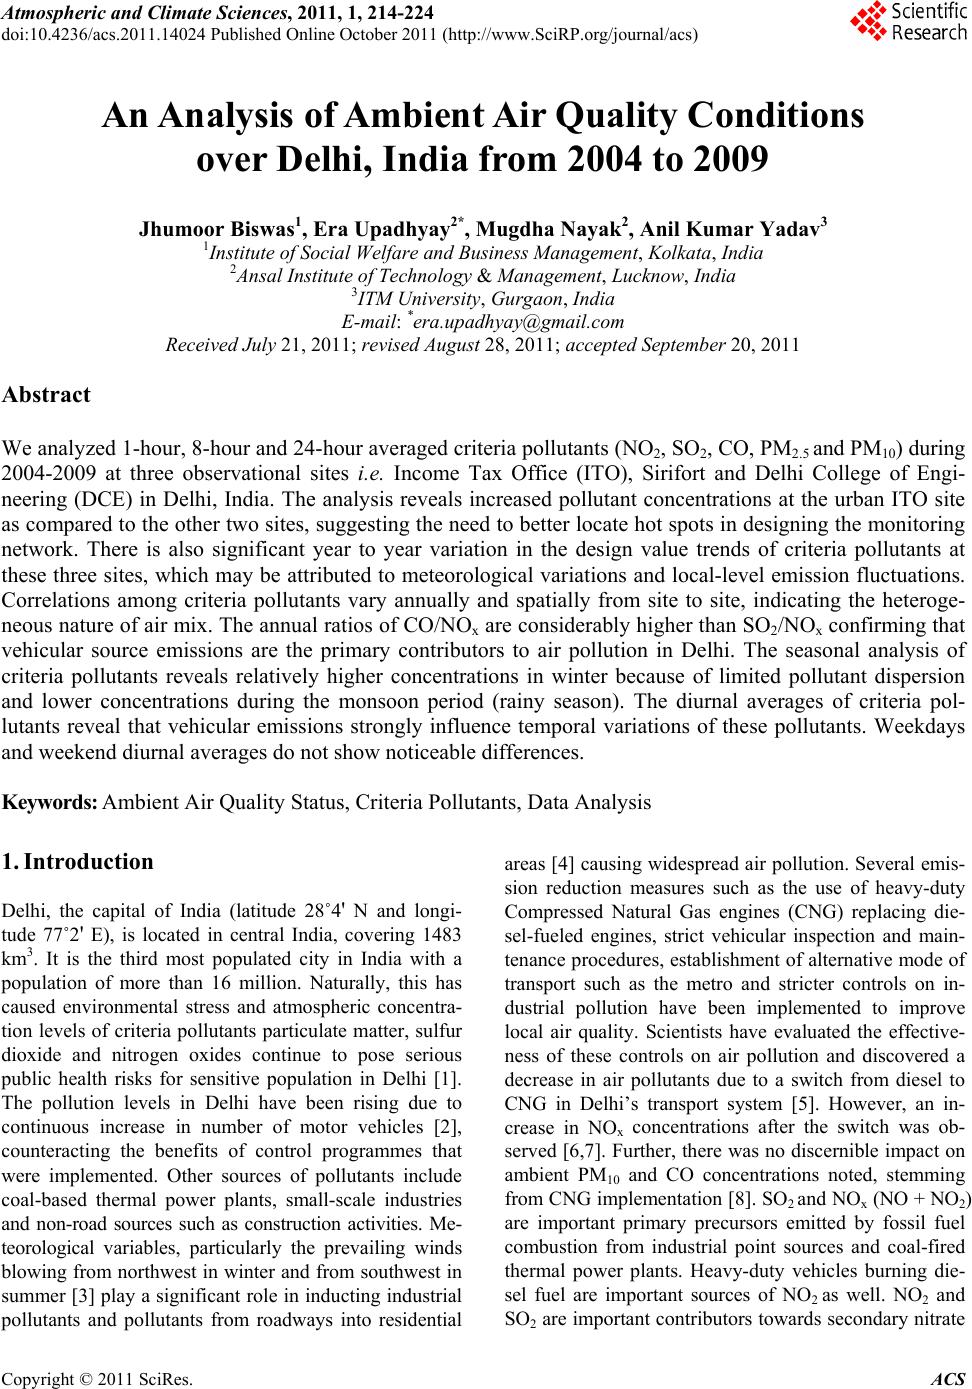
 Atmospheric and Climate Sciences, 2011, 1, 214-224 doi:10.4236/acs.2011.14024 Published Online October 2011 (http://www.SciRP.org/journal/acs) Copyright © 2011 SciRes. ACS An Analysis of Ambient Air Quality Conditions over Delhi, India from 2004 to 2009 Jhumoor Biswas1, Era Upadhyay2*, Mugdha Nayak2, Anil Kumar Yadav3 1Institute of Social Welfare and Business Management, Kolka ta, India 2Ansal Institute o f Technology & Management, Lucknow, India 3ITM University, Gurgaon, India E-mail: *era.upadhyay@gmail.com Received July 21, 2011; revised August 28, 2011; accepted September 20, 2011 Abstract We analyzed 1-hour, 8-hour and 24-hour averaged criteria pollutants (NO2, SO2, CO, PM2.5 and PM10) during 2004-2009 at three observational sites i.e. Income Tax Office (ITO), Sirifort and Delhi College of Engi- neering (DCE) in Delhi, India. The analysis reveals increased pollutant concentrations at the urban ITO site as compared to the other two sites, suggesting the need to better locate hot spots in designing the monitoring network. There is also significant year to year variation in the design value trends of criteria pollutants at these three sites, which may be attributed to meteorological variations and local-level emission fluctuations. Correlations among criteria pollutants vary annually and spatially from site to site, indicating the heteroge- neous nature of air mix. The annual ratios of CO/NOx are considerably higher than SO2/NOx confirming that vehicular source emissions are the primary contributors to air pollution in Delhi. The seasonal analysis of criteria pollutants reveals relatively higher concentrations in winter because of limited pollutant dispersion and lower concentrations during the monsoon period (rainy season). The diurnal averages of criteria pol- lutants reveal that vehicular emissions strongly influence temporal variations of these pollutants. Weekdays and weekend diurnal averages do not show noticeable differences. Keywords: Ambient Air Quality Status, Criteria Pollutants, Data Analysis 1. Introduction Delhi, the capital of India (latitude 28˚4' N and longi- tude 77˚2' E), is located in central India, covering 1483 km3. It is the third most populated city in India with a population of more than 16 million. Naturally, this has caused environmental stress and atmospheric concentra- tion levels of criteria pollutants particulate matter, sulfur dioxide and nitrogen oxides continue to pose serious public health risks for sensitive population in Delhi [1]. The pollution levels in Delhi have been rising due to continuous increase in number of motor vehicles [2], counteracting the benefits of control programmes that were implemented. Other sources of pollutants include coal-based thermal power plants, small-scale industries and non-road sources such as construction activities. Me- teorological variables, particularly the prevailing winds blowing from northwest in winter and from southwest in summer [3] play a significant role in inducting industrial pollutants and pollutants from roadways into residential areas [4] causing widespread air pollution. Several emis- sion reduction measures such as the use of heavy-duty Compressed Natural Gas engines (CNG) replacing die- sel-fueled engines, strict vehicular inspection and main- tenance procedures, establishment of alternative mode of transport such as the metro and stricter controls on in- dustrial pollution have been implemented to improve local air quality. Scientists have evaluated the effective- ness of these controls on air pollution and discovered a decrease in air pollutants due to a switch from diesel to CNG in Delhi’s transport system [5]. However, an in- crease in NOx concentrations after the switch was ob- served [6,7]. Further, there was no discernible impact on ambient PM10 and CO concentrations noted, stemming from CNG implementation [8]. SO2 and NOx (NO + NO2) are important primary precursors emitted by fossil fuel combustion from industrial point sources and coal-fired thermal power plants. Heavy-duty vehicles burning die- sel fuel are important sources of NO2 as well. NO2 and SO2 are important contributors towards secondary nitrate  215 J. BISWAS ET AL. and sulfate formation through a series of complex reac- tions, which are major components of fine particulate matter (PM2.5). Sources of fine particles include all types of combustion including motor vehicles, power plants, residential wood burning, forest fires, agriculture burning and some industrial processes. The study and subsequent control of secondary pollutants are further complicated by the nonlinear nature of their formation processes and the impact of meteorological variability on their concen- trations [9,10]. Evaluation of ambient air quality is a method to verify the effectiveness of the control measures implemented, and for early detection of potentially harmful changes in atmospheric composition. According to a detailed analy- sis of most of the criteria pollutants in Delhi, except for SO2, all criteria pollutants exceeded the National Ambi- ent Air Quality Standards (NAAQS) applicable in USA [11,12]. In this study, the period of interest is from 2004 to 2009. However, observed data available varies from site to site and from pollutant to pollutant. The pollutants used in this study are NO2, SO2, CO, PM2.5 and PM10. Obviously, more observational sites at hot spot locations and residential areas are needed to adequately investigate the spatial variability and to provide a more comprehend- sive status of air quality in Delhi. 2. Prototype Data Collection The observations of pollutants used in this study are ob- tained from Central Pollution Control Board [13] (per- sonal communication) and website (www.cpcb.nic.in). Currently, CPCB has three fixed continuous air quality monitoring sites in Delhi. These are Income Tax Office (ITO), Delhi College of Engineering (DCE) and Sirifort (Figure 1). The operations and maintenance of monitor- ing sites in Delhi are undertaken by CPCB under the nation-wide National Ambient Air Quality Monitoring Program. The data availability at these sites is as follows: 1-hour and 24-hour averaged data for NO2, SO2 at all the three sites (ITO, Sirifort and DCE 2004-2009); 1-hour, 8-hour consecutive averaged values and 24-hour averaged data for CO all three sites (ITO, Sirifort and DCE 2007-2009) since CO concentra- tions are being monitored since 2007 at these sites; 1-hour and 24-hour averaged data for PM2.5 at one site (ITO since 2007) since PM2.5 data is being con- tinuously monitored at this site only; 1-hour and 24-hour averaged data for PM10 at one site (DCE since 2007) since PM10 data is being monitored at this site only. In this analysis, design value trends, persistence of exceedances of pollutants, monthly averages, pollutant ratios and correlation coefficients between various pol- lutants have been used to estimate status of ambient air quality in Delhi. In addition, hourly averages were used for diurnal plots of NO2, SO2, CO, PM2.5 and PM10 for the year 2009. Figure 1. Monitoring sites (ITO, Sirifort and DCE), major roadways and pow e r plants. Copyright © 2011 SciRes. ACS  J. BISWAS ET AL. 216 Site Description The ITO monitoring station is located along a major transport corridor connecting the east side of the river “Yamuna”. This site not only captures the signals from the transport sector, but also the industrial emissions from the East, primarily from the Ghaziabad industrial sectors [14]. The Pragati power plant with a capacity of 282 MW is within 2 km from this site and substantially influences the emissions at this site. Delhi’s outer ring road, a major roadway with a total length of 47 km is within 0.5 km of the ITO site. Sirifort in South Delhi is a semi-urban site enclosed by greenery. However, ma- jor roads including the outer ring road are within a kilometre from this site. Though it is far away from industries, the prevailing winds can bring industrial pollutants into this area from the east (The Badarpur coal-based power plant is about 7 km from this site). DCE is a residential location within a University cam- pus, away from traffic junctions. Although vehicular activities are restricted within the campus, it is still in- fluenced by roadside dust. 3. Data Analysis 3.1. Trends of Criteria Pollutants Utilizing Design Values A pollutant determined to be hazardous to human health and regulated under United States Environmental Prote- ction Agency’s (US EPA’s) National Ambient Air Qual- ity Standards is termed as criteria pollutant. All the ubiq- uitous air pollutants considered in this study meet the above definition of criteria pollutant. A design value is a statistic that describes the air quality status of a given area relative to national ambient air quality standards. Since the CPCB standards of air pollutants are excee- dance-based (24-hour NO2, 24-hour SO2, 8-hour CO, 24- hour PM2.5 and 24-hour PM10), design value calculations expressed as a concentration instead of an exceedance count, allow a direct comparison to the level of the standard. Trends in the design value of criteria pollutants reveal the efficacy of emission controls. The design values for the 8-hour and 24-hour averaged concentrations of pol- lutants have been computed as per CPCB guidelines (www.cpcb.nic.in) which stipulates that the standards for the pollutants are allowed to be exceeded only 2 percent of time annually in each year but not for two consecutive days. According to the above guidelines for an area to be in attainment, 98 percent of time the pollutant levels have to meet the standards. This means that the 98th per- centile of the 24 hr-average values (array size is 365 since there is one 24-averaged value for each day of year) has to meet the standard, which would be the 8th highest value of the pollutant concentration in the sorted array size of 365 values. Similarly for three 8-hour consecu- tive averages considered in a day as in the case of pol- lutant CO, the array size would be 1095 values for each year. In this case the 98th percentile is the 22nd highest value in the sorted array, which has to meet the standard. The design values computed on the second aspect of cri- teria (pollutant levels not exceeding two consecutive days), the lower of two consecutive-days value was stored in the pollutant array and for a given year the maximum if these values was specified as design value criteria which was compared against the NAQQS stan- dard. The results exhibit a similar trend line (Figures not shown). The time series of design values of criteria pollutants represents 8th highest concentration in a year for the 24-hour averaged concentrations (NO2, SO2, PM2.5 and PM10) and 22nd highest concentration for the 8-hour av- eraged values (CO). The longer-term averaging period provides a methodology for reducing the dependence of design values on variable short-term meteorological ef- fects [15], which can mask the impact of regulatory pro- grams on air quality. The trends for 24-hour averaged NO2 and SO2 design values have been assessed from observational data collected since 2004 at all the three monitoring sites. Design values of 24-hour averaged PM2.5 and PM10 concentrations have been analyzed for three years only (2007-2009) at ITO and DCE respec- tively. The 8-hour design value trends have been ana- lyzed for CO from 2007-2009 for all sites. Table 1 pre- sents the CPCB standards along with preliminary meth- ods of measurement of each criteria pollutant. The QA/QC procedures are presented in more details at (http://cpcb.nic.in/oldwebsite/Air/cgcm/cgcm.html). 3.2. Persistence of Exceedance Persistence of exceedance was analyzed for criteria pol- lutants for each year by grouping number of exceedance days. This type of analysis would indicate the frequency of exceedances occurring on two consecutive days as mandated in the standard. Data analysis-correlations, ratios of criteria pollutants, time series analysis, monthly and diurnal averages have been used to identify the sources of the pollutants and represent temporal variations of the pollutants on annual, seasonal and diurnal basis. 4. Results and Discussion 4.1. Design Value Trends of Criteria Pollutants The design value trends of daily 24-hour NO2 and SO2 Copyright © 2011 SciRes. ACS 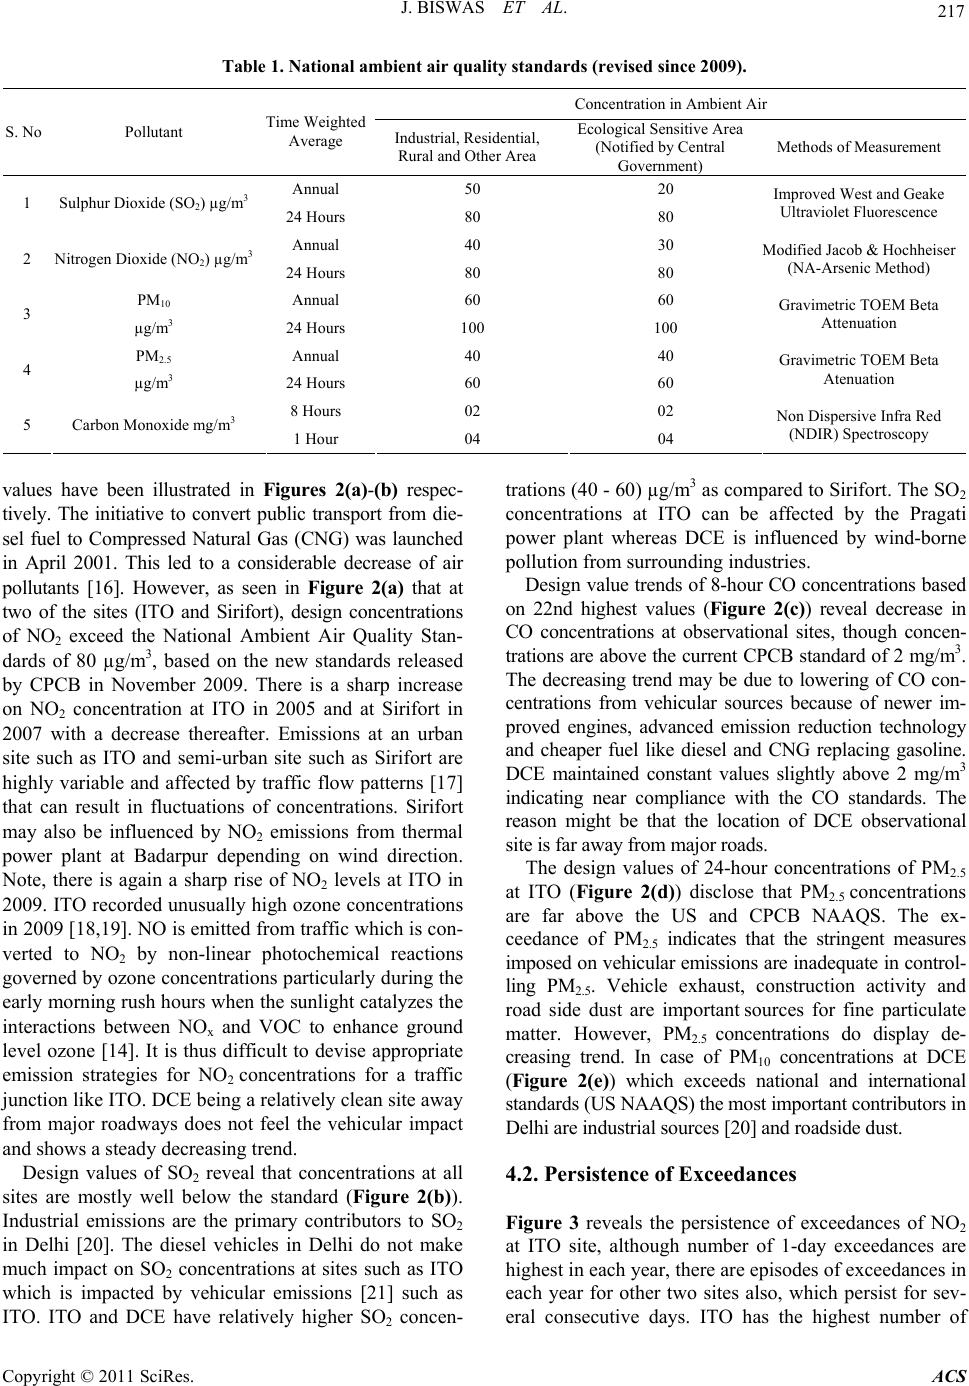 217 J. BISWAS ET AL. Table 1. National ambient air quality standards (revised since 2009). Concentration in Ambient Air S. No Pollutant Time Weighted Average Industrial, Residential, Rural and Other Area Ecological Sensitive Area (Notified by Central Government) Methods of Measurement Annual 50 20 1 Sulphur Dioxide (SO2) µg/m3 24 Hours 80 80 Improved West and Geake Ultraviolet Fluorescence Annual 40 30 2 Nitrogen Dioxide (NO2) µg/m3 24 Hours 80 80 Modified Jacob & Hochheiser (NA-Arsenic Method) PM10 Annual 60 60 3 µg/m3 24 Hours 100 100 Gravimetric TOEM Beta Attenuation PM2.5 Annual 40 40 4 µg/m3 24 Hours 60 60 Gravimetric TOEM Beta Atenuation 8 Hours 02 02 5 Carbon Monoxide mg/m3 1 Hour 04 04 Non Dispersive Infra Red (NDIR) Spectroscopy values have been illustrated in Figures 2(a)-(b) respec- tively. The initiative to convert public transport from die- sel fuel to Compressed Natural Gas (CNG) was launched in April 2001. This led to a considerable decrease of air pollutants [16]. However, as seen in Figure 2(a) that at two of the sites (ITO and Sirifort), design concentrations of NO2 exceed the National Ambient Air Quality Stan- dards of 80 µg/m3, based on the new standards released by CPCB in November 2009. There is a sharp increase on NO2 concentration at ITO in 2005 and at Sirifort in 2007 with a decrease thereafter. Emissions at an urban site such as ITO and semi-urban site such as Sirifort are highly variable and affected by traffic flow patterns [17] that can result in fluctuations of concentrations. Sirifort may also be influenced by NO2 emissions from thermal power plant at Badarpur depending on wind direction. Note, there is again a sharp rise of NO2 levels at ITO in 2009. ITO recorded unusually high ozone concentrations in 2009 [18,19]. NO is emitted from traffic which is con- verted to NO2 by non-linear photochemical reactions governed by ozone concentrations particularly during the early morning rush hours when the sunlight catalyzes the interactions between NOx and VOC to enhance ground level ozone [14]. It is thus difficult to devise appropriate emission strategies for NO2 concentrations for a traffic junction like ITO. DCE being a relatively clean site away from major roadways does not feel the vehicular impact and shows a steady decreasing trend. Design values of SO2 reveal that concentrations at all sites are mostly well below the standard (Figure 2(b)). Industrial emissions are the primary contributors to SO2 in Delhi [20]. The diesel vehicles in Delhi do not make much impact on SO2 concentrations at sites such as ITO which is impacted by vehicular emissions [21] such as ITO. ITO and DCE have relatively higher SO2 concen- trations (40 - 60) µg/m3 as compared to Sirifort. The SO2 concentrations at ITO can be affected by the Pragati power plant whereas DCE is influenced by wind-borne pollution from surrounding industries. Design value trends of 8-hour CO concentrations based on 22nd highest values (Figure 2(c)) reveal decrease in CO concentrations at observational sites, though concen- trations are above the current CPCB standard of 2 mg/m3. The decreasing trend may be due to lowering of CO con- centrations from vehicular sources because of newer im- proved engines, advanced emission reduction technology and cheaper fuel like diesel and CNG replacing gasoline. DCE maintained constant values slightly above 2 mg/m3 indicating near compliance with the CO standards. The reason might be that the location of DCE observational site is far away from major roads. The design values of 24-hour concentrations of PM2.5 at ITO (Figure 2(d)) disclose that PM2.5 concentrations are far above the US and CPCB NAAQS. The ex- ceedance of PM2.5 indicates that the stringent measures imposed on vehicular emissions are inadequate in control- ling PM2.5. Vehicle exhaust, construction activity and road side dust are important sources for fine particulate matter. However, PM2.5 concentrations do display de- creasing trend. In case of PM10 concentrations at DCE (Figure 2(e)) which exceeds national and international standards (US NAAQS) the most important contributors in Delhi are industrial sources [20] and roadside dust. 4.2. Persistence of Exceedances Figure 3 reveals the persistence of exceedances of NO2 at ITO site, although number of 1-day exceedances are highest in each year, there are episodes of exceedances in each year for other two sites also, which persist for sev- eral consecutive days. ITO has the highest number of Copyright © 2011 SciRes. ACS  J. BISWAS ET AL. 218 ‘ (a) (b) (c) (d) (e) Figure 2. (a) Design value trends of NO2 for ITO, Sirifort and DCE, New Delhi; (b) Design values of SO2 at ITO, Sirifort and DCE, New Delhi; (c) Design values of CO at ITO, Sirifort and DCE, New Delhi; (d) Design values of PM2.5 at ITO, New Delhi; (e) Design values of PM10 at DCE, New Delhi. Figure 3. Persistence and count of exceedance. Copyright © 2011 SciRes. ACS  219 J. BISWAS ET AL. persistent exceedances amongst the three sites with highest number of consecutive days ( > 21) exceeding the threshold values in some years. For urban Sirifort and residential DCE although the number of successive days exceeding threshold values is lower than ITO site, there are consecutive days where the standard is exceeded The persistence analysis indicates high concentrations of NO2 at traffic junction at ITO due to dominance of diesel ve- hicles. NO2 shows noticeable day-today autocorrelation lasting for up to two days exhibiting some temporal de- pendence on the previous NO2 levels and atmospheric processes. The persistence of CO exceedances at ITO and Sirifort (Table 2) indicate that unlike NO2 although there is less tendency for CO exceedances to last for more than two consecutive days, CO does not exhibit significant day-to- day autocorrelations, indicating the ambient concentra- tions are more random and not influenced as much by previous day’s concentrations. The persistence of PM2.5 and PM10 exceedances (Ta- ble 3) every year reveal episodes of 2 consecutive days and above exceedances every year since 2007. Particu- late matters also do not divulge autocorrelations. There- fore, persistence of exceedances is influenced by high intermittent emissions of particulate matter. The persistence of exceedance of pollutants questions the validity of standards based on exceedance of two consecutive days. This persistence needs to be taken into account in developing future policy. 4.3. Monthly Averages of Criteria Pollutants Monthly averages of NO2, CO, PM2.5 and PM10 have been studied. For Delhi, CO is considered to be mostly from gasoline-fuelled vehicles, NO2 and PM10 are influenced by vehicular and industrial emissions; PM2.5 by vehicular, industrial and fuelwood emissions in winter. CO does not exhibit noticeable inter-annual variability at any of the three sites, signifying that there is not much variation in emission sources from one year to the next (Figure not shown). However, there is significant inter-annual and seasonal variability in the concentration of other criteria pollutants. PM2.5 is characterized by high concentration in winter and low concentrations in the monsoon due to re- moval by precipitation and wet deposition. High PM10 concentrations in summer can be accounted to the effects of winds from WNW direction [5], which brings dust from the Thar Desert into Delhi. High winter averages for PM2.5 and PM10 occur due to limited pollutant dispersion be- cause of formation of high pressure system over Delhi [11] which results in lower mixing heights with stable bound- ary layers. The high monthly averages of PM2.5 at ITO (Table 4) in January have decreased from 219 g/m3 in 2007 to 150 g/m3 in 2009 exhibiting the impact of con- trol measures on vehicular emission. However, there are also varying sources of emission for PM in the winter months, due to an increase in the bio-mass burning for heating purposes [22] which explains higher peaks of PM10 at residential site such as DCE in winter (Table 4). Table 2. Persistence of NO2 exceedance at Sirifort and DCE (2004-2009). Year ↓ 1 day exceedance 2 day exceedance 3 consecutive days 4 consecutive days 5 consecutive days 6 consecutive days 7 day exceedance 10 consecutive days Site → Sirifort DCE Sirifort DCE Sirifort DCE Sirifort DCE Sirifort DCE Sirifort DCE Sirifort DCE Sirifort DCE 2004 3 0 0 0 0 0 1 0 0 0 0 0 0 0 0 0 2005 0 10 0 2 0 0 0 0 0 2 0 0 0 0 0 0 2006 1 1 1 1 2 0 1 0 0 0 0 0 1 0 0 0 2007 8 3 7 0 3 0 3 0 3 0 0 0 0 0 0 0 2008 4 4 2 0 1 0 1 0 0 0 0 0 0 0 1 0 2009 7 4 3 0 1 0 0 0 0 0 1 0 0 0 0 0 Copyright © 2011 SciRes. ACS  J. BISWAS ET AL. 220 Table 3. Count of exceedances for particulate matter. 2007 PM2.5 (ITO) PM10 (DCE) Count of exceedances Frequency Count of exceedances Frequency 1-day 2 1-day 8 2-day 4 2-day 2 3-day 3 3-day 1 4-day 3 4-day 2 5-day 2 5-day 6 9-day 1 6-day 2 16-day 1 7-day 1 22-day 1 8-day 1 33-day 1 9-day 1 13-day 1 14-day 1 16-day 1 2008 PM2.5 (ITO) PM10(DCE) Count of exceedances Frequency Count of exceedances Frequency 1-day 3 1-day 5 2-day 2 2-day 2 3-day 2 3-day 2 4-day 1 4-day 2 5-day 2 5-day 2 9-day 1 6-day 1 11-day 1 7-day 1 23-day 1 14-day 1 28-day 1 33 -day 2 30-day 1 39-day 1 39-day 1 2009 PM2.5 (ITO) PM10 (DCE) Count of exceedances Frequency Count of exceedances Frequency 1-day 7 1-day 7 2-day 8 2-day 3 3-day 1 3-day 2 4-day 1 4-day 1 5-day 1 5-day 1 6-day 2 6-day 4 7-day 1 7-day 2 18-day 1 10-day 1 12-day 1 15-day 1 17-day 1 18-day 1 Copyright © 2011 SciRes. ACS  J. BISWAS ET AL. Copyright © 2011 SciRes. ACS 221 4.4. Ratios of Pollutants As stated before vehicles are primary sources of carbon monoxide and nitrogen oxides (NOx) in urban regions. NO is reactive, is emitted from anthropogenic sources and converted to NO2. Impacts of mobile source emis- sions are associated with high CO/NO2 ratios and low SO2/NO2 ratios whereas impacts of point source is seen with lower CO/NO2 ratios and higher SO2/NO2 ratios [13]. Data from three monitoring sites were analyzed for CO/NO2 ratios and SO2/NO2 ratios from 2007 to 2009 (Table 5). The annual ratios of CO/NO2 are considerably higher than SO2/NO2 at all the three sites, confirming mobile emissions to be the primary source of air pollut- ants at the three sites. The uncharacteristic low value of CO/NO2 ratio at Sirifort in 2007 can be accounted for by the spike in NO2 emissions (Figure 2(a)). ITO has lower CO/NO2 ratios as compared to Sirifort and DCE. At ITO, the NO2 emissions are correspondingly higher because of the effect of industrial NO2 emissions from Pragati ther- mal power plant and the proximity of outer ring road where diesel-powered trucks run during night hours bringing in excess NO2 emissions into the site. At ITO the ratio shows a sharp increase in 2008 and this effect might be due to variable impact of NO2 emissions from Pragati thermal power plant and traffic at crossroads in the vicinity. These results support the findings of analy- sis with 1998 and 1999 ambient data, which demon- strated higher CO/NO2 ratios at ITO site in comparison to SO2/NO x ratios [11,12]. The seasonal ratios of these pollutants have also been computed (Table not shown). The SO2/NO2 ratios do not exhibit significant seasonal variations. However, CO/NO2 ratios do show an increase during the period (April-September) that includes the rainy season as NO2 is washed out by precipitation and CO is not as much affected since it is an inert compound. Winter months are characterized by increasing concen- tration levels of both the pollutants and, thus, the sea- sonal ratios are not much affected. 4.5. Correlations among Pollutants The preliminary correlation analysis considered 24-hour averaged values of pollutants since 2007 to maintain consistency amongst pollutants. Linear regression of the statistical data reveals variable correlations between all pollutants for all three sites. Although more NOx is emit- ted from diesel vehicles and more CO from gasoline ve- hicles, higher correlations in 2007 and 2008 at ITO site, indicate the emission mix is more homogeneous at ITO [16] than at Sirifort and DCE. The correlations between NOx and PM2.5 are higher in 2007 and 2008 at ITO since both originate primarily from vehicular exhaust emissions Table 4. Monthly averages of PM2.5 at ITO and PM10 at DCE. PM10 at DCE (mg/m3) PM2.5 at ITO (mg/m3) Month 200720082009 2007 2008 2009 January 397475254.52 219.67 151.64149.58 February 232337228.2 137.73 137.73122.57 March 202271215.49 79.49 79.4987.26 April 355185264.62 96.84 96.8455.5 May 225185198.25 67.66 67.6654 June 17296 150.36 63.33 63.3369.1 July 102106116.13 45.08 45.0851.65 August 99 89 NA 33.78 33.7839.19 September102115 NA 47.35 47.3533.85 October 291307268 159.89 159.89138.74 November370356NA NA NA NA December373325NA 189.32 178.67 NA Table 5. CO/NOx and SO2/NOx Annual Ratios at ITO, Siri- fort and DCE, New Delhi. Annual Ratios at ITO Year CO/NO2 SO2/NO2 2007 6.40 0.06 2008 15.95 0.10 2009 24.04 0.05 Annual Ratios at Sirifort Year CO/NO2 SO2/NO2 2007 18.39 0.14 2008 32.07 0.22 2009 62.80 0.5 Annual Ratios at DCE Year CO/NO2 SO2/NO2 2007 45.92 0.52 2008 43.08 0.44 2009 77.96 1.1 and poor correlation between NO2 and PM10 suggests different sources of origin. In the Delhi region, signify- cant proportions of PM10 concentrations are initiated by roadside dust, industrial emissions and long-distance transport from the Thar Desert during summer time.  J. BISWAS ET AL. 222 There is no significant correlation between SO2 and any of the pollutants for any year (not shown in Table). The significance of correlation test shows no significant cor- relations between pollutants in 2009. The spatial and annual variability of correlations (poor correlations in 2009 in comparison to 2007 and 2009) between the pol- lutants (Table 6) also depict the uncertainty of emission sources and influence of meteorological parameters such as temperature, wind speed and wind direction on emis- sion mix. 4.6. Diurnal Averages of Criteria Pollutants Study of spatio-temporal characteristics of criteria pollut- ants is important to devise appropriate control strategies for them. The diurnal averages of pollutants reveal varia- tions that occur because complex physical and chemical processes, which determine pollutant concentrations, are impacted by factors such as spatio-temporal variations of emission sources, daytime and nighttime chemistry of atmosphere, pollutant transport, and precipitation. PM2.5 averaged diurnal profile at ITO (Figure 4(a)), revealing early morning peak at 6 am followed by office rush hour traffic around 10 am. The PM2.5 peak is at eve- ning rush hour at 6 pm and rising concentration till mid night because of diesel fueled trucks travelling on outer ring road close to the ITO site and stable boundary layer, which cause nighttime increase in PM2.5. The NO2 averaged diurnal profile (Figure 4(b)) indi- cates that NO2 concentrations are much higher at ITO in comparison to Sirifort and DCE. The trend of NO2 val- ues at ITO is dictated by diesel vehicles and is strongly correlated with traffic rush hours. There is a peak in morning office rush hours during 7 am to 9 am. There is again a rise from 6 pm due to evening rush hour traffic. NO2 concentrations at Sirifort and DCE are not much affected by traffic as compared to ITO. Weekends do not have any significant impact on NO2 concentrations at all the three sites. The CO diurnal (Figure 4(c)) profile is traffic related at all the three sites with rush hour traffic signal during morning and evening hours manifested at all the three sites. ITO has the highest CO concentration. Both ITO and Sirifort are characterized by higher nighttime con- centrations. The elevated levels of nighttime concentra- tions of CO persist in the presence of stable boundary layer. CO is not affected by nighttime chemistry in the atmosphere. It is also seen that at the urban ITO site there are no significant differences between weekday and weekend effects. However, at DCE and the Sirifort sites there is a slight drop in CO concentrations over weekend indicating lesser traffic influence during this period. (a) (b) (c) Figure 4. (a) Diurnal average of PM2.5 at ITO, New Delhi. (b) Diurnal average of NO2 at ITO, DCE and Sirifort, New Delhi. (c) Diurnal average of CO at ITO, DCE and Sirifor t , New De lhi. Copyright © 2011 SciRes. ACS  223 J. BISWAS ET AL. Table 6. Correlations of pollutants. Correlation for NO2 vs. CO concentration Year ITO Sirifort DCE 2007 0.643 0.701 0.085 2008 0.392 0.088 0.207 2009 0.069 0.26 0.121 Correlation for NO2 vs. PM2.5 at ITO, New Delhi Correlation for NO2 vs. PM10 at DCE, New Delhi 2007 0.545 2007 0.171 2008 0.456 2008 0.054 2009 0.20 2009 0.26 5. Summary A study was conducted with analysis of 1-hour, 8-hour and 24-hour averaged values of criteria pollutants at three monitoring sites over the Delhi region, to examine the spatio-temporal variability of the pollutants at these sites and examine the status of ambient air quality in Delhi. The results derived from the most recent observa- tions for the years 2004-2009 reaffirmed the conclu- sions drawn by earlier studies that mobile sources con- tribute mostly to emissions loading. It is as well revealed that although ambient concentrations of SO2 are still un- der control, the design values for NO2, CO and PM2.5 exhibit exceedance. There is considerable variability in the NO2 design value at ITO, signifying that meteoro- logical uncertainties and emission fluctuations have to be considered in designing emission controls. The persis- tence of exceedance needs to be taken into account in designing policy that two consecutive days’ exceedance can be treated as violation of ambient air quality stan- dards; more realistic procedures should be set as criteria to meet the standards. The variability in monthly aver- ages of pollutants denotes the impact of seasonal vari- ability on concentrations. The high CO/NOx ratios indi- cate that gasoline-powered vehicles are significant con- tributors of air pollution at all the three sites. Low values of SO2/NOx indicate that point sources contribute mainly to SO2 concentrations [11]. Despite exceedance, decrease of annual monthly concentrations of PM2.5 suggests the benefits of vehicular emissions reduction measures. An- nual ratios indicate traffic emissions as primary source for NOx, CO and PM2.5. The diurnal averages of criteria pollutants disclose that vehicular emissions are the main contributor towards temporal variation of these pollut- ants. Weekday and weekend diurnal averages do not show noticeable differences. Detailed emissions invent- tory and advanced modeling approaches are required to present more realistic future scenarios for developing emissions control programs. A more comprehensive and holistic picture of air quality assessment in Delhi can occur only when better temporal and spatial coverage of emissions, meteorological and air quality data are inte- grated with appropriate modeling approaches. 6. Acknowledgements The authors are thankful to Central Pollution Control Board (CPCB) for providing the data and are grateful to the anonymous reviewers for the comments which helped improve quality of the paper. 7. References [1] J. S. Pandey, K. Rakesh and S. Devotta, “Health Risks of NO2, SPM and SO2 in Delhi (India),” Atmospheric Envi- ronment, Vol. 39, No. 36, 2005, pp. 6868-6874. doi:10.1016/j.atmosenv.2005.08.004 [2] MOEF, “White Paper on Air Pollution on Delhi with an Action Plan,” Ministry of Environment and Forests, Delhi, 1997. [3] K. Varshney and P. K. Padhy, “Total Volatile Organic Compounds in Urban Environment of Delhi,” Journal of Air and Waste Management Association, Vol. 48, 1998, pp. 448-453. [4] K. Srivastava and V. K. Jain, “A Study to Characterize the Influence of Outdoor SPM and Metals on Indoor En- vironments in Delhi,” Journal of Environmental Science and Engineering, Vol. 47, No. 3, 2005, pp. 222-231. [5] P. Goyal and Sidhartha, “Present Scenario of Air Quality in Delhi: A Case Study of CNG Implementation,” At- mospheric Environment, Vol. 37, 2003, pp. 5423-5431. [6] R. Khaiwal, E. Wauters, S. Tyagi, M. Suman and R. V. Grieken, “Assessment of Air Quality after the Implemen- tation of Compressed Natural Gas (CNG) as Fuel in Pub- lic Transport in Delhi, India,” Environmental Monitoring and Assessment, Vol. 115, No. 1-3, 2006, pp. 405-417. doi:10.1007/s10661-006-7051-5 Copyright © 2011 SciRes. ACS  J. BISWAS ET AL. 224 [7] V. Kathuria, “Impact of CNG on Vehicular Pollution in Delhi: A Note. Transportation Research Part D,” Trans- port and Environment, Vol. 9, No. 5, 2004, pp. 409-417. doi:10.1016/j.trd.2004.05.003 [8] S. Mukherjee and V. Kathuria, “Is Economic Growth Sustainable? Environmental Quality of Indian States after 1991,” International Journal of Sustainable Development, Vol. 57, No. 3, 2006, pp. 477-493. [9] A. Chaloulakou, P. Kassomenos, N. Spyrellis and P. Koutrakis, “Measurements of PM10 and PM2.5 Particle Concentrations in Athens, Greece,” Atmospheric Envi- ronment, Vol. 37, No. 5, 2003, pp. 649-660. doi:10.1016/S1352-2310(02)00898-1 [10] S. T. Rao, I. G. Zurbenko, R. Neagu, P. S. Porter, J. Y. Ku and R. F. Henry, “Space and Time Scales in Ambient Ozone Data,” Bulletin of the American Meteorological Society, Vol. 78, No. 10, 1997, pp. 2153-2166. doi:10.1175/1520-0477(1997)078<2153:SATSIA>2.0.C O;2 [11] V. P. Aneja, A. Agarwal, P. A. Roelle, S. B. Phillips, Q. Tong, N. Watkins and R. Yablonsky, “Measurements and Analysis of Criteria Pollutants in New Delhi, India,” En- vironment International, Vol. 27, No. 1, 2001, pp. 35-42. doi:10.1016/S0160-4120(01)00051-4 [12] V. P. Aneja, B. E. Hartsell, D. S. Kim and D. Grosjean, “Peroxyacetyl Nitrate in Atlanta, GA: Comparison and Analysis of Ambient Data for Suburban and Downtown Locations,” Journal of the Air and Waste Management Association, Vol. 49, 1999, pp. 174-185. [13] Central Pollution Control Board (CPCB), Data. http://cpcb. nic.in [14] S. Guttikunda, “Photochemistry of Air Pollution in Delhi, India: A Monitoring Based Analysis,” SIM-Air Working Paper Series, Vol. 25, 2009a, pp. 1-12. [15] J. M. Jones, C. Hogrefe, R. F. Henry, J. Ku and G. Sistla, “An Assessment of the Sensitivity and Reliability of the Relative Reduction Factor Approach in the Development of 8-hr Ozone Attainment Plans,” Journal of Air and Waste Management Association, Vol. 55, 2005, pp. 13-19. [16] D. Parrish, M. Trainer, M. P. Buhr, B. A. Watkins and F. C. Fehsenfeld, “Carbon Monoxide Concentrations and Their Relation to Concentrations of Total Reactive Oxi- dized Nitrogen at Two Rural U. S. Sites,” Journal of Geophysical Research, Vol. 96, No. D5, 1991, pp. 9309- 9320. doi:10.1029/91JD00047 [17] S. Gokhale and M. Khare, “Vehicle Wake Factor for Heterogeneous Traffic in Urban Environments,” Interna- tional Journal of Environment and Pollution, Vol. 30, No. 1, 2007, pp. 97-105. doi:10.1504/IJEP.2007.014505 [18] CSE, “Delhi Is Reeling under High Levels of Deadly Ozone, Says Latest CSE Analysis,” Centre for Science and Environment, New Delhi, 2009. [19] CSE, “The Smokescreen of Lies: Myths and Facts about CNG, Right to Clean Air Campaign Team,” Centre for Science and Environment, New Delhi, 2001. [20] R. Gurjar, J. A. Van Aardenne, J. Lelieveld and M. Mohan, “Emissions Estimates and Trends (1990-2000) for Megacity Delhi and Implications,” Atmospheric En- vironment, Vol. 38, No. 33, 2004, pp. 5663-5681. doi:10.1016/j.atmosenv.2004.05.057 [21] R. Gurjar, T. M. Butler, M. G. Lawrence and J. Lelieveld, “Evaluation of Emissions and Air Quality in Megacities,” Atmospheric Environment, Vol. 42, No. 7, 2002, pp. 1593-1606. doi:10.1016/j.atmosenv.2007.10.048 [22] S. Guttikunda, “Air Quality Management in Delhi, India: Then, Now and Next. Air Quality Management in Delhi, India,” SIM-Air Working Paper Series, Vol. 22, 2009b, pp. 1-8. Copyright © 2011 SciRes. ACS
|