Journal of Geographic Information System, 2011, 3, 367-372
doi:10.4236/jgis.2011.34035 Published Online October 2011 (http://www.SciRP.org/journal/jgis)
Copyright © 2011 SciRes. JGIS
Spatial Analysis for Flood Control by Using Environmental
Modeling
Alireza Gharagozlou*, Hassan Nazari, Mohammadjavad Seddighi
Geomatics College of National Cartograph ic Center of Iran (NCC), Tehran, Iran
E-mail: *agharagozlu@yahoo.com
Received June 22, 2011; revised July 25, 2011; accepted August 6, 2011
Abstract
To create the final spatial information and analysis, flood hazard maps and land development priority maps
and information, data for the flood events to 2009 in north of Iran were incorporated with using Geo-spatial
Information System data of physiographic divisions, geologic divisions, land cover classification, elevation,
drainage network, administrative districts and population density and environmental parameters modeling.
Special analysis also attention was paid to population density for the construction of the land development
priority map and using satellite image analysis to determine land use changes and analysis of geo-spatial in-
formation, because highly dense populated areas represent the highly important urban and industrial areas.
While geo-information technology offers an opportunity to support flood management adequate geo-spatial
information is a prerequisite for sustainable development, but many parts of the world lack adequate infor-
mation on environmental resources. Such information providing, which serves as an important tool for deci-
sion-making in land use planning, can help provide effective information to natural disaster management.
This paper develops a framework for flood control and begins with some general comments on the impor-
tance of land use planning and outlines some current environmental issues and then presenting environ-
mental models to use in disaster management plan by using GIS and remote sensing results. Flood control is
a complex problem that requires cooperation of many scientists in different fields. The article also discusses
the role that geo-information and environmental planning and GIS and remote sensing technology play in
disaster management control to reduce negative impacts of flood and present proper alternatives for develop-
ing of Gorganrood in the north of Iran. Advanced high-resolution sensor technology has provided immense
scope to the decision makers for analysis of flood and damages details using GIS and remote sensing.
Keywords: Environmental Modeling, Land Use Planning, Geo-Spatial Information, GIS
1. Introduction
This article begins with some general comments on the
importance of land use planning and outlines some cur-
rent environmental issues. It also highlights the connec-
tion between land use planning and sustainable develop-
ment and the discussion describes several key methods
of resource identification, with particular emphasis on
existing potential of geo-information technology that
offers an opportunity to support disaster management:
floods and environmental impacts assessment and natural
disaster in national level. The article also discusses the
role of geo-information data in promoting geographic
information system use. By attention to natural disasters
in Iran especially flood in Golestan in the North of Iran
proper assessment of flood by using environmental de-
velopment models and GIS and with attention to Sus-
tainable development approach and disaster management
are presented. The article offers proposed models that
illustrate how GIS and remote sensing data can be used
in land use planning programs that take a sustainable
development approach [1] and disaster management
(flood). Excessive land use and increased human im-
pacts have imposed significant pressures on the envi-
ronment worldwide. These effects are increasingly no-
ticeable from a scientific and technical viewpoint. Fu-
ture development should proceed on the basis of proper
land use planning, with minimum destruction of the en-
vironment because impacts of human activities results
natural disasters in some area [2]. Planning assessments
must therefore consider environmental issues and natu-
ral disaster (flood) and use environmental and geo-
A. GHARAGOZLOU ET AL.
368
referenced information to refine decisions. Gathering
information reveals the available potential of the envi-
ronment; development planning at the nationwide level
can help decision-makers identify resources and target
their future scientific studies to reach sustainable devel-
opment.
Moreover, each minute, 5.6 hectares of forest are be-
ing destroyed and some other human activities cause
disaster such as flood in some parts of the world.
2. Materials and Methods
Floods are one of the most common hazards in the world
also in the some parts of north of Iran. Flood effects can
be local, impacting a neighborhood or community, or
very large, affecting entire river basins and multiple
states [3]. However, all floods are not alike. Floods
themselves average four billion dollars annually in prop-
erty damage alone. Some floods develop slowly, some-
times over a period of days. But flash floods can develop
quickly, sometimes in just a few minutes and without
any visible signs of rain. Flash floods often have a dan-
gerous wall of roaring water that carries rocks, mud, and
other debris and can sweep away most things in its path.
Overland flooding occurs outside a defined river or
stream, such as when a levee is br eached, but still can be
destructive. Some general reasons of flood include:
weather related reasons: heavy rainfall, duration of pre-
cipitation, sudd en snow melting and physical condition s:
soil variety, slop of lands, land degradation and human
activities: deforestation, misusing of land and transform-
ing to grasslands or agricultural area, misconstruction of
roads, bridges, dams and environmental situations.
Flooding can also occur when a dam breaks, producing
effects similar to flash floods. Be aware of flood hazards
no matter where you live, but especially if you live in a
low-lying area, near water or downstream from a dam.
Even very small streams, gullies, creeks, culverts, dry
streambeds, or low-lying ground that appear harmless in
dry weather can flood every state is at risk from this haz-
ard [4]. Some scientists think the major problem about
natural disaster and flood is in the improper exploitation
of land [5]. By using process of plan compilation with a
land use planning approach some important negative
impacts that cause flood is under our control.
2.1. Identification of Land Resources for
Planning
Statistics and sampling, conversion of the aerial photos,
satellite images and topographic maps, automatic con-
version of aerial photos and satellite images and data of
remote sensing, geographic information systems are dif-
ferent methods of identification of resources. One of the
objectives of th is study is to utilize GIS data to con struct
a set of GIS data, a flood hazard map, and land develop-
ment priority map to help the responsible authorities de-
velop, design and operate flood control infrastruct ure and
prepared aid and relief operations for high-risk areas
during future floods. In recent years the combination of
3D-laser scanning and side-scan can be very beneficial
for mapping complicated water side areas; the two sys-
tems are complementary [6]. To geo-reference the rela-
tive location, GPS positioning required.
It should be clear that presenting an environmental de-
velopment model to be used in a GIS for natural disaster
management has a lot of restrictions and limitations [7]
whose description would lead too far here. Some factors
that have been considered in presenting the model in-
clude; industrial sites, transportation networks, weather
and climate data, landform, elevation, slop, geology, bed-
rock, soil, water resources, vegetation, installations and
buildings, energy transmission stations, natural resources,
gardens, forests, parks, etc. the priority of the mentioned
parameters are different in the model[8]. It is clear that
north of Iran and Golestan has an environmental devel-
opment context and is under the interactive effects of the
large region. Also it is thus impossible to correctly ana-
lyze the environmental conditions for natural disaster
management without considering the social and economic
activities in this district.
3. Modeling
Environmental modeling is a complex problem that re-
quires cooperation of many scientists in different areas.
In this paper, the architecture and results of environ-
mental modeling and using satellite image processing
and GIS for Flood control is presented. Set out below are
mathematical linear models for flood management in
Golestan. Flood inundation modeling requires distributed
model predictions to inform major decisions relating to
planning [9]. Present flood model in tegr ates GIS with the
environmental modeling and greatest daily of precipita-
tion from1995 to 2009 to determine improper area for
development. A linear mathematical model for flood
management has been Introduced because proper plan-
ning based on environmental potentials cause reduce risk
potentials of flood in future and this linear model with
attention to planning results sufficient for development
impacts on disaster. FF refer to specific model with en-
vironmental planning approach for flood management
and attention proper land use planning in the region that
present location of improper area for development. Pre-
dicting the river’s flood is one of the important factors
for design of dams and hydraulic structures and regional
Copyright © 2011 SciRes. JGIS
A. GHARAGOZLOU ET AL.
Copyright © 2011 SciRes. JGIS
369
and urban development planning. As geo-information
data also used in flood management, many problems
occur in flood estimation. One of the methods for plan-
ning is determination improper area for development by
environmental modeling, statistics and using GIS/RS
technology [10].
R= S (4,5,6,7,8) + AS (1,2,3,7,8) +H (1,2,3,4) +B ((x,y)>RR)
RR= R1 (V1+M1) +R2 (V2+M2) +R3 (V3+M3) +…. FF= S(5,6)+H(5,6)+ QA(2,3,4)+MA(1,2,3)
+WS(5,6)+SO(1,2,4,5,6)+SW(1,2,3)+NI(1,2,3)+HP(1,2,3)+HBU(1,2,3)+HBR(1,2)
+So (3,4,5,7,8,9,10,11) + Sd (4,5) + Prc (1,2)
where:
S is slope, H is height or altitude, A is aspect, QA is
fault line, MA is distance from ravine areas, WS is wind
speed, SO is soil components, SW is distance from sub-
terranean water resources, NI is distance from industrial
sites and HP is historical landmark, HBU is Distance
from urban habitat and HBR is distance from rural habi-
tat and Lo, Ma(R-year) is the maximum precipitation
based on geographical location. For purposes of the lin-
ear models, the terms used have the following definitions:
“Slope” (S) includes six classes: 0 to 2% (class 1), 2 to
5% (class 2), 5 to 8% (class 3), 8 to 12% (class 4), 12 to
15% (class 5), and more than 15% (class 6). “Height” (H)
includes six altitude classes: less than 1000 meters (class
1), 1000 - 1200 meters (class 2), 1200 - 1400 meters
(class 3), 1400 - 1600 meters (class 4), 1600 - 1800 me-
ters (class 5), and more than 1800 meters (class 6). “Dis-
tance from ravine areas” (MA) includes four classes: less
than 50 meters (class 1), 50 - 300 meters (class 2), 300 -
500 meters (class 3), and more than 500 meters (class 4).
“Subterranean water resources” (SW) divides resources
into four classes, based on distance to the water resource:
less than 100 meter s ( class 1) , 100 - 50 0 meters (class 2),
500 - 1000 meters (class 3), an d more th an one k ilometer
(class 4). “Distance from industrial sites” (NI) includes
three classes: less than 5 kilometers (class 1), 5 - 10
kilometers (class 2), and 10 - 20 kilometers (class 3).
“Distance from Urban Habitat” (HBU) divides 4 four
classes: less than 5 kilometers (class 1), between 5 to 10
kilometers ( class 2), between 10 - 20 kilometers (class 3)
and more than 20 kilometers (class 4), “Historical land-
mark” (HP) divides historical places into four classes,
based on how far away they are located: less than 5
kilometers (class 1), 5 - 10 kilometers (class 2), 10 - 20
kilometers (class 3), and more than 20 kilometers (class
4), Distance from rural habitat "HBR" divides rural area
and around th is to 4 classes: less than 2 kilometers (class
1), 2 - 4 kilometers (class 2), 4 - 8 kilometers (class 3)
and more than 8 kilometers class 4 and Prc is precipita-
tion in mm in 7 classes more than 2000, 1800 - 2000,
1200 - 1800, 800 - 1200, 500 - 800, 200 - 500, 50 - 200
and less than 200 mm and So is soil construction in 11
classes and Sd is soil depth in 5 classes include more
than 180, 120 - 180, 60 - 120, 30 - 60, less
than 30 cm.
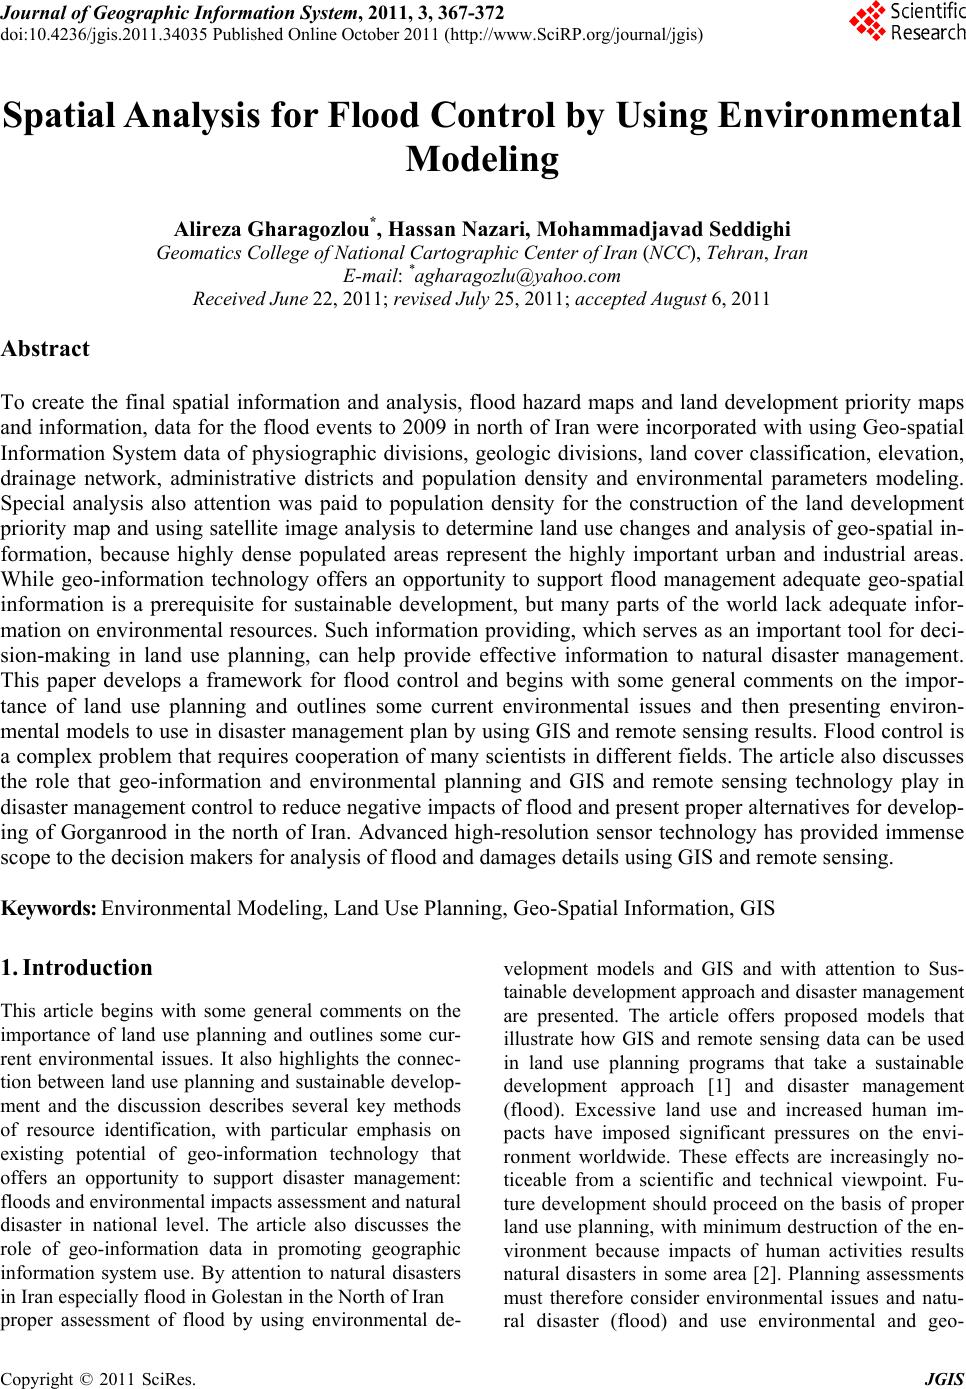
With attention to linear model of flood control and
data analysis and using GIS the result of analysis are as
maps presented that are presented in Figures 1-4.
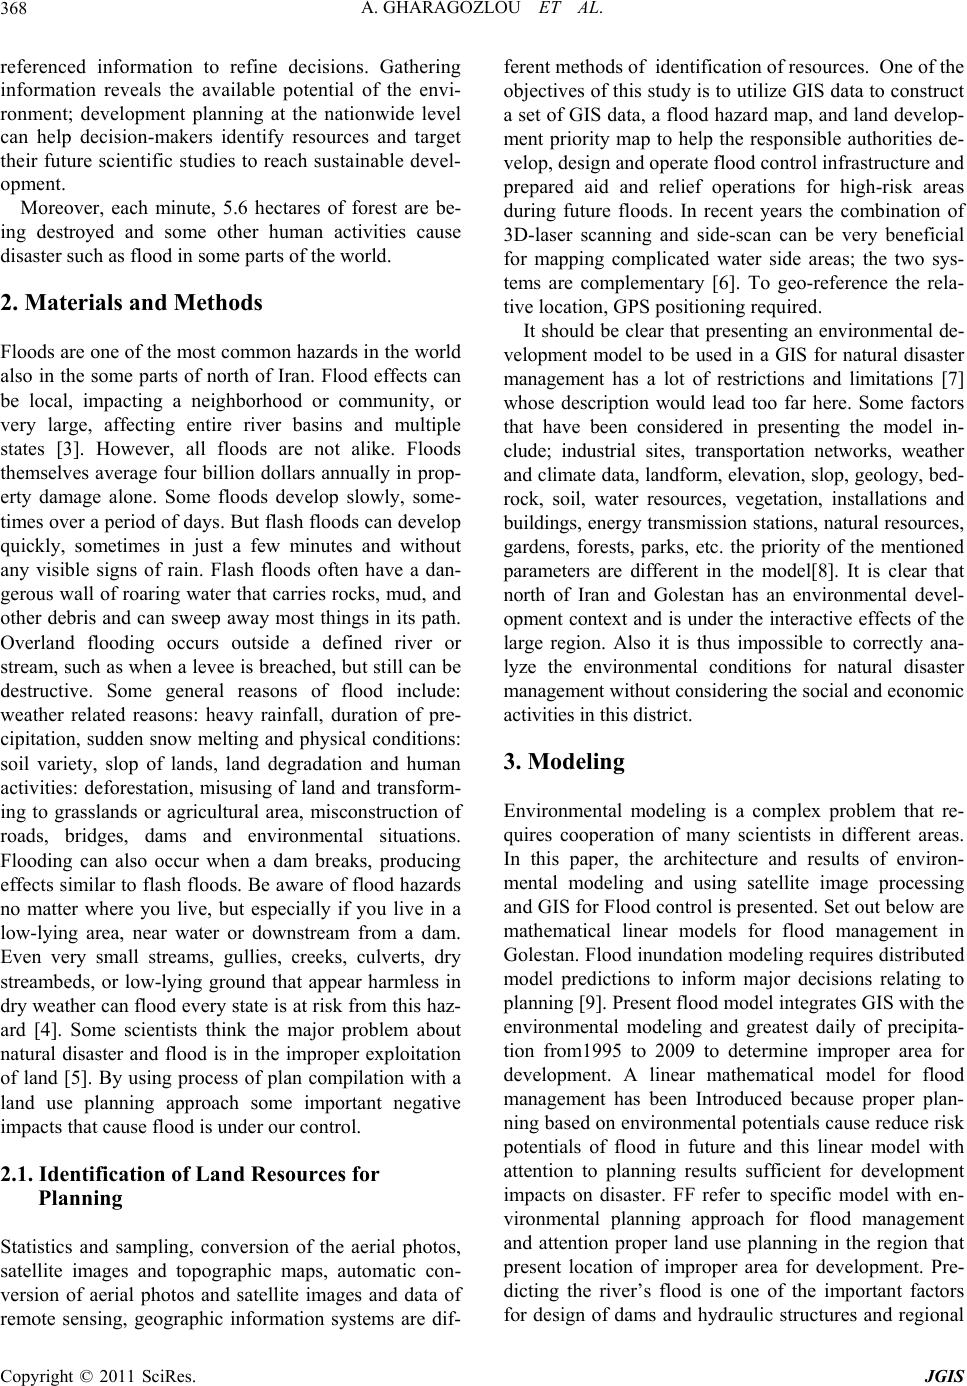
Satellite data also can be effectively u sed for mapping
and monitoring the flood inundated areas, flood damage
assessment, flood hazard zoning and post-flood survey of
rivers configuration and protection works. Analyzing the
satellite images reveal a noticeable reduction of forest-
lands in north of Iran due to the expansion of the urban
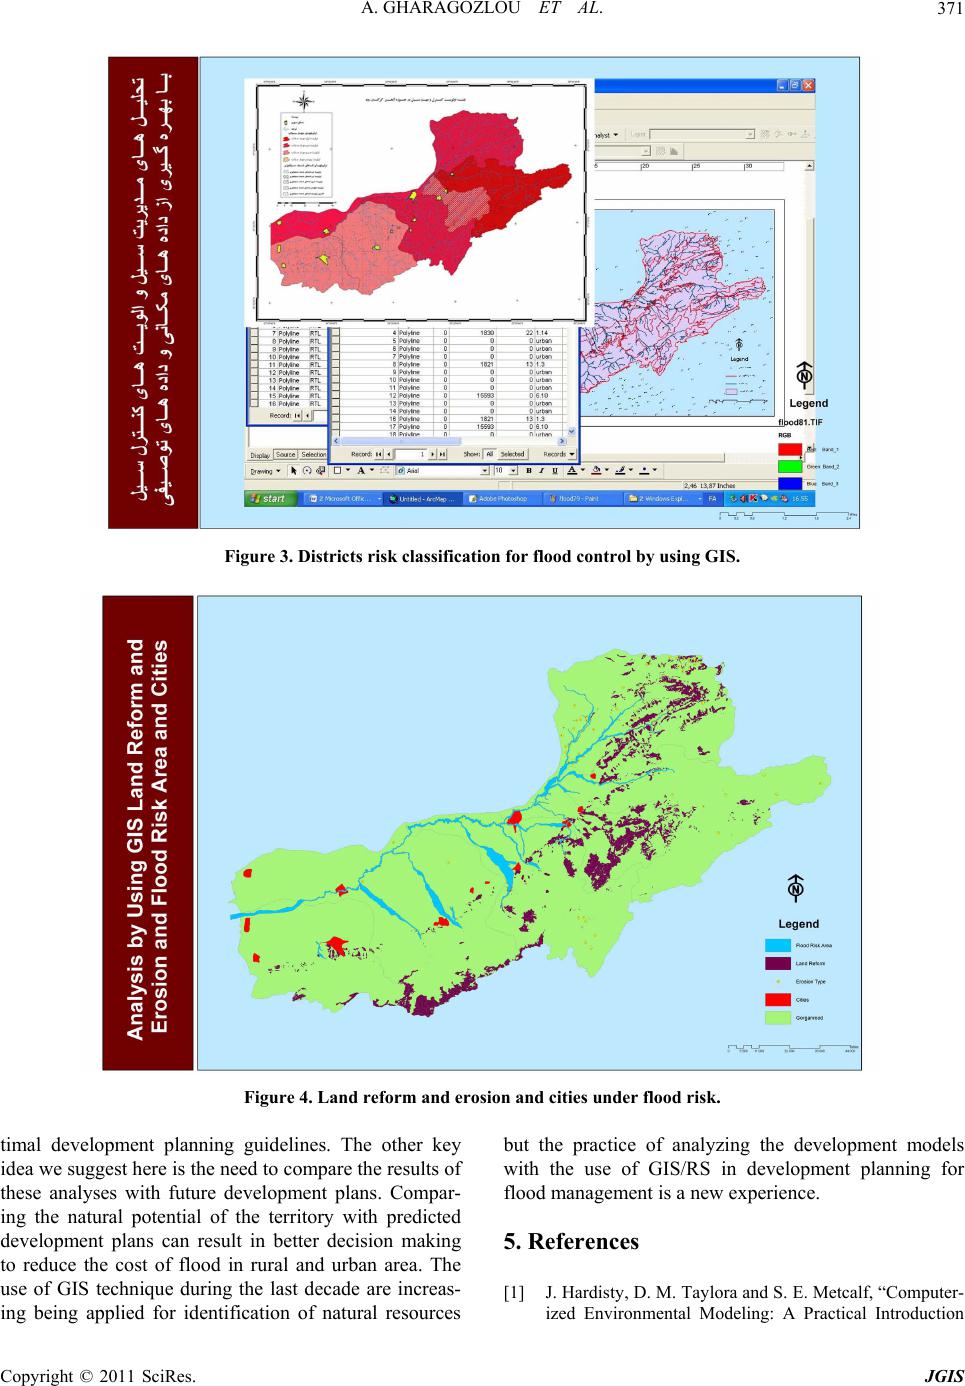
limits misuse from these area. The other fixed natural
resources of the region too have been overused resulting
in environmental destruction of the area. The amount of
residential areas during 1995 and 2009 show an 8%
growth while there is no increase in the number of for-
estlands. There are several definitio ns of sustainability in
the urban forestry sector that we attention in this paper
based on analysis results and conditions in urban area.
The amount of forestlands declined about 1 hectare every
year and open areas have been reduced thus leading to
the conclusion that most of the construction activity too k
place in forestlands and results suiting with other ex-
periences in this filed.
4. Conclusions
In this paper Innovations in the filed of environmental
modeling which are based on natural disaster manage-
ment for flood in Iran and using proper models for analy-
sis in GIS are presented.
Geo-information technology offers an opportunity to
support disaster management and floods as the natural
disaster management. Gorganrood rivers waterways trails
as a pedestrian pass with a stream of spring and rain
which also can hold heavy rain water as a flood control
waterway. One of the obvious and prominent aspectsof
innovations in this paper, are the models that can inte-
grate between Geo-information technology and environ-
mental modeling and natural disaster management.
Analysis positioning of improper locations by using
A. GHARAGOZLOU ET AL.
370
GIS/RS technology for development area determination
based on the environmental capacities with a flood con-
trol approach.
At the same time, by using GIS necessary analysis to
find flood risk in the region and impacts of flood on
natural and human facilities are presented. Choosing
proper linear models based on environmental capacity
with a flood management emphasize determining the
ecological potentials of the area and using GIS is the
important point of this paper. The joint application of
GIS and environmental modeling and using remote
sensing technology can help land use planners apply op-
Figure 1. Spatial Analysis for determination flood risk area and improper area for development using flood modeling in
north of Iran.
Figure 2. Satellite image processing (ETM+) in Golestan, Gorganrood, and risk assessment and modeling for flood control.
Copyright © 2011 SciRes. JGIS
A. GHARAGOZLOU ET AL.371
Figure 3. Districts risk classification for flood control by using GIS.
Figure 4. Land reform and erosion and cities under flood risk.
timal development planning guidelines. The other key
idea we suggest here is the need to compare the results of
these analyses with future development plans. Compar-
ing the natural potential of the territory with predicted
development plans can result in better decision making
to reduce the cost of flood in rural and urban area. The
use of GIS technique during the last decade are increas-
ing being applied for identification of natural resources
but the practice of analyzing the development models
with the use of GIS/RS in development planning for
lood management is a new experience. f
5. References
[1] J. Hardisty, D. M. Taylora and S. E. Metcalf, “Computer-
ized Environmental Modeling: A Practical Introduction
Copyright © 2011 SciRes. JGIS
A. GHARAGOZLOU ET AL.
372
Using Excel,” Wiley, New York, 1993, pp. 80-88.
[2] A. Gharagozlou, “Crisis Management (Flood) and GIS,”
Geomatics College of NCC of Iran, Tehran, 2010, pp. 23-
29.
[3] S. Andera, “Geo-Information for Disaster Management,”
GIM International, Amsterdam, 2005, pp. 10-12.
[4] A. Gharagozlou, “Environmental Planning for Natural
Disaster by Using GIS,” International Society for Photo-
grammetry and Remote Sensing, 2007.
[5] E. Wolk and B. Zagajewski, “Remote Sensing of Envi-
ronment Laboratory, Faculty of Geography and Regional
Studies,” University of Warsaw, Warsaw, 1999, pp. 44-
57.
[6] J. Fairley, “Environmental Planning,” Department of
Environmental Planning, University of Stratchlyde, Stra-
tchlyde, 2001, pp. 111
[7] S. kimitrero, “Flood Hazard Assessment for the Construc-
tionof Flood Hazard Map and Land Development Priority
Map Using NOAA/AVHRR DATA,” GIS Development
Journal, Vol. 4, 2006, pp. 3-12.
[8] Heywood LAN, S, Cornelius and S. Carver, “Cornelius; -
An Introduction to Geographic Information Systems,”
chap., 1998, pp. 2-5.
[9] K. Clayton, “The Land Form Space, Environmental Sci-
ence for Environmental Management,” Longman, Lon-
don, 1990, pp. 198-222.
[10] F. Ferrini, “Sustainable management techniques for trees
in the urban area, Journal of Biodiversity and Ecological
Sciences,” IAU University, Tonekabon, 2010, pp. 1-19.
Appendix
Important information about greatest daily of precipitation in Gorganrood in the north of Iran and monthly precipitation
and days with and without snow according to statistics of metrological organization of Iran are used for GIS analysis.
Some factors include:
- GREATEST DAILY OF PRECIPITATION IN MM
- MONTHLY TOTAL OF PRECIPITAION IN MM
- NO OF DAYS WITH PRECIPITATION
- NO OF DAYS WITH PRECIPITATION EQUAL TO OR GREATER THAN 1 MM
- NO OF DAYS WITH PRECIPITATION EQUAL TO OR GREATER THAN 5 MM
- NO OF DAYS WITH PRECIPITATION EQUAL TO OR GREATER THAN 10 MM
- NO OF DAYS WITH SNOW OR SLEET
VISIBILITY WIND CLOUDY SUNSHINE DEGREE DAYS TEMPERATURE HUMIDITY PRESSURE PRECIPI-
TATION
- HOUR MAXIMUM PRECIPI TA TION
- MONTHLY TOTAL PRECIPITAION WITH SEASONAL PERCENT
- NO OF DAYS WITH PRECIPITATION
- NO OF DAYS PRECIPITATION EQUAL OR MORE TH AN 1 MM
- NO OF DAYS PRECIPITATION EQUAL OR MORE TH AN 5 MM
Copyright © 2011 SciRes. JGIS