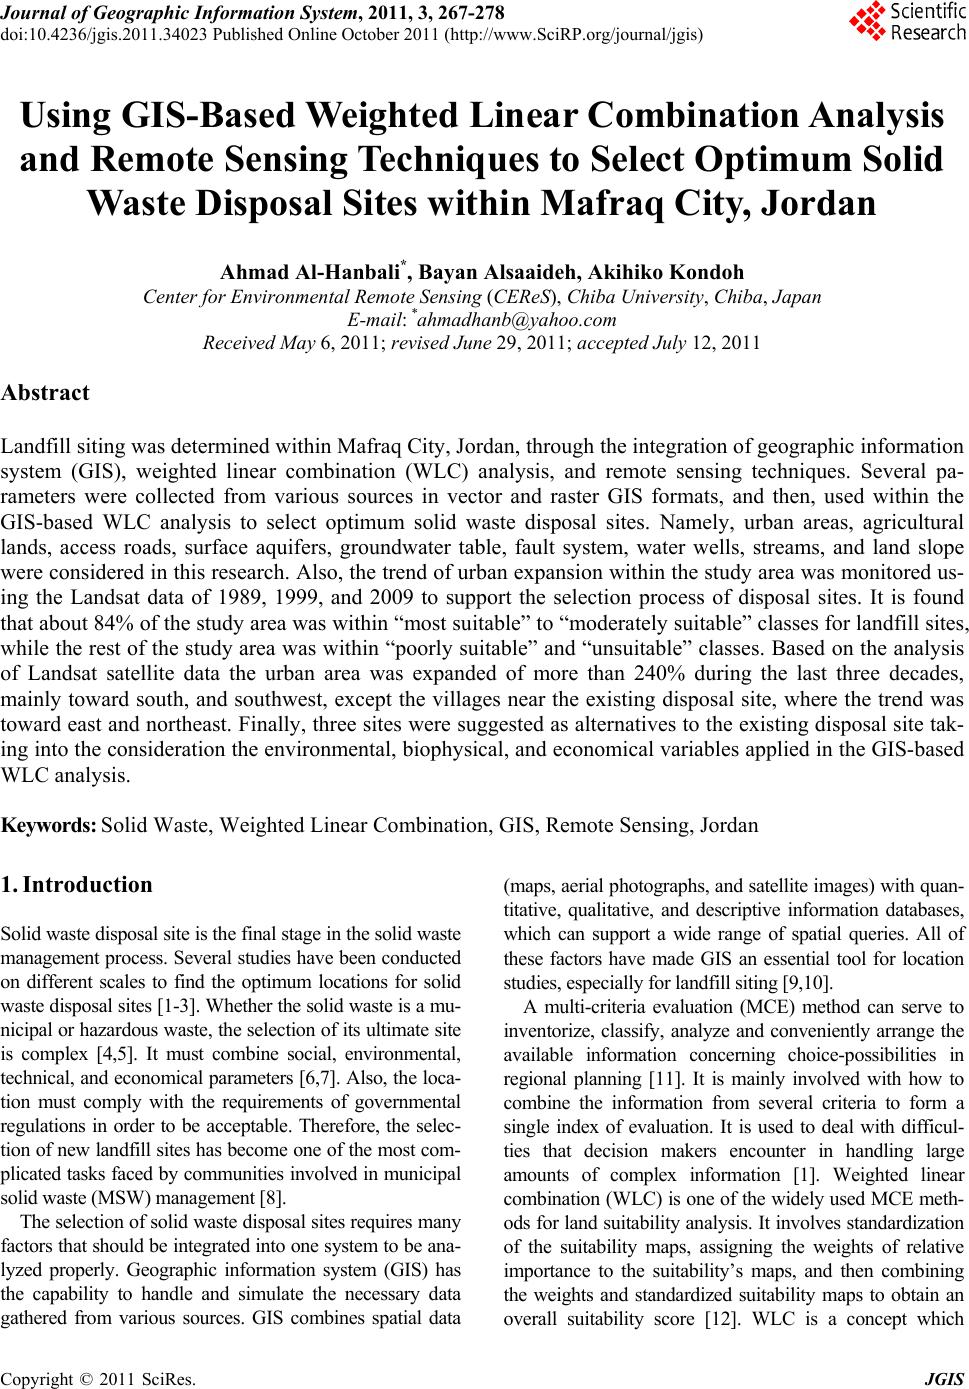
 Journal of Geographic Information System, 2011, 3, 267-278 doi:10.4236/jgis.2011.34023 Published Online October 2011 (http://www.SciRP.org/journal/jgis) Copyright © 2011 SciRes. JGIS Using GIS-Based Weighted Linear Combination Analysis and Remote Sensing Techniques to Select Optimum Solid Waste Disposal Sites within Mafraq City, Jordan Ahmad Al-Hanbali*, Bayan Alsaaideh, Akihiko Kondoh Center for Environmen tal Remote Sensing (CEReS), Chiba University, Chiba, Japan E-mail: *ahmadhanb@yahoo.com Received May 6, 2011; revised June 29, 2011; ac cepted July 12, 2011 Abstract Landfill siting was determined within Mafraq City, Jordan, through the integration of geographic information system (GIS), weighted linear combination (WLC) analysis, and remote sensing techniques. Several pa- rameters were collected from various sources in vector and raster GIS formats, and then, used within the GIS-based WLC analysis to select optimum solid waste disposal sites. Namely, urban areas, agricultural lands, access roads, surface aquifers, groundwater table, fault system, water wells, streams, and land slope were considered in this research. Also, the trend of urban expansion within the study area was monitored us- ing the Landsat data of 1989, 1999, and 2009 to support the selection process of disposal sites. It is found that about 84% of the study area was within “most suitable” to “moderately suitable” classes for landfill sites, while the rest of the study area was within “poorly suitable” and “unsuitable” classes. Based on the analysis of Landsat satellite data the urban area was expanded of more than 240% during the last three decades, mainly toward south, and southwest, except the villages near the existing disposal site, where the trend was toward east and northeast. Finally, three sites were suggested as alternatives to the existing disposal site tak- ing into the consideration the environmental, biophysical, and economical variables applied in the GIS-based WLC analysis. Keywords: Solid Waste, Weighted Linear Combination, GIS, Remote Sensing, Jordan 1. Introduction Solid waste disposal site is the final stage in the solid waste management process. Several studies have been conducted on different scales to find the optimum locations for solid waste disposal sites [1-3]. Whether the solid waste is a mu- nicipal or hazardous waste, the selection of its ultimate site is complex [4,5]. It must combine social, environmental, technical, and economical parameters [6,7]. Also, the loca- tion must comply with the requirements of governmental regulations in order to be acceptable. Therefore, the selec- tion of new landfill sites has become one of the most com- plicated tasks faced by communities involved in municipal solid waste (MSW) management [8]. The selection of solid waste disposal sites requires many factors that should be integrated into one system to be ana- lyzed properly. Geographic information system (GIS) has the capability to handle and simulate the necessary data gathered from various sources. GIS combines spatial data (maps, aerial photographs, and satellite images) with quan- titative, qualitative, and descriptive information databases, which can support a wide range of spatial queries. All of these factors have made GIS an essential tool for location studies, especially for landfill siting [9,10]. A multi-criteria evaluation (MCE) method can serve to inventorize, classify, analyze and conveniently arrange the available information concerning choice-possibilities in regional planning [11]. It is mainly involved with how to combine the information from several criteria to form a single index of evaluation. It is used to deal with difficul- ties that decision makers encounter in handling large amounts of complex information [1]. Weighted linear combination (WLC) is one of the widely used MCE meth- ods for land suitability analysis. It involves standardization of the suitability maps, assigning the weights of relative importance to the suitability’s maps, and then combining the weights and standardized suitability maps to obtain an overall suitability score [12]. WLC is a concept which 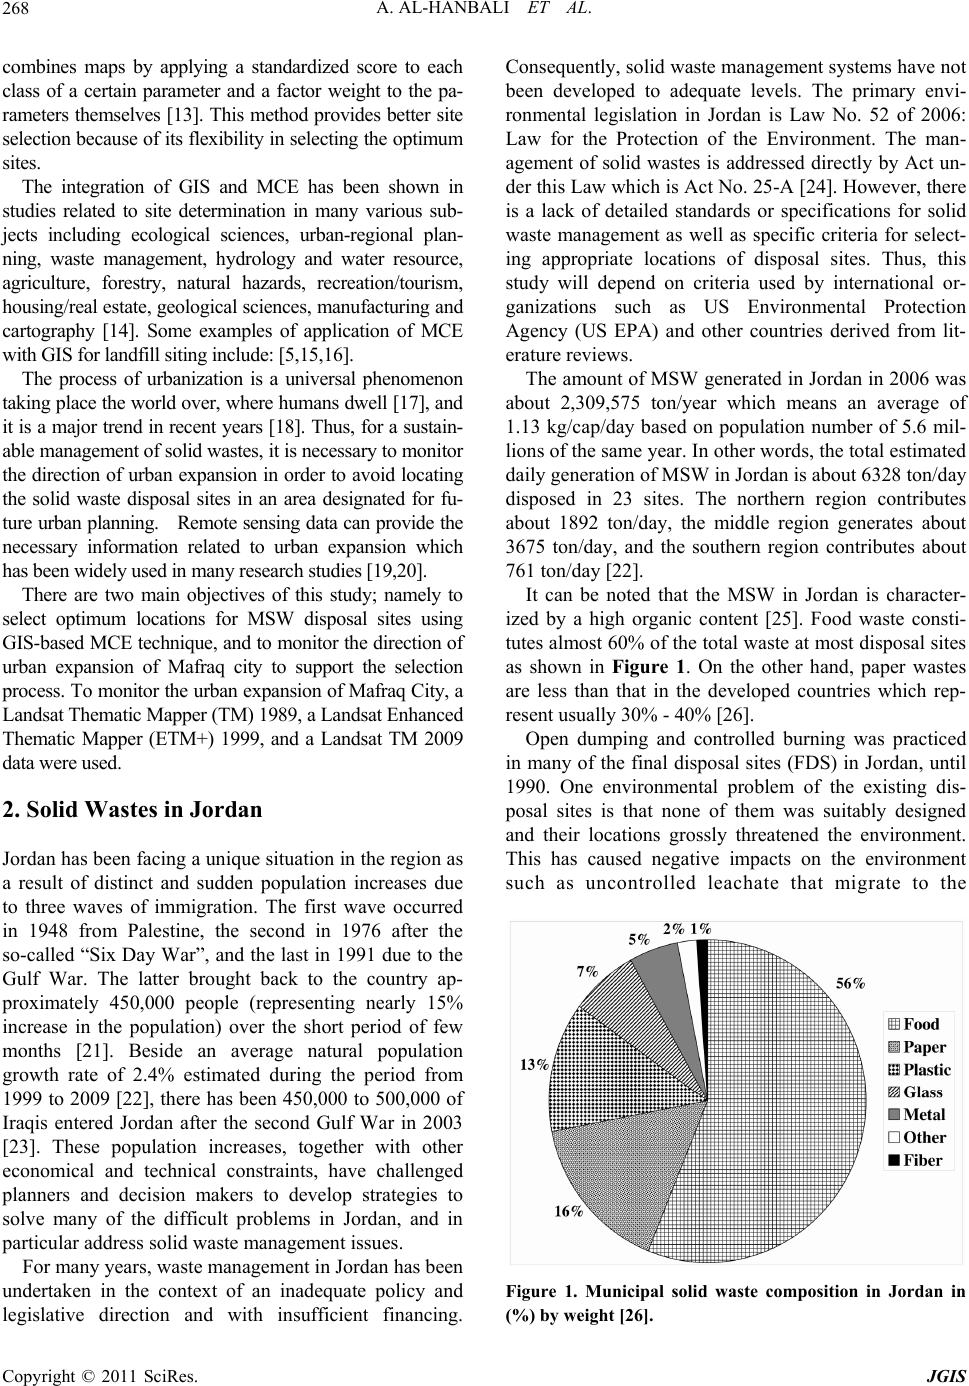 A. AL-HANBALI ET AL. 268 combines maps by applying a standardized score to each class of a certain parameter and a factor weight to the pa- rameters themselves [13]. This method provides better site selection because of its flexibility in selecting the optimum sites. The integration of GIS and MCE has been shown in studies related to site determination in many various sub- jects including ecological sciences, urban-regional plan- ning, waste management, hydrology and water resource, agriculture, forestry, natural hazards, recreation/tourism, housing/real estate, geological sciences, manufacturing and cartography [14]. Some examples of application of MCE with GIS for landfill siting include: [5,15,16]. The process of urbanization is a universal phenomenon taking place the world over, where humans dwell [17], and it is a major trend in recent years [18]. Thus, for a sustain- able management of solid wastes, it is necessary to monitor the direction of urban expansion in order to avoid locating the solid waste disposal sites in an area designated for fu- ture urban planning. Remote sensing data can provide the necessary information related to urban expansion which has been widely used in many research studies [19,20]. There are two main objectives of this study; namely to select optimum locations for MSW disposal sites using GIS-based MCE technique, and to monitor the direction of urban expansion of Mafraq city to support the selection process. To monitor the urban expansion of Mafraq City, a Landsat Thematic Mapper (TM) 1989, a Landsat Enhanced Thematic Mapper (ETM+) 1999, and a Landsat TM 2009 data were used. 2. Solid Wastes in Jordan Jordan has been facing a unique situation in the region as a result of distinct and sudden population increases due to three waves of immigration. The first wave occurred in 1948 from Palestine, the second in 1976 after the so-called “Six Day War”, and the last in 1991 due to the Gulf War. The latter brought back to the country ap- proximately 450,000 people (representing nearly 15% increase in the population) over the short period of few months [21]. Beside an average natural population growth rate of 2.4% estimated during the period from 1999 to 2009 [22], there has been 450,000 to 500,000 of Iraqis entered Jordan after the second Gulf War in 2003 [23]. These population increases, together with other economical and technical constraints, have challenged planners and decision makers to develop strategies to solve many of the difficult problems in Jordan, and in particular address solid waste management issues. For many years, waste management in Jordan has been undertaken in the context of an inadequate policy and legislative direction and with insufficient financing. Consequently, solid waste management systems have not been developed to adequate levels. The primary envi- ronmental legislation in Jordan is Law No. 52 of 2006: Law for the Protection of the Environment. The man- agement of solid wastes is addressed directly by Act un- der this Law which is Act No. 25-A [24]. However, there is a lack of detailed standards or specifications for solid waste management as well as specific criteria for select- ing appropriate locations of disposal sites. Thus, this study will depend on criteria used by international or- ganizations such as US Environmental Protection Agency (US EPA) and other countries derived from lit- erature reviews. The amount of MSW generated in Jordan in 2006 was about 2,309,575 ton/year which means an average of 1.13 kg/cap/day based on population number of 5.6 mil- lions of the same year. In other words, the total estimated daily generation of MSW in Jordan is about 6328 ton/day disposed in 23 sites. The northern region contributes about 1892 ton/day, the middle region generates about 3675 ton/day, and the southern region contributes about 761 ton/day [22]. It can be noted that the MSW in Jordan is character- ized by a high organic content [25]. Food waste consti- tutes almost 60% of the total waste at most disposal sites as shown in Figure 1. On the other hand, paper wastes are less than that in the developed countries which rep- resent usually 30% - 40% [26]. Open dumping and controlled burning was practiced in many of the final disposal sites (FDS) in Jordan, until 1990. One environmental problem of the existing dis- posal sites is that none of them was suitably designed and their locations grossly threatened the environment. This has caused negative impacts on the environment such as uncontrolled leachate that migrate to the Figure 1. Municipal solid waste composition in Jordan in (%) by weight [26]. Copyright © 2011 SciRes. JGIS 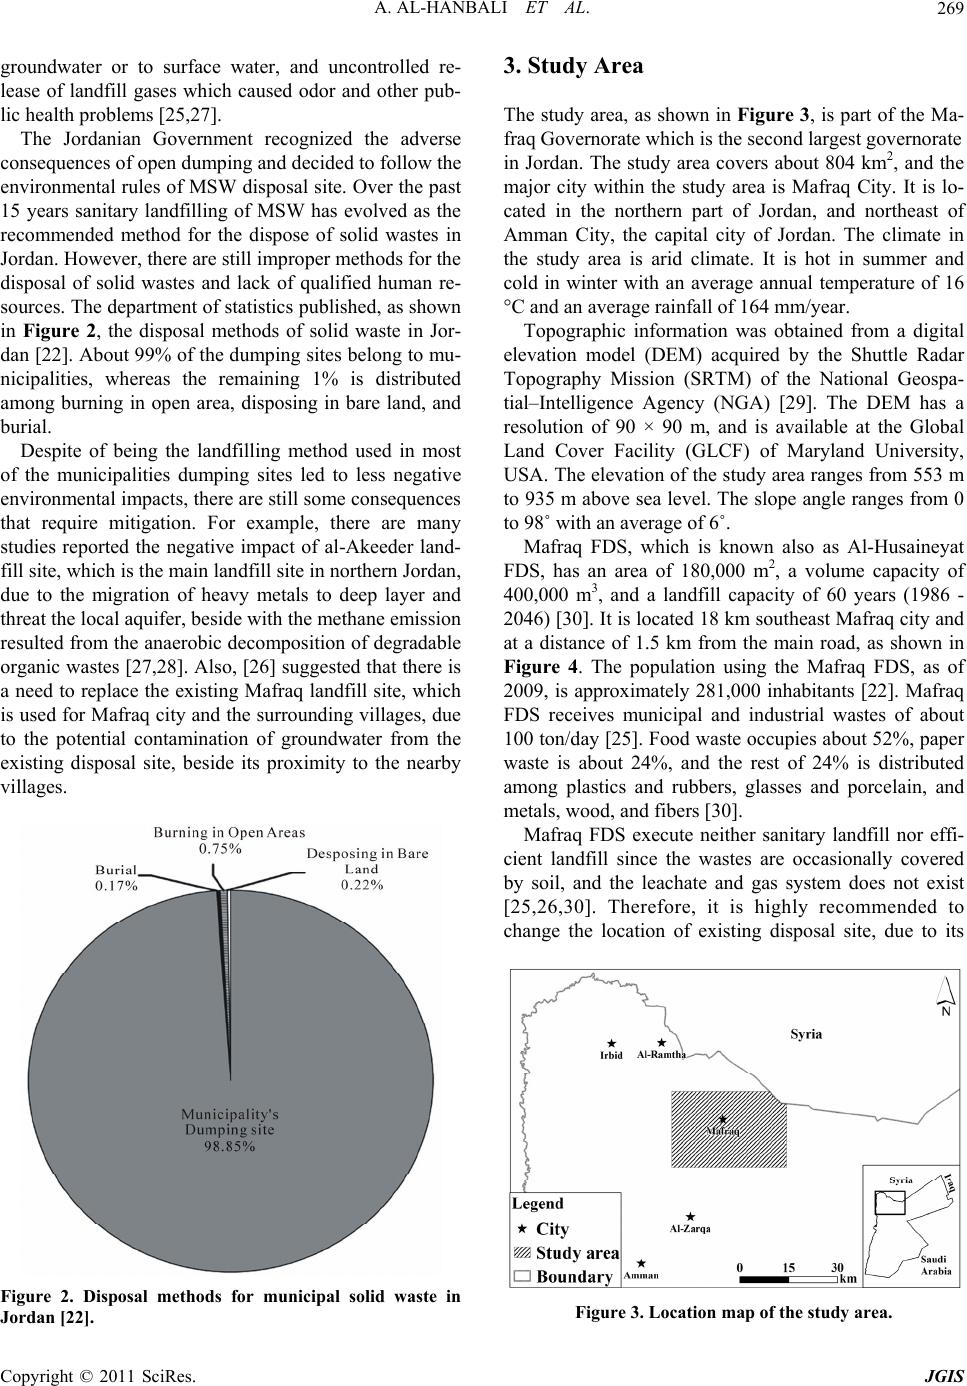 A. AL-HANBALI ET AL.269 groundwater or to surface water, and uncontrolled re- lease of landfill gases which caused odor and other pub- lic health problems [25,27]. The Jordanian Government recognized the adverse consequences of open dumping and decided to follow the environmental rules of MSW disposal site. Over the past 15 years sanitary landfilling of MSW has evolved as the recommended method for the dispose of solid wastes in Jordan. However, there are still improper methods for the disposal of solid wastes and lack of qualified human re- sources. The department of statistics published, as shown in Figure 2, the disposal methods of solid waste in Jor- dan [22]. About 99% of the dumping sites belong to mu- nicipalities, whereas the remaining 1% is distributed among burning in open area, disposing in bare land, and burial. Despite of being the landfilling method used in most of the municipalities dumping sites led to less negative environmental impacts, there are still some consequences that require mitigation. For example, there are many studies reported the negative impact of al-Akeeder land- fill site, which is the main landfill site in northern Jordan, due to the migration of heavy metals to deep layer and threat the local aquifer, beside with the methane emission resulted from the anaerobic decomposition of degradable organic wastes [27,28]. Also, [26] suggested that there is a need to replace the existing Mafraq landfill site, which is used for Mafraq city and the surrounding villages, due to the potential contamination of groundwater from the existing disposal site, beside its proximity to the nearby villages. Figure 2. Disposal methods for municipal solid waste in Jordan [22]. 3. Study Area The study area, as shown in Figure 3, is part of the Ma- fraq Governorate which is the second largest governorate in Jordan. The study area covers about 804 km2, and the major city within the study area is Mafraq City. It is lo- cated in the northern part of Jordan, and northeast of Amman City, the capital city of Jordan. The climate in the study area is arid climate. It is hot in summer and cold in winter with an average annual temperature of 16 °C and an average rainfall of 164 mm/year. Topographic information was obtained from a digital elevation model (DEM) acquired by the Shuttle Radar Topography Mission (SRTM) of the National Geospa- tial–Intelligence Agency (NGA) [29]. The DEM has a resolution of 90 × 90 m, and is available at the Global Land Cover Facility (GLCF) of Maryland University, USA. The elevation of the study area ranges from 553 m to 935 m above sea level. The slope angle ranges from 0 to 98˚ with an average of 6˚. Mafraq FDS, which is known also as Al-Husaineyat FDS, has an area of 180,000 m2, a volume capacity of 400,000 m3, and a landfill capacity of 60 years (1986 - 2046) [30]. It is located 18 km southeast Mafraq city and at a distance of 1.5 km from the main road, as shown in Figure 4. The population using the Mafraq FDS, as of 2009, is approximately 281,000 inhabitants [22]. Mafraq FDS receives municipal and industrial wastes of about 100 ton/day [25]. Food waste occupies about 52%, paper waste is about 24%, and the rest of 24% is distributed among plastics and rubbers, glasses and porcelain, and metals, wood, and fibers [30]. Mafraq FDS execute neither sanitary landfill nor effi- cient landfill since the wastes are occasionally covered by soil, and the leachate and gas system does not exist [25,26,30]. Therefore, it is highly recommended to change the location of existing disposal site, due to its Figure 3. Location map of the study area. Copyright © 2011 SciRes. JGIS 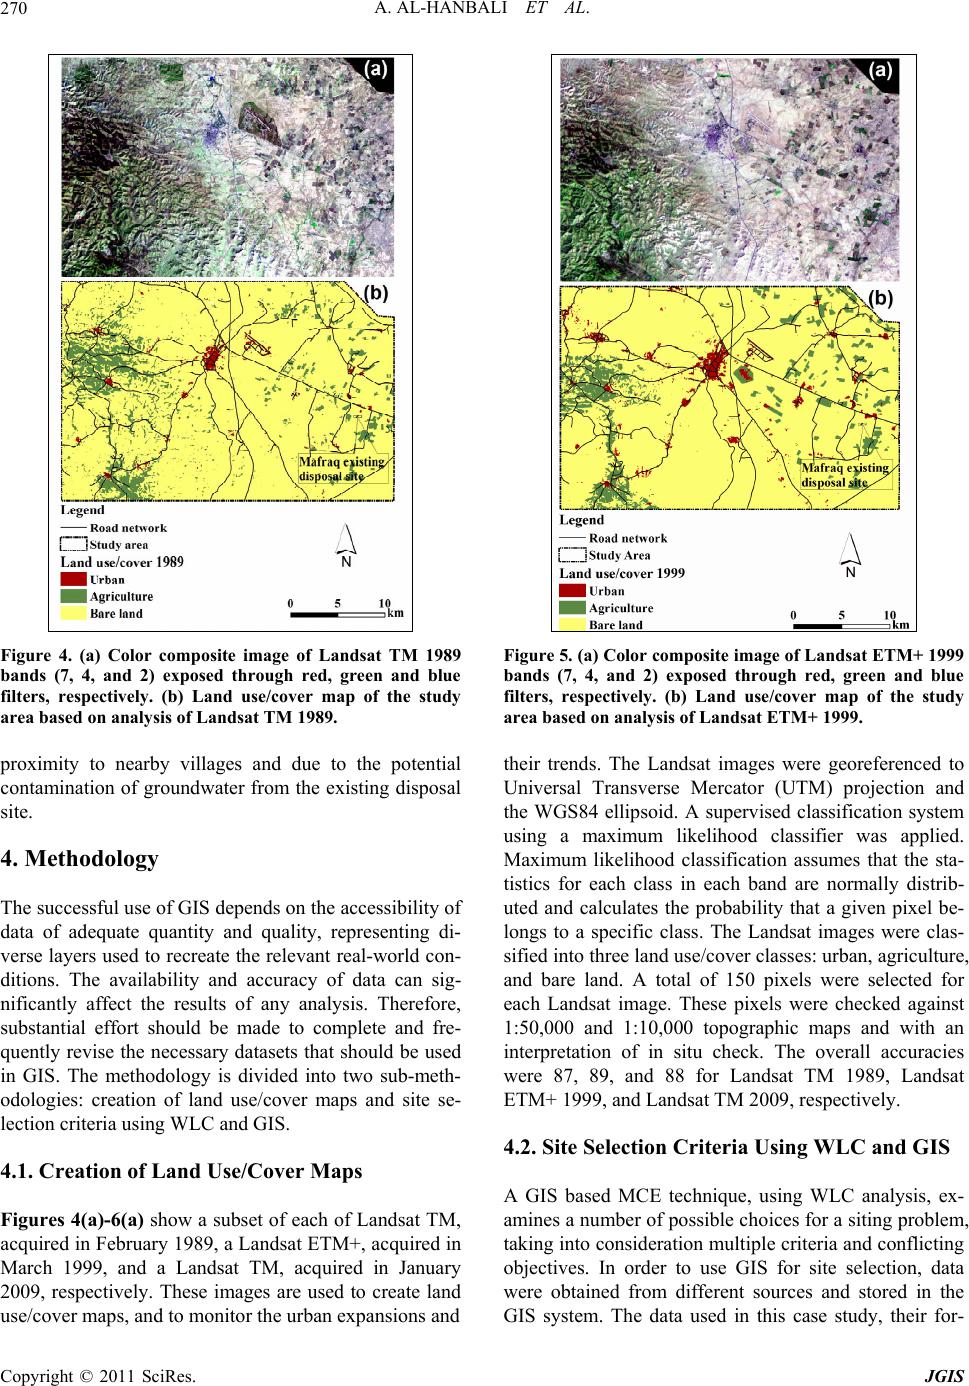 A. AL-HANBALI ET AL. 270 Figure 4. (a) Color composite image of Landsat TM 1989 bands (7, 4, and 2) exposed through red, green and blue filters, respectively. (b) Land use/cover map of the study area based on analysis of Landsat TM 1989. proximity to nearby villages and due to the potential contamination of groundwater from the existing disposal site. 4. Methodology The successful use of GIS depends on the accessibility of data of adequate quantity and quality, representing di- verse layers used to recreate the relevant real-world con- ditions. The availability and accuracy of data can sig- nificantly affect the results of any analysis. Therefore, substantial effort should be made to complete and fre- quently revise the necessary datasets that should be used in GIS. The methodology is divided into two sub-meth- odologies: creation of land use/cover maps and site se- lection criteria using WLC and GIS. 4.1. Creation of Land Use/Cover Maps Figures 4(a)-6(a) show a subset of each of Landsat TM, acquired in February 1989, a Landsat ETM+, acquired in March 1999, and a Landsat TM, acquired in January 2009, respectively. These images are used to create land use/cover maps, and to monitor the urban expansions and Figure 5. (a) Color composite image of Landsat ETM+ 1999 bands (7, 4, and 2) exposed through red, green and blue filters, respectively. (b) Land use/cover map of the study area based on analysis of Landsat ETM+ 1999. their trends. The Landsat images were georeferenced to Universal Transverse Mercator (UTM) projection and the WGS84 ellipsoid. A supervised classification system using a maximum likelihood classifier was applied. Maximum likelihood classification assumes that the sta- tistics for each class in each band are normally distrib- uted and calculates the probability that a given pixel be- longs to a specific class. The Landsat images were clas- sified into three land use/cover classes: urban, agriculture, and bare land. A total of 150 pixels were selected for each Landsat image. These pixels were checked against 1:50,000 and 1:10,000 topographic maps and with an interpretation of in situ check. The overall accuracies were 87, 89, and 88 for Landsat TM 1989, Landsat ETM+ 1999, and Landsat TM 2009, respectively. 4.2. Site Selection Criteria Using WLC and GIS A GIS based MCE technique, using WLC analysis, ex- amines a number of possible choices for a siting problem, taking into consideration multiple criteria and conflicting objectives. In order to use GIS for site selection, data were obtained from different sources and stored in the GIS system. The data used in this case study, their for- Copyright © 2011 SciRes. JGIS  A. AL-HANBALI ET AL. Copyright © 2011 SciRes. JGIS 271 software uses a weighted sum analysis that is act as a WLC analysis. A weighted sum analysis provides the ability to weight and combine multiple inputs to create an integrated analysis. In other words, it combines multi- ple raster inputs, representing multiple factors, of differ- ent weights or relative importance. It is one of common methodologies used for site selection in general, and for selecting solid waste disposal sites in particular. In this study, the method of [7] was used for site selec- tion criteria, with some variations in the selected pa- rameters based on the local conditions of the study area. This method can provide the decision makers several options for selecting appropriate locations of landfill sites, since using this method, the final output map will range from the “most suitable” to “not suitable”. All the attributes of input data were given scores. The scores represent land constraints for siting a landfill that range from 0 to 10. A score of 0 indicates no constraint, and a score of 10 indicates a total constraint. Weights were generally assigned to these maps to express the relative importance. The total weight should be added up to 100% in order for the output map to be meaningful and consistent, and the attribute scores must be chosen using a scheme that was the same for each map. In this study, the maps of input data were not given equal im- portance, since some factors were more important than others when selecting suitable landfill sites. Moreover, the importance of each factor could vary from one study area to another depending on the local condition of each Figure 6. (a) Color composite image of Landsat ETM+ 2009 bands (7, 4, and 2) exposed through red, green and blue filters, respectively. (b) Land use/cover map of the study area based on analysis of Landsat ETM+ 2009. mats, and their sources are available in Table 1. study area. Therefore, the selection of relative impor- tance should be consistent with the local conditions of To apply the WLC analysis practically, ArcGIS soft ware package and its extensions were used. ArcGIS Table 1. The geospatial data used in this study. Factor Description Format Source Urban area Construction material, e.g. asphalt and concrete, typical commercial and industrial buildings, dams, dikes, resi- dential development (including single/multiple houses) Raster Interpretation of Landsat satellite data Agriculture land Agricultural areas such as olive farms, vegetable fields, and annual crop fields, cultivated areas (irrigated and non-irrigated vegetation) Raster Interpretation of Landsat satellite data Road network Any transportation facilities, e.g. highways and local roads Vector, Shapefile Department of Statistics, Jordan Surface aquifer Refers to the saturated zone material properties, which control the groundwater movement Vector, Shapefile Surface aquifer map obtained from ministry of Water and Irrigation, Jordan Depth to water Represents the depth from the ground surface to the water table Vector, Shapefile Well data obtained from Ministry of Water and Irrigation, Jordan Fault system Any planar fracture or discontinuity in a volume of rock, across which there has been significant displacement Vector, Shapefile Interpretation of geological map scale 1:250,000 obtained from Natural Resources Authority, Jordan Well Observation wells available within the study area Vector, Shapefile Well data obtained from Ministry of Water and Irrigation, Jordan Stream network Refers to the Drainage systems occur in the study area Vector, Shapefile Interpretation of Digital elevation model (DEM) of SRTM data available at Global Land Cover Facility (GLCF) of Maryland University Slope Refers to the slope of the land surface Raster Interpretation of Digital elevation model (DEM) of SRTM data available at Global Land Cover Facility (GLCF) of Maryland University  A. AL-HANBALI ET AL. 272 the study area. As mentioned earlier, there are no specific criteria for selecting solid waste disposal sites in Jordan. The criteria used in this study were based on criteria used in U.S EPA [31] and other countries derived from literature review with adjustments to local desired priorities and requirements. Nine suitability criteria: distance from ur- ban areas, distance from agricultural lands, distance from roads, aquifer media, depth to water table, distance from faults, distance from wells, distance from streams, and slope, were used in this study. Each criterion was reclas- sified, and then given ranking, to comply with a specific scheme. Then, a final composite map was produced us- ing WLC. The weights and scores were assigned after several discussions with the local experts, and decision makers, in addition to the previous knowledge of the study area. As a general rule, it was decided to give higher weightings to factors that affect directly on the community such as distance from urban areas, distance from agricultural lands, and distance to wells, whereas the other factors, which have lower effects on the com- munity or can be adjusted by engineering processes, were assigned lower weightings. The Layers, the criteria used, their scores, and their weights are summarized in Table 2. The WLC analysis was applied using the following equation: iiSwx (1) where S is the suitability, wi is a weighting of factor i, and xi is the criterion score of factor i. 4.2.1. Distance from Urban Areas The urban areas were mapped using the Landsat images of 1989, 1999, and 2009. For the purpose of site selec- Table 2. Attribute scores and weights for the maps used in the landfill site selection. Category Layer Criteria Score Weight <1 km 10 1 - 2 km 1 2 - 3 km 2 3 - 4 km 3 4 - 5 km 4 5 - 6 km 5 6 - 7 km 6 7 - 8 km 7 8 - 9 km 8 9 - 10 km 9 Urban >10 km 10 0.15 <500 m 10 500 - 1 km 5 Land use/cover Agriculture >1 km 0 0.15 <0.2 km 10 0.2 - 1 km 0 1 - 2 km 1 2 - 3 km 2 3 - 4 km 3 4 - 5 km 4 5 - 6 km 5 6 - 7 km 6 7 - 8 km 7 8 - 9 km 8 9 - 10 km 9 Access Road >10 km 10 0.1 Major Aquifer (B2/A7) 10 Minor Aquifer (Basalt) 5 Surface Aquifer Non-Aquifer (A1-A6 and B3)0 0.1 <50 m 10 Depth to water table >50 m 0 0.05 <100 m 10 Fault >100 m 0 0.1 <300 m 10 300 - 500 m 5 Hydrogeology Well >500 m 0 0.15 <500 m 10 500 - 1 km 5 Surface water Stream >1 km 0 0.1 >20 % 10 10 - 20 % 5 Topography Slope <10 % 0 0.1 C opyright © 2011 SciRes. JGIS  A. AL-HANBALI ET AL. 273 tion criteria, the urban areas of 2009, as shown in Figure 6b, were used as initial point for future planning to select the optimum landfill sites. As mentioned in many litera- ture reviews such as [32,33], the landfill site should not be located very close to urban area. It should be situated at a significant distance away from urban areas due to public concerns, for example aesthetic, odor, noise, and health concerns. Using spatial analysis, buffer zones of 1,000 m distance were created around urban areas. [7] suggested that the landfill site must be located within 10 km of an urban area. Therefore, a score of 10 was given to distances less than 1,000 m and more than 10 km of an urban area. Other score values were given to distances mentioned in Table 2. High weight of 0.15 was assigned to this factor, because it affects directly on the commu- nity, which should be given a priority in the planning for selecting landfill site. 4.2.2. Distance from Agricu ltural Land s It is very important to determine the locations of agri- cultural lands to avoid placing the landfill sites within these lands. Also, placing the landfill sites very close to agricultural lands is not recommended, due to the nega- tive effects of odor and insects on the farmers and crops, which consequently may affect on the agricultural activi- ties. The agricultural lands were mapped using the Landsat images of 1989, 1999, and 2009. As the case of urban areas, the agricultural lands of 2009, as illustrated in Figure 6(b), were used as initial point for future plan- ning to select the optimum landfill sites. A buffer of 500 m distance was created around agricultural land using GIS spatial analysis, and then a score value of 10 was given to a distance of less than 500 m, and a score value of 0 of more than 1000 m. Also, a weighting of 0.15 was given to this factor, because it has a direct effect on the community, which is very important when planning for a landfill site. 4.2.3. Di stance from Roads There is no specific rule of what should be the best dis- tance to place the landfill site. Most studies suggested that the landfill site should be located within a 1 km buffer from the roads [7,33,34]. However, planners may prefer to give an aesthetic concern when deciding a loca- tion of a landfill site. Also, the landfill sites should not be placed too far from the roads to decrease the cost of transportations. The road network in the study area was obtained from the Jordanian Department of Statistics in GIS vector format. Using GIS spatial analysis, a buffer was created around road network at distances mentioned in Table 2. Considering the huge cost of transportation, it was decided to give a score of 0 to the a distance ranges from 200 m to 1000 m, while distances of less than 200 m and more than 10 km were given a score of 10, as shown in Table 2. A weighting value of 0.1 was assigned to this factor, since this factor can be adjusted by planners and engineers based on the project condi- tions. 4.2.4. Su rface Aquifers The water resources in Jordan are in very critical situa- tion [35]. Therefore, it is very important to give the sur- face aquifers more attention when selecting suitable landfill sites. The surface aquifer map, as shown in Fig- ure 7(a), was provided by the Jordanian Ministry of Water and Irrigation in GIS vector format. The vector file was converted to grid format for further analysis us- ing WLC. In the study area, the main aquifer is called the Amman-Wadi Sir aquifer system (B2/A7). The B2/A7 aquifer behaves as a phreatic aquifer, where precipitation enters directly through the fractured outcrops of the Amman-Wadi Sir Formations. Consequently, this aquifer was a given a score of 10, to avoid locating the landfill sites within its boundary. Another aquifer exists in the study area, which considered as minor aquifer, is the Basalt aquifer. This aquifer was a given a score of 5, since its probability to contaminate the groundwater is not so high compared with the B2/A7 aquifer. The Ajlun Group (A1 - A6) and the Muwaqqar Formation (B3) are considered as aquitards, because of their low permeabil- ity, thus, they were given a score of 0. This factor was given a weighting value of 0.1 because of its importance towards the environment in general and groundwater in particular, beside its effect on the community in the long run. 4.2.5. Depth to Wa ter Tabl e It represents the depth from the ground surface to the water table. The depth to water table, as illustrated in Figure 7(b), was determined using the inverse distance weighting (IDW) interpolation technique of the water level data, which obtained from existing wells in the study area, provided by the Jordanian Ministry of Water and Irrigation. It was found that most of the water-table depths exceeding 50 m within the study area, conse- quently, the depths of ≤50 m were given a score of 10, whereas other depths were given a score of 0. A weight of 0.05 was assigned to this factor, due to the presence of the water table at depths of >50 m in most of the study area. This means the travel time of leachate is very long in order to reach the water table. 4.2.6. Distance from Faults It is safer if the landfill sites can be located away from the fault system. This can prevent the leachate from finding a way to percolate into the groundwater. In this C opyright © 2011 SciRes. JGIS  A. AL-HANBALI ET AL. 274 Figure 7. (a) The surface aquifers within the study area. (b) The depth to water table in meter within the study area. (c) The distance to fault system used in this study . (d) The distance to wells used in this study. (e) The distance to streams used in this study. study, the fault system was extracted from the geologic maps scale 1:250,000 through a digitizing process. Based on [31], the landfill site shall not be located within 60 meters of a fault. To be more careful regarding the dis- tance from the fault system, a buffer of 100 m distance was created around the fault system, as shown in Figure 7(c), and a score value of 10 was given to a distance of 100 m or less, while a score value of 0 was given to dis- tances of >100 m. A weighting value of 0.1 was assigned to this factor because of its influence on the groundwater, which can lead to a negative effect on the community. 4.2.7. Distance to Wells Proximity of a landfill site to a groundwater well is an important environmental criterion in the landfill site se- lection so that wells may be protected from the runoff and leaching of the landfill. There is no specific criterion of what is the best distance to locate the landfill site away from groundwater wells. For example [1] sug- gested that the landfill sites should be located 300 m far from the groundwater wells, while [36] suggested a 500 m away from the groundwater wells. In this study, a dis- tance of ≤300 m from the wells, as shown in Figure 7(d), was assigned a score value of 10, to prevent contamina- tion from landfill leachates, whereas a score value of 0 was assigned to distances of >500 m. This factor was given a weighting of 0.15 to increase its importance of protecting the groundwater from pollution, in addition to its direct influence on the community. 4.2.8. Distance to Streams Solid waste disposal sites must not be located into sur- face water (streams, rivers, lakes, sea). The EU directives stated that a 500 m buffer zone should be maintained around significant water bodies, as illustrated in Figure 7(e) [36]. Most of the surface water in the study area is in the form of streams that occurred during heavy rains in winter season. Thus, a score value of 10 was given to a distance of ≤500 m, while a score value of 0 was given to distances of >1000 m. A weighting value of 0.1 was given to this factor, because of its influence on the envi- ronment. 4.2.9. Land Slope A slope map was created through the interpretation of DEM that covers the study area. [37,38] stated that nei- ther too steep nor too flat land slopes are appropriate for placing a landfill site, and a slope of less than 12% would suitable. In this study a slope of ≤10% was as- signed a score value of 0, while a slope of >20% was assigned a score value of 10. A weighting factor of 0.1 was assigned to this factor [1], because of its importance toward the environment to have a stable location for the solid wastes. C opyright © 2011 SciRes. JGIS  A. AL-HANBALI ET AL.275 5. Results and Discussion 5.1. Land use/Cover Maps Figures 4(b) to 6(b) show the land use/cover maps re- sulted from classifying the Landsat images of 1989, 1999, and 2009, respectively. Among the three land use/cover classes, urban class is the main class of interest. It is clear from Table 3 that there is a continuous urban ex- pansion during the last three decades. The urban area increased from 11.5 km2 in 1989 to 26.5 km2 in 1999, and then to 39.7 km2 in 2009. In the last 30 years, the urban area expanded more than 240%, which put some pressures on the existing solid waste disposal site. Generally, the directions of urban expansion in the study area were toward south, and southwest. While the villages, which are located very close to the existing dis- posal site, took different directions. They expanded to- ward east, and northeast to avoid getting closer to the solid waste disposal site more, as illustrated in Figure 8. 5.2. Landfill Site Selection Figure 9 shows the land suitability map for selecting the best possible solid waste disposal sites within the study area. The land suitability map was divided into five classes: most suitable, suitable, moderately suitable, poorly suitable, and unsuitable. Table 4 shows that 45.1% of the study area has a “moderately suitable” class of landfill site selection, whereas a total of 39.2% of the study area has “most suitable” and “suitable” classes. The “poorly suitable” and “unsuitable” classes for land- fill site selection occupied a total of 15.7% of the study area. Table 3. Summary of land use/cover classification statistics between 1989 and 2009 (area in km2). 1989 1999 2009 Land use/cover classes Area (km2)Area (%) Area (km2)Area (%)Area (km2)Area (%) Urban 11.5 1.4 26.5 3.3 39.7 4.9 Agriculture 78.6 9.8 65.8 8.2 76.0 9.4 Bare land 713.9 88.8 711.8 88.5 688.4 85.6 Total 804 100.0 804 100 804 100.0 Table 4. Statistical analysis for the Landfill site suitability map. Class Area (km2) Area (%) Most suitable 63.5 7.9 Suitable 251.4 31.3 Moderately suitable 362.8 45.1 Poorly suitable 116.4 14.5 Unsuitable 10.0 1.2 Total 804.0 100.0 Figure 8. The urban expansion within the study area during the period from 1989 to 2009. Copyright © 2011 SciRes. JGIS 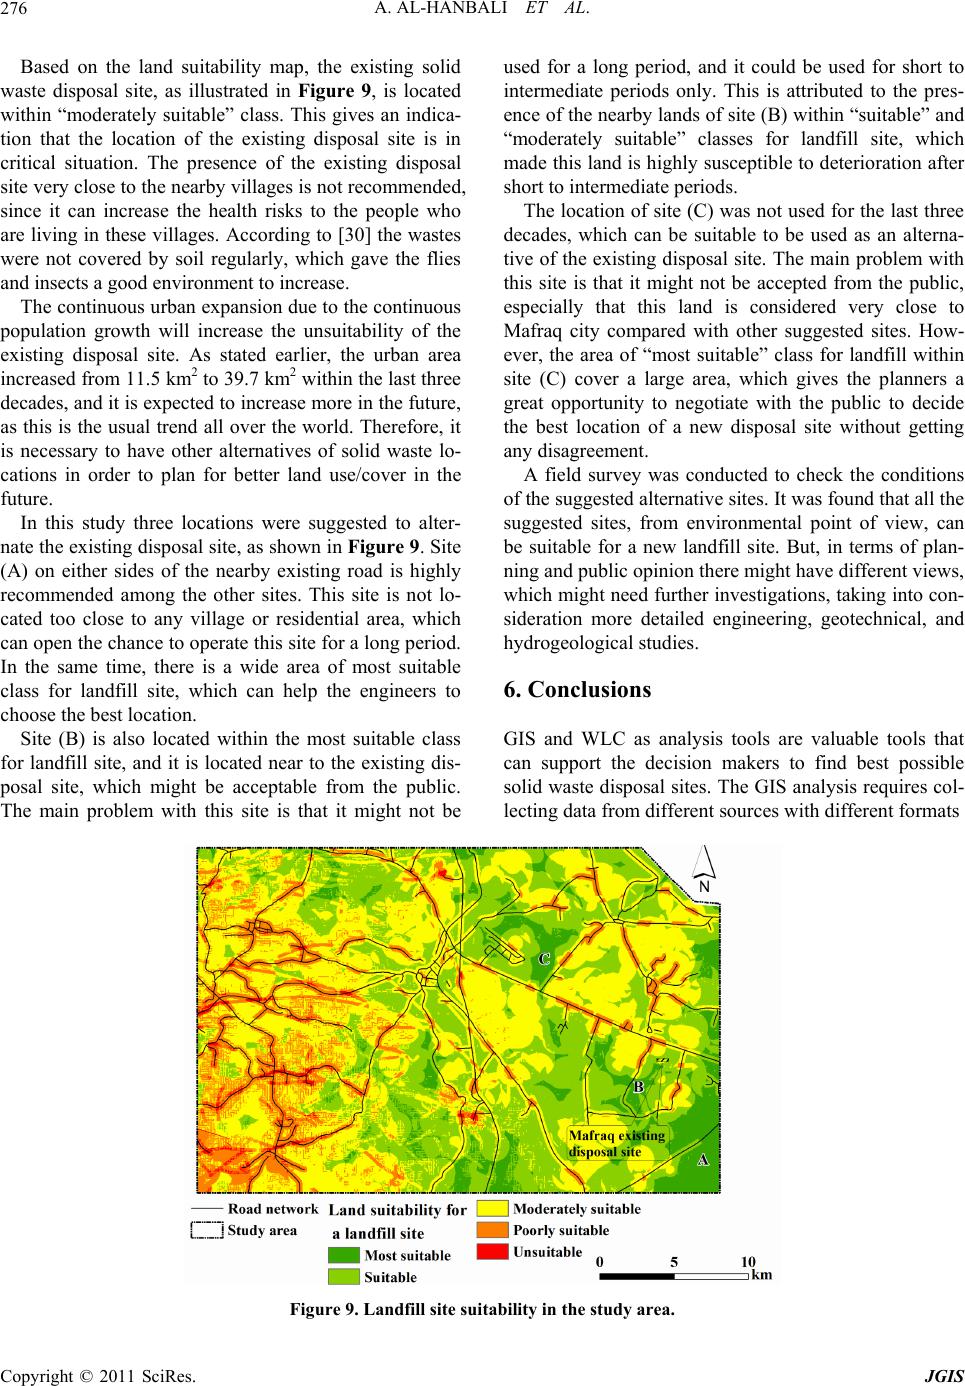 A. AL-HANBALI ET AL. 276 Based on the land suitability map, the existing solid waste disposal site, as illustrated in Figure 9, is located within “moderately suitable” class. This gives an indica- tion that the location of the existing disposal site is in critical situation. The presence of the existing disposal site very close to the nearby villages is not recommended, since it can increase the health risks to the people who are living in these villages. According to [30] the wastes were not covered by soil regularly, which gave the flies and insects a good environment to increase. The continuous urban expansion due to the continuous population growth will increase the unsuitability of the existing disposal site. As stated earlier, the urban area increased from 11.5 km2 to 39.7 km2 within the last three decades, and it is expected to increase more in the future, as this is the usual trend all over the world. Therefore, it is necessary to have other alternatives of solid waste lo- cations in order to plan for better land use/cover in the future. In this study three locations were suggested to alter- nate the existing disposal site, as shown in Figure 9. Site (A) on either sides of the nearby existing road is highly recommended among the other sites. This site is not lo- cated too close to any village or residential area, which can open the chance to operate this site for a long period. In the same time, there is a wide area of most suitable class for landfill site, which can help the engineers to choose the best location. Site (B) is also located within the most suitable class for landfill site, and it is located near to the existing dis- posal site, which might be acceptable from the public. The main problem with this site is that it might not be used for a long period, and it could be used for short to intermediate periods only. This is attributed to the pres- ence of the nearby lands of site (B) within “suitable” and “moderately suitable” classes for landfill site, which made this land is highly susceptible to deterioration after short to intermediate periods. The location of site (C) was not used for the last three decades, which can be suitable to be used as an alterna- tive of the existing disposal site. The main problem with this site is that it might not be accepted from the public, especially that this land is considered very close to Mafraq city compared with other suggested sites. How- ever, the area of “most suitable” class for landfill within site (C) cover a large area, which gives the planners a great opportunity to negotiate with the public to decide the best location of a new disposal site without getting any disagreement. A field survey was conducted to check the conditions of the suggested alternative sites. It was found that all the suggested sites, from environmental point of view, can be suitable for a new landfill site. But, in terms of plan- ning and public opinion there might have different views, which might need further investigations, taking into con- sideration more detailed engineering, geotechnical, and hydrogeological studies. 6. Conclusions GIS and WLC as analysis tools are valuable tools that can support the decision makers to find best possible solid waste disposal sites. The GIS analysis requires col- lecting data from different sources with different formats Figure 9. Landfill site suitability in the study area. C opyright © 2011 SciRes. JGIS 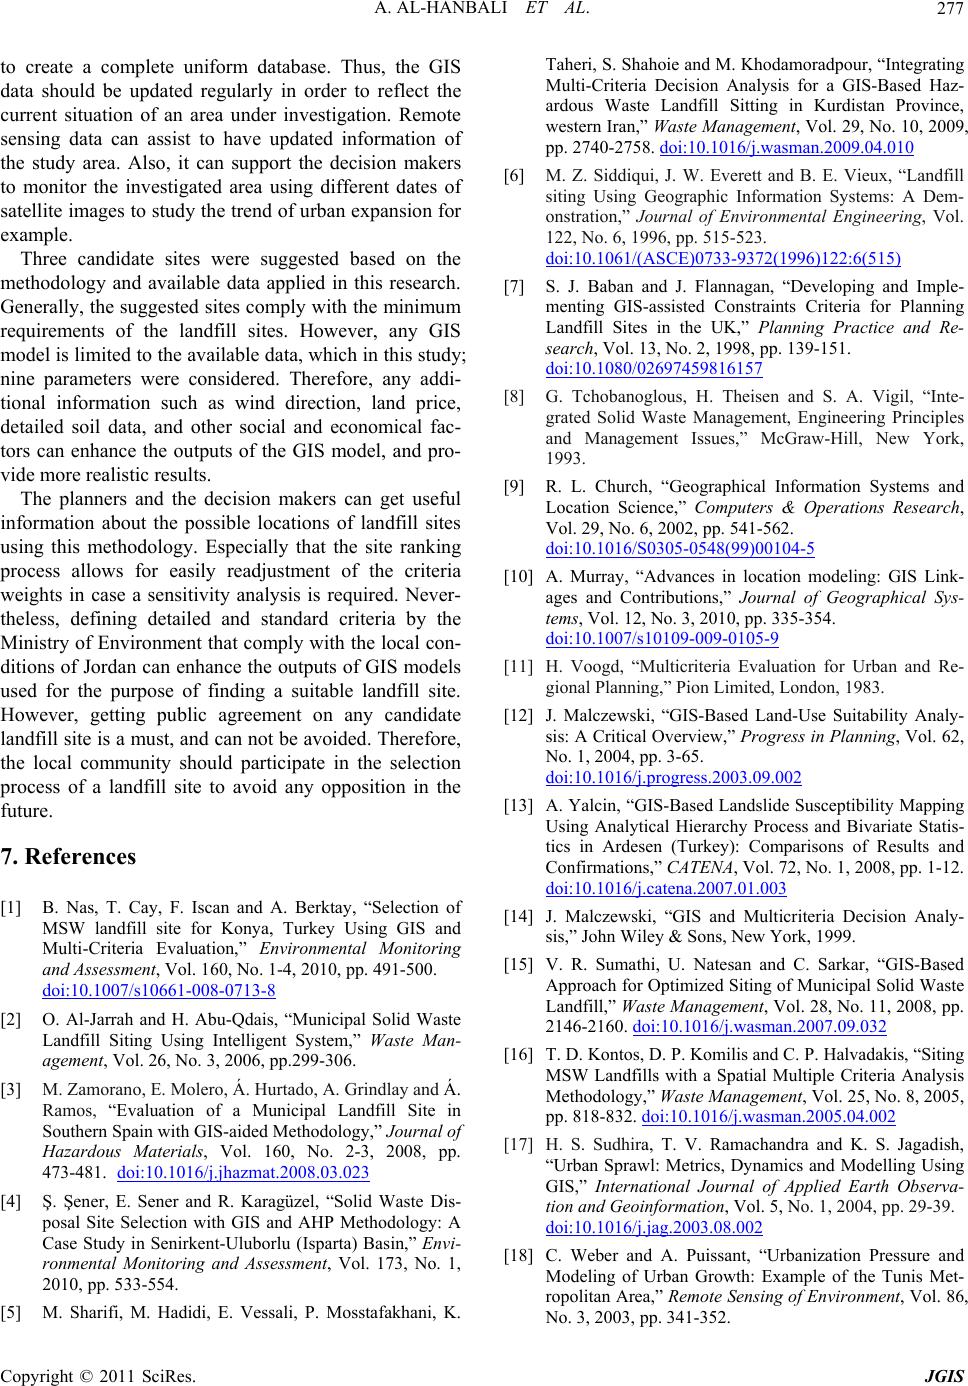 A. AL-HANBALI ET AL. 277 to create a complete uniform database. Thus, the GIS data should be updated regularly in order to reflect the current situation of an area under investigation. Remote sensing data can assist to have updated information of the study area. Also, it can support the decision makers to monitor the investigated area using different dates of satellite images to study the trend of urban expansion for example. Three candidate sites were suggested based on the methodology and available data applied in this research. Generally, the suggested sites comply with the minimum requirements of the landfill sites. However, any GIS model is limited to the available data, which in this study; nine parameters were considered. Therefore, any addi- tional information such as wind direction, land price, detailed soil data, and other social and economical fac- tors can enhance the outputs of the GIS model, and pro- vide more realistic results. The planners and the decision makers can get useful information about the possible locations of landfill sites using this methodology. Especially that the site ranking process allows for easily readjustment of the criteria weights in case a sensitivity analysis is required. Never- theless, defining detailed and standard criteria by the Ministry of Environment that comply with the local con- ditions of Jordan can enhance the outputs of GIS models used for the purpose of finding a suitable landfill site. However, getting public agreement on any candidate landfill site is a must, and can not be avoided. Therefore, the local community should participate in the selection process of a landfill site to avoid any opposition in the future. 7. References [1] B. Nas, T. Cay, F. Iscan and A. Berktay, “Selection of MSW landfill site for Konya, Turkey Using GIS and Multi-Criteria Evaluation,” Environmental Monitoring and Assessment, Vol. 160, No. 1-4, 2010, pp. 491-500. doi:10.1007/s10661-008-0713-8 [2] O. Al-Jarrah and H. Abu-Qdais, “Municipal Solid Waste Landfill Siting Using Intelligent System,” Waste Man- agement, Vol. 26, No. 3, 2006, pp.299-306. [3] M. Zamorano, E. Molero, Á. Hurtado, A. Grindlay and Á. Ramos, “Evaluation of a Municipal Landfill Site in Southern Spain with GIS-aided Methodology,” Journal of Hazardous Materials, Vol. 160, No. 2-3, 2008, pp. 473-481. doi:10.1016/j.jhazmat.2008.03.023 [4] Ş. Şener, E. Sener and R. Karagüzel, “Solid Waste Dis- posal Site Selection with GIS and AHP Methodology: A Case Study in Senirkent-Uluborlu (Isparta) Basin,” Envi- ronmental Monitoring and Assessment, Vol. 173, No. 1, 2010, pp. 533-554. [5] M. Sharifi, M. Hadidi, E. Vessali, P. Mosstafakhani, K. Taheri, S. Shahoie and M. Khodamoradpour, “Integrating Multi-Criteria Decision Analysis for a GIS-Based Haz- ardous Waste Landfill Sitting in Kurdistan Province, western Iran,” Waste Management, Vol. 29, No. 10, 2009, pp. 2740-2758. doi:10.1016/j.wasman.2009.04.010 [6] M. Z. Siddiqui, J. W. Everett and B. E. Vieux, “Landfill siting Using Geographic Information Systems: A Dem- onstration,” Journal of Environmental Engineering, Vol. 122, No. 6, 1996, pp. 515-523. doi:10.1061/(ASCE)0733-9372(1996)122:6(515) [7] S. J. Baban and J. Flannagan, “Developing and Imple- menting GIS-assisted Constraints Criteria for Planning Landfill Sites in the UK,” Planning Practice and Re- search, Vol. 13, No. 2, 1998, pp. 139-151. doi:10.1080/02697459816157 [8] G. Tchobanoglous, H. Theisen and S. A. Vigil, “Inte- grated Solid Waste Management, Engineering Principles and Management Issues,” McGraw-Hill, New York, 1993. [9] R. L. Church, “Geographical Information Systems and Location Science,” Computers & Operations Research, Vol. 29, No. 6, 2002, pp. 541-562. doi:10.1016/S0305-0548(99)00104-5 [10] A. Murray, “Advances in location modeling: GIS Link- ages and Contributions,” Journal of Geographical Sys- tems, Vol. 12, No. 3, 2010, pp. 335-354. doi:10.1007/s10109-009-0105-9 [11] H. Voogd, “Multicriteria Evaluation for Urban and Re- gional Planning,” Pion Limited, London, 1983. [12] J. Malczewski, “GIS-Based Land-Use Suitability Analy- sis: A Critical Overview,” Progress in Planning, Vol. 62, No. 1, 2004, pp. 3-65. doi:10.1016/j.progress.2003.09.002 [13] A. Yalcin, “GIS-Based Landslide Susceptibility Mapping Using Analytical Hierarchy Process and Bivariate Statis- tics in Ardesen (Turkey): Comparisons of Results and Confirmations,” CATENA, Vol. 72, No. 1, 2008, pp. 1-12. doi:10.1016/j.catena.2007.01.003 [14] J. Malczewski, “GIS and Multicriteria Decision Analy- sis,” John Wiley & Sons, New York, 1999. [15] V. R. Sumathi, U. Natesan and C. Sarkar, “GIS-Based Approach for Optimized Siting of Municipal Solid Waste Landfill,” Waste Management, Vol. 28, No. 11, 2008, pp. 2146-2160. doi:10.1016/j.wasman.2007.09.032 [16] T. D. Kontos, D. P. Komilis and C. P. Halvadakis, “Siting MSW Landfills with a Spatial Multiple Criteria Analysis Methodology,” Waste Management, Vol. 25, No. 8, 2005, pp. 818-832. doi:10.1016/j.wasman.2005.04.002 [17] H. S. Sudhira, T. V. Ramachandra and K. S. Jagadish, “Urban Sprawl: Metrics, Dynamics and Modelling Using GIS,” International Journal of Applied Earth Observa- tion and Geoinformation, Vol. 5, No. 1, 2004, pp. 29-39. doi:10.1016/j.jag.2003.08.002 [18] C. Weber and A. Puissant, “Urbanization Pressure and Modeling of Urban Growth: Example of the Tunis Met- ropolitan Area,” Remote Sensing of Environment, Vol. 86, No. 3, 2003, pp. 341-352. C opyright © 2011 SciRes. JGIS  A. AL-HANBALI ET AL. Copyright © 2011 SciRes. JGIS 278 doi:10.1016/S0034-4257(03)00077-4 [19] A. M. Dewan and Y. Yamaguchi, “Land Use and Land Cover Change in Greater Dhaka, Bangladesh: Using Re- mote Sensing to Promote Sustainable Urbanization,” Ap- plied Geography, Vol. 29, No. 3, 2009, pp. 390-401. doi:10.1016/j.apgeog.2008.12.005 [20] Y. Kurucu and N. Chiristina, “Monitoring the Impacts of Urbanization And Industrialization on the Agricultural Land and Environment of the Torbali, Izmir region, Tur- key,” Environmental Monitoring and Assessment, Vol. 136, No. 1, 2008, pp. 289-297. doi:10.1007/s10661-007-9684-4 [21] R. B. Potter, K. Darmame, N. Barham and S. Nortcliff, “Ever-Growing Amman, Jordan: Urban Expansion, So- cial Polarisation and Contemporary Urban Planning Is- sues,” Habitat International, Vol. 33, No. 1, 2009, pp. 81-92. doi:10.1016/j.habitatint.2008.05.005 [22] Department of Statistics (DOS), 2010. http://www.dos.gov.jo. [23] Department of Statistics (DOS), “Iraqis in Jordan Their Number and Characteristics,” 2010. http://www.dos.gov.jo/dos_home/dos_home_e/main/Iraqi s%20in%20Jordan.pdf. [24] Ministry of Environment (MoEnv), 2010. http://www.moenv.gov.jo. [25] H. A. Abu Qdais, “Techno-Economic Assessment of Municipal Solid Waste Management in Jordan,” Waste Management, Vol. 27, No. 11, 2007, pp. 1666-1672. doi:10.1016/j.wasman.2006.08.004 [26] M. Chopra, D. Reinhart and W. Abu-Al-Shaar, “US- Jordan Municipal Solid Waste Management Collabora- tive Research,” The National Science Foundation, Wilson Boulevard, Arlington, 2001. [27] Z. Al-Ghazawi and F. Abdulla, “Mitigation of Methane Emissions from Sanitary Landfills and Sewage Treatment Plants in Jordan,” Clean Technologies and Environmental Policy, Vol. 10, No. 4, 2008, pp. 341-350. doi:10.1007/s10098-008-0145-8 [28] Y. Abu-Rukah and O. Al-Kofahi, “The Assessment of the Effect of Landfill Leachate on Ground-Water Quality-A Case Study. El-Akader Landfill Site-North Jordan,” Jour- nal of Arid Environments, Vol. 49, No. 3, 2001, pp. 615-630. doi:10.1006/jare.2001.0796 [29] National Geospatial-Intelligence Agency (NGA), 2010. http://geoengine.nima.mil. [30] Japan International Cooperation Agency (JICA), “Basic Design Study Report on the Project for Improvement of Solid Waste Management in Major Local Areas in the Hashemite Kingdom of Jordan,” Final Report, Japan In- ternational Cooperation Agency, Tokyo, 1996. [31] US EPA, “Solid Waste Disposal Facility Criteria,” EPA530-R-93-017, US EPA, Washington, DC., 1993. [32] E. Tagaris, R. E. Sotiropoulou, C. Pilinis and C. P. Hal- vadakis, “A Methodology to Estimate Odors around Landfill Sites: The Use of Methane as an Odor Index and Its Utility in Landfill Siting,” Journal of the Air & Waste Management Association, Vol. 53, No. 5, 2003, pp. 629-34. [33] N. B. Chang, G. Parvathinathan and J. B. Breeden, “Combining GIS with Fuzzy Multicriteria Deci- sion-Making for Landfill Siting in a Fast-Growing Urban Region,” Journal of Environmental Management, Vol. 87, No. 1, 2008, pp. 139-153. doi:10.1016/j.jenvman.2007.01.011 [34] O. B. Delgado, M. Mendoza, E. L. Granados and D. Geneletti, “Analysis of Land Suitability for the Siting of Inter-Municipal Landfills in the Cuitzeo Lake Basin, Mexico,” Waste Management, Vol. 28, No. 7, 2008, pp. 1137-1146. doi:10.1016/j.wasman.2007.07.002 [35] N. Hadadin, M. Qaqish, E. Akawwi and A. Bdour, “Wa- ter Shortage in Jordan—Sustainable Solutions,” Desali- nation, Vol. 250, No. , 2010, pp. 197-202. [36] T. D. Kontos, D. P. Komilis and C. P. Halvadakis, “Siting MSW Landfills on Lesvos Island with a GIS-Based Methodology,” Waste Management & Research, Vol. 21, No. 3, 2003, pp. 262-277. doi:10.1177/0734242X0302100310 [37] H. Y. Lin and J. J. Kao, “A Vector-Based Spatial Model for Landfill Siting,” Journal of Hazardous Materials, Vol. 58, No. 1-3, 1998, pp. 3-14. doi:10.1016/S0304-3894(97)00116-7 [38] H. Y. Lin and J. J. Kao, “Enhanced Spatial Model for Landfill Siting Analysis,” Journal of Environmental En- gineering, Vol. 125, No. 9, 1999, pp. 845-851. doi:10.1061/(ASCE)0733-9372(1999)125:9(845)
|