Paper Menu >>
Journal Menu >>
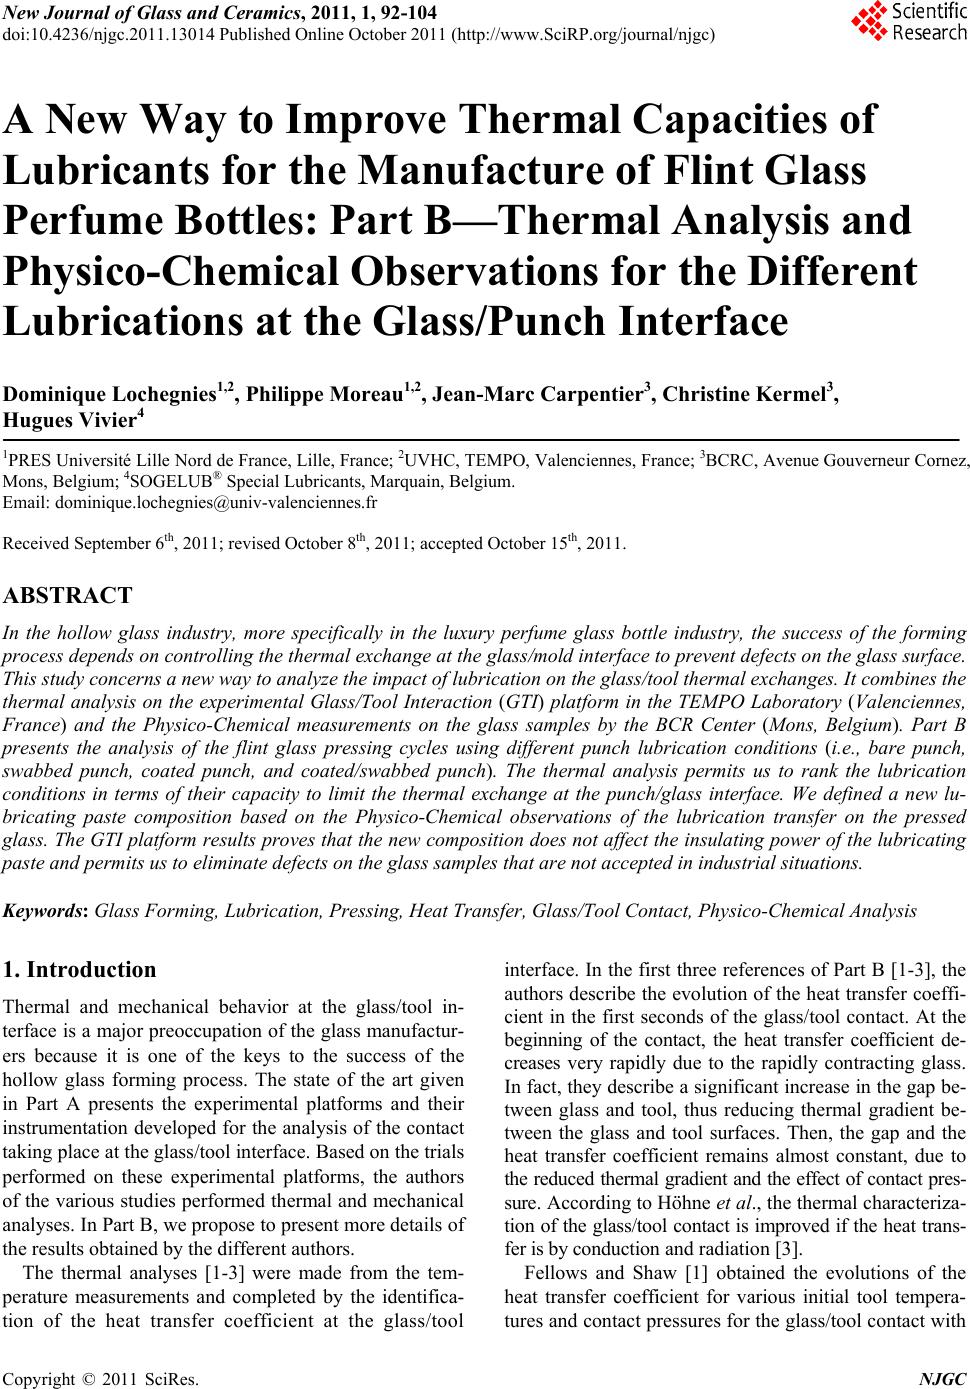 New Journal of Glass and Ceramics, 2011, 1, 92-104 doi:10.4236/njgc.2011.13014 Published Online October 2011 (http://www.SciRP.org/journal/njgc) Copyright © 2011 SciRes. NJGC A New Way to Improve Thermal Capacities of Lubricants for the Manufacture of Flint Glass Perfume Bottles: Part B—Thermal Analysis and Physico-Chemical Observations for the Different Lubrications at the Glass/Punch Interface Dominique Lochegnies1,2, Philippe Moreau1,2, Jean- Ma rc Carpentier 3, Christine Kermel3, Hugues Vivier4 1PRES Université Lille Nord de France, Lille, France; 2UVHC, TEMPO, Valenciennes, France; 3BCRC, Avenue Gouverneur Cornez, Mons, Belgium; 4SOGELUB® Special Lubricants, Marquain, Belgium. Email: dominique.lochegnies@univ-valenciennes.fr Received September 6th, 2011; revised October 8th, 2011; accepted October 15th, 2011. ABSTRACT In the hollow glass industry, more specifically in the luxury perfume glass bottle industry, the success of the forming process depends on controlling the thermal exchange at the glass/mold interface to prevent defects on the glass surface. This study concerns a new way to analyze the impact of lubrication on the glass/tool thermal exchanges. It combines the thermal analysis on the experimental Glass/Tool Interaction (GTI) platform in the TEMPO Laboratory (Valenciennes, France) and the Physico-Chemical measurements on the glass samples by the BCR Center (Mons, Belgium). Part B presents the analysis of the flint glass pressing cycles using different punch lubrication conditions (i.e., bare punch, swabbed punch, coated punch, and coated/swabbed punch). The thermal analysis permits us to rank the lubrication conditions in terms of their capacity to limit the thermal exchange at the punch/glass interface. We defined a new lu- bricating paste composition based on the Physico-Chemical observations of the lubrication transfer on the pressed glass. The GTI platform results proves that the new composition does not affect the insulatin g power of the lubricating paste and permits us to eliminate defects on the glass samples that are not accepted in industrial situations. Keywords: Glass Forming, Lubrication, Pressing, Heat Transfer, Glass/Tool Contact, Physico-Chemical Analysis 1. Introduction Thermal and mechanical behavior at the glass/tool in- terface is a major preoccupation of the glass manufactur- ers because it is one of the keys to the success of the hollow glass forming process. The state of the art given in Part A presents the experimental platforms and their instrumentation developed for the analysis of the contact taking place at the glass/tool interface. Based on the trials performed on these experimental platforms, the authors of the various studies performed thermal and mechanical analyses. In Part B, we propose to present more details of the results obtained by the different authors. The thermal analyses [1-3] were made from the tem- perature measurements and completed by the identifica- tion of the heat transfer coefficient at the glass/tool interface. In the first three references of Part B [1-3], the authors describe the evolution of the heat transfer coeffi- cient in the first seconds of the glass/tool contact. At the beginning of the contact, the heat transfer coefficient de- creases very rapidly due to the rapidly contracting glass. In fact, they describe a significant increase in the gap be- tween glass and tool, thus reducing thermal gradient be- tween the glass and tool surfaces. Then, the gap and the heat transfer coefficient remains almost constant, due to the reduced thermal gradient and the effect of contact pres- sure. According to Höhne et al., the thermal characteriza- tion of the glass/tool contact is improved if the heat trans- fer is by conduction and radiation [3]. Fellows and Shaw [1] obtained the evolutions of the heat transfer coefficient for various initial tool tempera- tures and contact pressures for the glass/tool contact with  A New Way to Improve Thermal Capacities of Lubricants for the Manufacture of Flint Glass Perfume Bottles: 93 Part B – How to Combine Thermal Analysis and Physico-Chemical Observations at the Glass/Punch Interface no lubricant. They determined the heat transfer coeffi- cient evolutions by using an analytical conduction model. In the case of high pressing pressures or high initial tool temperatures, the heat transfer coefficient may increase after the stable phase. In their study, these authors explain that, after the stable phase of the heat transfer coefficient, the tool temperature continues to increase up to and ex- ceeding a critical value when the sticking occurs. Moreau et al. [2] determined the heat transfer coeffi- cients using a finite difference thermal model for the va- rious contact pressures and lubricants. The evolution of the glass and tool surface temperatures complete the analysis of the lubricants’ thermal capacities. In addition, the au- thors used the heat transfer evolution obtained for the di- fferent lubrication conditions tested to model the blow- and-blow glass forming process. The main numerical re- sult concerned the impact of the lubrication on the perfume bottle’s glass thickness at the end of the forming process. Höhne et al. [3] proposed the heat transfer evolution for various glass compositions (especially colored glass), tool materials and tool roughnesses for the case of glass/- tool contact with no lubricant. For colored glass, the tool’s surface temperature increases much faster than for unco- lored glass and reaches a higher glass surface temperature. With decreasing tool surface roughness, the effective con- tact area is larger, thus allowing a greater heat transfer. In the mechanical studies [4-9], the analyses are essen- tially based on measuring the forces needed to separate the sticking glass from the tool. The examination of the surface morphology and composition of the coatings, be- fore and after pressing, using Scanning Electron Micro- scope (SEM) and optical profilometry complete the ana- lyses in three articles [5-7,9]. The different coatings used in container production and in the precision molding of optical components are studied and compared under dif- ferent experimental conditions. The experimental para- meters to be tested in these mechanical studies [4-9] pri- marily concern the contact duration, contact pressure, tool material, surface roughness, lubricant composition and glass viscosity. In addition, Dowling et al. [4] inclu- de the glass height and the tool slope in the experimental parameters. Dowling et al. [4] tested the influence of silicone lu- bricants and graphite-oil-based lubricant on the adhesion of molten glass to heated metals. The graphite-oil-based lu- bricant presented the best durability, and silicone lubricants were found to have high critical adherence temperatures. Pech et al. [5] achieved lubrication by thermally crack- ing acetylene directly onto polished stainless steel surface. The non-sticking condition between the glass and the tool was obtained either by increasing the surface roughness, by lubricating the tool surface, or by pre-oxidizing the tool surface. Manns et al. [6] investigated the sticking behavior of various tool materials and metallic and ceramic coatings used for the hot glass melt forming processes. Sticking was characterized by two temperature limits. These au- thors defined the lower sticking temperature as the tem- perature when the sticking time is less than 60s and the upper sticking temperature when the sticking time is greater than 60s. In non-isothermal pressing conditions, these tem- peratures depended on the tool material and the glass com- position. The lower sticking temperatures of uncoated tools depend on the thermal effusivity of the bulk tool material. Fischbach et al. [7] studied 2 coatings (i.e., Pt-Ir and TiAlN), used during precision glass molding. They found that the factors that significantly affect the sticking force were contact duration, cooling time and contact pressure. The sticking force is not significantly affected by the film composition, surface roughness and tool material. Rieser et al. [8] cyclically immersed metal rods in soda- silica glass melt at 1050˚C in oxidizing atmosphere to in- vestigate the influence of tool materials, coatings (e.g. plasma nitridation, galvanic plating, physical-vapour-deposition ceramic coating), and surface roughness on sticking. The sticking condition was found to be dependent on contact duration and contact pressure, though it appeared insen- sitive to the tool material and the coating. Separation for- ces were found to be independent of tool roughness, ex- cept for the coating containing boron nitride. The results showing no effect of the tool material, the lubricant composition, and the tool roughness on the stick- ing temperature [7,8] do not correspond to the experience in glass container production, in which the influences of these parameters were observed [8]. Rieser et al. [8] pro- posed one explanation for this discrepancy: the major di- fference between the thermal dynamics of the laboratory experiments and the industrial glass forming process. Falipou and Donnet [9] found the sticking phenome- non to be controlled primarily by the viscosity of the mel- ted glass, and then the temperature of the melted glass at the glass/tool interface. If the glass viscosity was suffi- ciently low, the contact area was maximal, thus allowing physico-chemical interactions between the glass and the metallic substrate to be effective in causing the sticking phenomenon [9]. This study proposes to use the joint procedure defined in Part A to analyze different lubrication conditions en- countered in the production of luxury perfume bottles. Using the Glass Tool Interaction (GTI) Platform of the TEMPO Laboratory (Valenciennes, France), the indus- trial processing conditions were replicated in terms of pro- cess parameters (i.e., temperature, materials, roughness, contact pressure, lubrication) and kinematics. The different Copyright © 2011 SciRes. NJGC  A New Way to Improve Thermal Capacities of Lubricants for the Manufacture of Flint Glass Perfume Bottles: 94 Part B – How to Combine Thermal Analysis and Physico-Chemical Observations at the Glass/Punch Interface lubrication conditions (i.e., bare punch, punch swabbed with a lubricating paste, punch coated with a resin film, punch coated with a resin film and then swabbed with lu- bricating paste) were compared based on the thermal mea- surements inside the punch during the pressing cycles. The physico-chemical measurements for the glass sample surfaces after the GTI trials were performed by the BCR Center (Mons, Belgium), thus completing the analysis of the different lubrication conditions. Based on our results, we defined a new chemical composition to create an in- novative lubricant, which was tested and compared with our initial lubrication conditions. 2. Replication of Industrial Practice on the GTI Platform 2.1. Industrial Practice for Manufacturing Flint Glass Perfume Bottles Cast iron is the material usually used for the mold for manufacturing perfume bottles. Cheap and easily machi- nable, cast iron is able to rapidly transfer the heat from the glass to the outside of the mold [10]. Flint glass makes it possible to obtain perfume bottles with a unique trans- parency. The blow-and-blow process is a common proc- ess used to manufacture flint glass perfume bottles. A glass gob is loaded into a blank mold, before being blown to create the glass parison. After the transfer to the final mold, the parison sags and then is blown until the final product is obtained. For a given perfume bottle to be manufactured, the op- timum forming parameters on the production line depend on the bottle weight and size. To reproduce industrial form- ing conditions on the GTI platform, the following stan- dard values were used for the main forming parameters. The surface temperature of the glass gob before the first blowing operation was in [900˚C, 1000˚C] interval. The ini- tial temperature of the blank mold at the beginning of the production was in [400˚C, 500˚C] interval. This initial tem- perature will rapidly increase about 100˚C after repeated contact with the hot glass and remains stable afterwards [11]. During the blowing operations, the contact pressure between the glass and the molds was lower than 0.5MPa. A resin film was applied on the inner surfaces of the molds to lubricate them about 6 to 8 hours before laun- ching the production. Prior to their installation in the In- dependent Section (IS) machine, the molds coated by the resin film were heated to 450˚C in a furnace. This pre- heating tightens the resin film, extends the lifetime of the resin film, and limits the number of times the mold has to be swabbed before launching the production. If the mold is cold, the resin film tends to pull out of the mold’s inner surfaces while the mold is being swabbed with the lubri- cating paste. Pre-heating the mold allowed the swabbing to be done every 3 minutes during the production, with a cotton swab saturated with the lubricating paste. 2.2. Replication of the Industrial Conditions on the GTI Platform Coming as close as possible to the industrial conditions, the objective of the trials performed on the GTI platform is to compare the different lubrication conditions, which are linked to the four different punch preparations. The trials are designated as follows: the B trial, which was con- ducted with a bare punch with no lubrication; the S trial, which was conducted with a punch swabbed with a lu- bricating paste (the S trial results were given in Part A); the C trial, which was conducted with a punch coated with the resin film; and the CS trial, which was conducted with a punch coated with the resin film and then swabbed with the lubricating paste. A pressing cycle on the GTI platform is completely described in Part A (Section 2). For every lubrication trial described above, we repeated the trial three times, with the objective of guaranteeing each trial’s repeatability and of estimating the punch’s average temperature evo- lution for each of the lubrication conditions. Except for the lubrication on the punch, all the other input data were fixed at the same values for all of the pressing cycles on the GTI platform, for both Part A and Part B. To represent the industrial production of luxury flint glass perfume bottles, we had to choose input data that con- formed to industry practice. First, the materials used for the GTI trials had to be the materials used in the luxury glass perfume bottles industry. For this reason, the glass pressed on the GTI platform and the cast iron used to ma- nufacture the GTI punches were delivered by the Verre- ries Pochet du Courval. The punches used were machined so that the roughness of the punch surface is within the range of the roughness encountered in industrial blank molds. The chemical composition of the cast iron and the flint glass were respectively given in Table 1 and in Ta- ble 4 in Part A. The lubrication products (i.e., the resin film and the lubricating paste) used on the punch surface during the GTI trials were the products of our partner, SOGELUB® Special Lubricants Company. In addition to the choice of the materials (glass and pun- ch), for one GTI trial, we used six input data associated to the GTI control system: the temperature of the electric furnace, the heating resistance temperature level at the exit of the furnace, the cutting time, the initial tempera- ture of the molds and the punch, the duration of the glass pressing, and the contact pressure between the glass and the punch. The values used for all the GTI trials presented in this paper reproduce the industrial practice: 1060˚C, 1130˚C, 450˚C, 7s, 20s and 0.2MPa. Copyright © 2011 SciRes. NJGC  A New Way to Improve Thermal Capacities of Lubricants for the Manufacture of Flint Glass Perfume Bottles: 95 Part B – How to Combine Thermal Analysis and Physico-Chemical Observations at the Glass/Punch Interface Like on the industrial site, the electric furnace tempe- rature and the heating resistance temperature were respect- tively equal to 1060˚C and 1130˚C, so the surface tempe- rature of the glass gob when it exits from the furnace will be greater than 950˚C. Setting the temperature of the pun- ch to 450˚C allowed us to reproduce the industrial prac- tice in which the industrial blank molds are preheated to 450˚C before launching the production. The cutting time was set to 7s; the glass temperature was greater than 950˚C; and the weight of the glass gob was greater than 37g. With this weight, the molds were filled so that the contact pressure on the punch was 0.2 MPa. This pressure level is representative of the industrial practice in the blow-and- blow process in the manufacture of luxury perfume bottles. For the lubrication (i.e., resin film, lubrication paste), we attempted to reproduce the industrial practice as closely as possible during the GTI trials. For this reason, the pun- ch was coated with a resin film eight hours before the GTI trial. Like in industrial practice, this coating was pre- heated to 450˚C for five hours. In the trials performed with the lubricating paste, the punch was swabbed with the lubricating paste using a cotton swab just before the beginning of the trial. This cotton swab was saturated by the lubricant in order to reproduce the same lubrication conditions for each trial. The cotton swab was used for one single trial, and the punch was swabbed only once during the trial. There were seven output data (i.e., glass sample mass, heating resistance temperature, glass temperature when it comes out of the furnace, temperature of the three ejec- tors, the pressing force, punch temperature) to verify the trial validity in terms of the input data. The verification of these output data guaranteed the repeatability of trial conditions. The last output data (i.e., punch temperature) was used in this study to compare the lubrication condit- ions tested on the GTI platform. As mentioned above, for each lubrication condition, the trial was repeated 3 times and numbered 1, 2 or 3. For each trial repetition, 51 pressing cycles were performed with a recording of the output data (temperatures, mass and force) for each pressing cycle. A total of 22 000 data were recorded per pressing cycle. The seven output data were analyzed in two steps. In the first step, we checked that no drift appeared during the complete length of each pressing cycle. Since one trial corresponds to 51 pressing cycles, each average tempe- rature and force value was computed from 22 000 x 51 data. For the mass, only 51 data were used since 51 glass samples were pressed during one trial. Average values of each of the seven output data, with the relative standard deviation, were computed for each trial. Table A.1 in Appendix A gives the average values of the seven output data, with in parentheses the relative standard deviation, for each repetition of the B, C and CS trials. The values of the seven output data for the S trial were given and analyzed in Part A. The weight of the glass samples for the nine pressing cycles was stable and greater than 37g (Column 1 in Table A.1) for the B, C, and CS trials. With this glass sample weight, the set pressure of 0.2 MPa was respected during each pressing cycle for each trial. The repetition of the B, C and CS trials were per- formed in stabilized temperature conditions. The next five temperature output data (i.e., heating resistance tem- perature, glass temperature when it comes out of the fur- nace, temperature in the three ejectors) shows that the relative standard deviation for the nine sets of 51 press- ing cycles is between 0.1% and 2.6%. The last column concerns the pressing force: the standard deviation rea- ches 7.9%, but the measured force remains stable be- tween 389N and 407N. For this preliminary analysis, we concluded that GTI output data for the mass, temperature and force were stable over one trial. Consequently, there was no significant variation of experimental conditions during each repetition of the B, C and CS trials. In the second step of the analysis, we computed the average values of the seven output data with standard deviations for each trial (i.e., for each punch lubrication condition), repeated three times. Table A.2 presents the results of this second analysis step for the 7 output data (The last line in Table A.2 is a copy of last line in the Table A.1 in Part A, corresponding to the S trial ). For the second analysis, the relative standard deviation of the 7 output data is between 0.41% and 2.3% for mass and temperature. The standard deviations for the pressing for- ce are larger, varying between 4.4% and 6.1% but remain acceptable. We concluded that, for each lubrication con- dition tested on the GTI platform, the output data were stable around similar values during each of the 3 repeti- tions of each trial. Consequently, for each lubrication con- dition, the trial repetitions were performed under the same experimentation conditions. As general conclusion based on the results listed in Ta- ble A . 1 and Table A.2 , we concluded that, with the same set of GTI input data, except for the punch lubrication, and with very similar GTI control output data for the twel- ve trial repetitions, all the GTI trials were performed us- ing the same conditions. Consequently, comparing the tem- perature of the GTI punch for the different trials makes sense. 3. Thermal Analysis of the B, S, C and CS Trials and Physico-Chemical Observations 3.1. Thermal Analysis for All the Pressing Cycles Since all the trials presented in Parts A and B were performed using the same conditions, the average temrature Copyright © 2011 SciRes. NJGC  A New Way to Improve Thermal Capacities of Lubricants for the Manufacture of Flint Glass Perfume Bottles: Part B – How to Combine Thermal Analysis and Physico-Chemical Observations at the Glass/Punch Interface Copyright © 2011 SciRes. NJGC 96 evolution inside the punch were computed from the three temperature evolutions obtained for each trial repetition (one for the B trial, one for the C trial, and one for the CS trial using the experimental procedure deribed Part A). With the B, C, CS and S trials in which only the lubrica- tion conditions on the punch surface changes, the com- parison of average temperature evoluons inside the punch allowed us to perform to the thermal analysis for the 4 lubrication conditions (i.e., B: bare punch, S: swabbed pun- ch, C: coated punch, and CS: coated/abbed punch). The thermal analysis for one GTI trial was performed from the average temperature evolution in mold 1 since the same observations can be made for mold 2 and mold 3; the average temperature evolution in mold 1 was in- terpolated with a 6th degree polynomial as explained in Part A (Section 3.1). Figure 1 presents the average tem- perature evolutions in the punch for 17 pressing cycles in mold 1, obtained after 3 repetitions using the same con- ditions for the different lubrication conditions: B trial, S trial, C trial and CS trial at the glass/punch interface. The transient phase includes up to 6th trial or a cumulative contact time of 132s for all the lubrication conditions, and the average temperature in the punch gradually in- creases. After the 6th trial or after 132s cumulative con- tact time, the temperature in the punch is more stable and decreases slightly. With the average temperature evolutions obtained from the GTI trials (Figure 1), we compared the heat transfer at the glass/punch interface under the different lubrica- tion conditions. The B trial (bare punch in Figure 1) pre- sented a higher temperature curve at 1.5mm from the punch surface. The S trial (swabbed punch in Figure 1) presen- ted a reduction of the temperature increase, and the C trial (punch coated with a resin film in Figure 1) presented a greater decrease. The best result in terms of temperature limitation in the punch was obtained for the CS trial us- ing a punch coated with the resin film and swabbed with a lubricating paste. This optimum situation is representa- tive of the practice in the perfume bottle industry. Figure 1 shows the punch’s average temperature evo- lution when the pressing cycles occur in mold 1. To com- pare the different lubrication conditions over the whole trial length regardless of the mold used, the pressing cy- cles have to be analyzed globally for all the glass sam- ples and all the molds. Since the B trial corresponds to the highest temperature increase in the punch (or the glass/- punch thermal exchange), this trial was used as a refer- ence for comparing the different lubrication conditions over the whole trial length for all the pressing cycles for all the molds. Figure 2 presents the deviation of the average tem- perature evolution in the punch for all the pressing cycles for the S trial, the C trial and the CS trial, compared with B trial, after 3 trial repetitions using the same conditions. The thin line in Figure 2 represents the deviation ob- tained from the measured temperatures, and the thick line Figure 1. Aver age temperature evolutions in the punch during pr essing cycles for mold 1 after 3 trial repetitions on the GTI platform for the B, C, CS and S trials.  A New Way to Improve Thermal Capacities of Lubricants for the Manufacture of Flint Glass Perfume Bottles: 97 Part B – How to Combine Thermal Analysis and Physico-Chemical Observations at the Glass/Punch Interface Figure 2. Deviations (based on raw and interpolated data) of the average temperature evolution in the punch during all the GTI pressing cycles for C, CS, S trial compared to the B trial. represents the previous deviation after interpolation with a 6th degree polynomial. The interpolated curves (thick line in Figure 2) show clearly that, except for the first pressing cycles in the transient phase, the ranking of lu- brication conditions in Figure 1 for all the pressing cy- cles is confirmed, regardless of the mold used. Compared to the B trial (bare punch), after the tem- perature was stabilized and after 132 seconds of cumula- tive contact time, the temperature reduction at 1.5mm was 4˚C with just the lubricating paste on the punch surface (S trial in Figure 2). With the punch only coated with the resin film (C trial in Figure 2), this reduction increases to 7˚C. Finally, when we replicated the industrial practice on the GTI platform with the punch coated with the resin film and swabbed with the lubricating paste, the maxi- mum temperature decrease in the punch reached 19˚C (CS trial in Figure 2). In conclusion, the results presented in Figures 1 and 2 for our GTI trials makes it possible to rank the efficiency of the tested lubrication conditions in terms of limiting the punch’s temperature increase, or in other words, lim- iting the heat transfer between the hot glass and the pun- ch. The most efficient is the punch coated by the resin film and swabbed with the lubricating paste (CS trial), then the punch coated with the resin film (C trial), and finally the punch swabbed with the lubricating paste (S trial). 3.2. Physico-Chemical Observations We used a Scanning Electron Microscope (SEM) (JEOL JSM-5900LV) and Energy Dispersive Spectrocospy (EDS) detector on the SEM to analyze and characterize the glass, with the objective being to trace any lubricant transfer on the glass samples during the pressing cycles (details in Section 4 in Part A). (To respect the confidentiality of our industrial partners, the elements were denoted with Ei, where i is equal to 1,2,…i.) From the preliminary trials on the GTI platform with swabbed, coated and coated/swab- bed punches, markers were defined as representative of the lubricants: - E2 and E7 for the resin film, and - E10 and E11 for the lubricating paste. Our main goal is to identify lubricant transfer from the punch to the glass samples. Thus, the SEM observations and the EDS analysis only concern the S, C, and CS trials since there was no lubrication on the punch for the B trial. For the S trial (resp. the C or CS trial), the observations on each of the three glass sample series pressed with swab- bed punch (resp. the coated or coated/swabbed punch) by the three repetitions of the S trial (resp. the C or CS trial) are similar. The glass samples for the three series pressed with coated punch with no lubricating paste present a reduced quantity of markers on the glass sample surfaces in con- tact with the punch. We observed a few spots of foreign matter on the glass, which do not exceed 200µm. Fig- ures 3 and 4 show representative spot distributions, in which the intermediate spots appear like clusters of small spots. Figure 5 shows larger spots, which are more rare. Although the spots in Figures 3, 4, and 5 have different aspects, their compositions are equivalent. Copyright © 2011 SciRes. NJGC  A New Way to Improve Thermal Capacities of Lubricants for the Manufacture of Flint Glass Perfume Bottles: 98 Part B – How to Combine Thermal Analysis and Physico-Chemical Observations at the Glass/Punch Interface Figure 3. SEM image of resin film traces (dark grey) on the surface of the 30th glass sample pressed during the 1st repetition of the C trial on the GTI platform. Figure 4. SEM image of resin film traces (dark grey) on the surface of the 45th glass sample pressed during the 1st repetition of the C trial on the GTI platform. Figure 5. SEM image of resin film traces (dark grey) on the surface of the 31st glass sample pressed during the 3rd repetition of the C trial on the GTI platform. The markers E2 and E7 from the resin film have im- portant percentages in these dark traces (respectively 4.2 and 1.5 in the square in Figure 3). We can conclude that there is a transfer of the resin film from the punch to the pressed glass surface during the GTI trial. Figure 4 dis- plays some tiny white points, which are sometimes ob- served in the resin film traces or close to them. These white points are rich in the element E1, the main com- ponent of the punch. They are undoubtedly the particles transferred from the punch itself. During the 51 pressing cycles for the three trials with coated punch, the resin film was transferred to the glass samples, but, compared to S trial analyzed in Part A (Section 4.2), less constantly than the lubricating paste, according to the frequency of the spots. For the CS trial, we observed the presence of smaller spots compared to the C trial on the pressed glass surfa- ces. Most of them were between 10 and 100 µm (Figures 6 and 7), with three different spots compositions. Some spots present markers of the lubricating paste (e.g. E10: 8.4%, E11: 5.1% for the square □ 1 in Figure 6, E10:2.5%, E11: 1.4% for the square □ 1 in Figure 7). In comparison with the participation ratios of E10 and E11, these spots are similar to the spot composition from the glass samples pressed with the swabbed punches in Part A (Section 4.2). Another spot composition (e.g., square □ 2 in Figure 7) presents a mixed composition with both the marker E2 (34.2%) from the resin film and the markers E10 (7.0%) & E11 (1.1%) from the lubricating paste. These spots look all the same. However, it is not possible to identify the nature of the marker just from its aspect. A third compo- sition can be detected for certain traces with other char- acteristic features, such as scales or flakes. Their compo- sition analysis shows the presence of resin film marker E2 (6.3% in case of the spot in the square in Figure 8). These spots have a similar composition to the flakes on the glass samples pressed with the coated punch with no lubricating paste. We also observed tiny white points, shown in Figure 6 in square □ 2. A closer EDS analysis on those points high- lights that they may consist of metal from the punch or they may be rich in markers from the lubricants (E2: 23.9%, E10: 10.9%, E11: 5.5%). The EDS analysis showed the pre- sence of the element E14 (13.3%), which is not one of the markers for the resin film or the lubricating paste. E14 is not present in sufficient quantities in the resin film or in the lubricating paste to be detected by the preliminary EDS analysis on the swabbed or coated punches perfor- med for Part A (Section 4.1). During the GTI trial, there is a concentration of such elements in tiny white points observed for the CS trial (Figure 6) or for the S trial (see Figures 6 to 9 in Part A). As the presence of the spot traces is sporadic on the glass sample surface and observed in small quantities Copyright © 2011 SciRes. NJGC  A New Way to Improve Thermal Capacities of Lubricants for the Manufacture of Flint Glass Perfume Bottles: 99 Part B – How to Combine Thermal Analysis and Physico-Chemical Observations at the Glass/Punch Interface Figure 6. SEM image of lubricant traces (dark grey) on the surface of the 20th glass sample pressed during the 2nd repetition of the CS trial on the GTI platform. Figure 7. SEM image of lubricant traces on the su rface of the 30th glass sample pressed during the 1st repetition of the CS trial on the GTI platform. Figure 8. SEM image of resin film traces (dark grey) on the surface of the 40th glass sample pressed during the 2nd repetition of the CS trial on the GTI platform. throughout the pressing series, it is impossible to evaluate whether or not there is more lubricating paste transfer from the punch to the glass surface, with or without un- rlying resin film, for the 51 pressing cycles. 4. Thermal Analysis and Physico-Chemical Observations of the GTI Trials with a Punch Swabbed with the New Lubricating Paste 4.1. The New Lubricating Paste Before our current research, in collaboration with the Ver- reries Pochet du Courval, SOGELUB® Special Lubri- cants Company has been developing lubricant products for the perfume botlle production for many years. The composition of the lubricant products (i.e., the resin film and the lubricating paste) was mainly based on a trial-and-error procedure on the industrial production lines by combining glass experiments and the expertise of the representatives of the lubricant companies. At the beginning of this study, during lubricant testing on the lines, some perfume bottles were rejected because of one typical defect, whose binocular image is given in Figure 9(a). In the SEM image of this defect on a fragment after breaking the perfume bottle (Figure 9(b)), white points are present as in the S trial (Figure 7 in Part A) and in the SC trial (square □ 2 in Figure 6). Markers of the resin film (E2) and the lubricating paste (E10) were de- tected. They prove that both the resin film and the lubricating paste are transferred on the perfume bottle during pro- duction. However, the most important is the presence of the marker E14. Before this study on the GTI platform, the cause of this defect had not been identified. By reproducing the same defect (i.e., tiny white points) on the GTI platform, this element E14 was suspected to be the cause of this defect. Thus, SOGELUB® Special Lubricants Company devel- oped a new form of the lubricating paste without the element E14, and we performed a trial on the GTI plat- form with a punch swabbed with the new lubricating paste (denoted the SN trial). By comparing the SN trial with the S trial, we evaluated the consequences of re- moving element E14 on the thermal exchange at the glass/punch interface and on the presence of tiny white points on the glass samples. 4.2. Thermal Analysis and Physico-Chemical Observations We used again our experimental procedure to perform 3 trial repetitions with the punch swabbed with the new lu- bricating paste (i.e., the SN trial) using the same input data given in Section 2.2 and used for the B, S, C, and Copyright © 2011 SciRes. NJGC  A New Way to Improve Thermal Capacities of Lubricants for the Manufacture of Flint Glass Perfume Bottles: 100 Part B – How to Combine Thermal Analysis and Physico-Chemical Observations at the Glass/Punch Interface (a) Figure 9. Lubricant traces on the surface of a flint glass perfume bottle: (a) Binocular image, (b) SEM image on a fragment after breaking the perfume bottle. (b) CS trials. The three first lines of Table A.3 give the av- erage values of the seven output data for the 3 repetitions of the SN trial, with the relative standard deviation be- tween parentheses. With the relative standard deviations between 0.1% and 4.1%, no drift appears for the com- plete duration of each pressing cycle for the trials SN1, SN2 and SN3 (Table A.3). Thus, there was no signify- cant variation of the experimental conditions during each of the 3 SN trials. The last line of the Table A.3 presents the average values of the seven output data with standard deviations for the SN trial. The relative standard deviations are between 0.1% and 4.3%. Consequently, the three trials were performed under the similar experimental conditions. The average temperature evolution inside the punch was then computed from the three temperature evolutions, derived from the three trials: SN1, SN2 and SN3. The ther- mal analysis was performed from the average temperature evolution for pressing cycles for mold 1, but the same observations can be made for mold 2 and mold 3. If on Figure 1, the average temperature evolution in the punch during the pressing cycle for mold 1 for the SN trial is plotted, we will find that the average temperature evolu- tions in the punch for the S trial and the SN trial are very similar. Over the complete trial duration, the average devia- tion between the two temperature evolutions is only 0.5˚C. In this section, we compare SN trial with the other tri- als (i.e., B, S, C and CS) presented in Section 3, using the thermal analysis of two specific pressing cycles: the first pressing cycle in the transient phase and the 10th pressing cycle in the stable phase as described in Part A (Section 3.2). The thermal analysis was limited to the first 5 sec- onds of the pressing cycle, which corresponds to the du- ration of the blowing operations in the industrial perfume bottles manufacturing process. Figure 10 presents the punch’s average temperature evolutions in the transient phase of the GTI trial during the first 5s of the first pressing cycle for mold 1 after the 3 trial repetitions for the B, S, C, and CS trials. During the first 5s of the punch/glass contact, the temperature Figure 10. Average temperature evolution in the punch for the first pressing cycle for mold 1 after 3 repetitions on the GTI platform for the B, C, CS, S and SN trials during the first 5s of the pressing cycle. Copyright © 2011 SciRes. NJGC  A New Way to Improve Thermal Capacities of Lubricants for the Manufacture of Flint Glass Perfume Bottles: 101 Part B – How to Combine Thermal Analysis and Physico-Chemical Observations at the Glass/Punch Interface ch surface, with the new lu- nput data for the GTI trials and the control of erage temperature ev rises at 1.5mm from the pun bricating paste (SN in Figure 10) and with the initial lu- bricating paste (S in Figure 10). The curves are very similar. The average deviation between the SN and S cur- ves showing the temperature evolution in the punch after 5s is + 2.8˚C. Due to the i the output data, the initial temperature in the punch (between 444˚C and 450˚C) is similar for all the lubri- cating conditions (Figure 10). During the first 5s on the first pressing cycle, the temperature evolution at 1.5mm from the punch/glass contact zone is linear and similar, whatever the lubrication conditions. After 5s, the tempe- rature rise is between 50˚C and 55˚C (+ 55˚C for B, C and CS trials, + 50˚C for S and SN trials). Figure 11 presents the punch’s av olution in the stable phase of the GTI trial during the first 5s of the 10th pressing cycle for mold 1 after the 3 trial repetitions for the B, S, C, and CS trials. During the first 5s of the punch/glass contact in the stable phase, the temperature rises at 1.5mm from the surface of the punch swabbed with the new lubricating paste (SN in Figure 11) and with the initial lubricating paste (S in Figure 11). Figure 11. Average temperature evolution in the ilar. The average deviation be- ditions, we no- te pressing cycle in the stable ph cycle in the stable phase of all the trials an he E10 and E11 m PO Laboratory (Valenciennes, France) punch in the stationnary phase for the 10th pressing cycle for mold 1 after 3 repetitions on the GTI plat- form for the B, C, CS, S and SN trials during the first 5s of the pressing cycle. The curves are quite sim tween the SN and S curves showing the temperature evolution in the punch after 5s is + 0.4˚C. Comparing the different lubrication con that the deviation of the initial temperature in the pun- ch at the beginning of the 10th pressing cycle compared to the first pressing cycle is around + 100˚C (for trial B- = + 104˚C, trial S = + 102˚C, trial C = + 96˚C, trial CS = + 95˚C and trial SN = +101˚C). After 5s of the pressing cycle, the temperature increase at 1.5mm from the punch surface is reduced in comparison with the first pressing cycle: + 39˚C for the B trial, + 35˚C for the S trial, + 34˚C for the C trial, + 35˚C for the CS trial, and + 34˚C for the SN trial. This leads to a reduction of the temperature in- crease between 15˚C and 21˚C (16˚C for the B trial, 15˚C for the S trial, 21˚C for the C trial, 20˚C for the CS trial, and 16˚C for the SN trial). At the beginning of the ase, the initial temperature of the punch was higher than at the beginning of the trial and the temperature in- crease was reduced during the pressing cycle. Thus, we can confirm that the heat exchange at the glass/punch in- terface in the stable phase is less important than at the trial’s beginning, whatever the lubrication conditions. We may assume that the effect of the lubrication on the tem- perature reduction is much higher in the contact zone between the punch and the hot glass, where the tempera- tures are higher. For a pressing alyzed, Figure 11 presents the rank of the lubrication conditions tested in terms of limiting the efficiency of the thermal exchange at the glass/punch interface. This rank is the same as founded by Figure 1. The previous ther- mal analysis based on the GTI trials highlights that ap- plying the initial lubricating paste and the new one leads to the same heat transfer at the glass/punch interface. The elements removed from the chemical composition of the initial lubricating paste in order to define the new one have not affected the capacity of the lubricating paste to limit the heat transfer at the glass/punch interface.The SEM images and the EDS analyses were once again car- ried out for the glass samples produced by the SN trial. For the three series of glass samples produced by the three repetitions of the SN trial, no trace of white spots was detected on the glass sample surfaces. Figure 12 shows the typical traces. T arker proportions are respectively 10.2% and 0.9% for the spot in the square. Their presence highlights again that the lubricating paste is transferred from the punch during the pressing of the hot glass. 5. Conclusions In this study, the TEM Copyright © 2011 SciRes. NJGC  A New Way to Improve Thermal Capacities of Lubricants for the Manufacture of Flint Glass Perfume Bottles: 102 Part B – How to Combine Thermal Analysis and Physico-Chemical Observations at the Glass/Punch Interface Figure 12. SEM image of the new lubricating paste trace nd BCR Center (Mons, Belgium) have proposed a new e- pe experiment to pr the temperature evolutions in the GTI punch, ob glass sam- pl (i. ated by our partner, SO d s were also confirmed by industrial trials on ion, the joint TEMPO and BCRC ex- pe edgements y International Campus on s (dark grey) on the surface of the 20th glass sample pressed during the 1st repetition of the SN trial on the GTI platform. a way to analyze and improve thermal capacities of lubri- cants for manufacturing flint glass perfume bottles, based on the pressing cycles using TEMPO’s GTI platform to reproduce industrial processing conditions and BCR Cen- ter’s physico-chemical analysis using SEM and EDS. Part A presented the procedure to insure GTI trial r atability in terms of the input data (e.g., glass and pun- ch temperature, pressing duration and pressure). The mar- kers of the resin film and the lubricating paste, both de- veloped by our partner, SOGELUB® Special Lubricants Company, were defined by preliminary EDS analyses on the swabbed and coated punches before the GTI trials. The S trial, using a punch swabbed with the lubricating paste, was presented in Part A. Part B uses the joint TEMPO-BCRC esent the analysis of the different lubrication conditions in an industrial context. For this purpose, the trials on the GTI platform were first performed using a bare punch (B trial), a swabbed punch (S trial), a coated punch (C trial) and a coated/swabbed punch, which is first coated by a resin film and then swabbed with the lubricating paste (CS trial). We used tained by the GTI trials under different lubrication con- ditions, to rank the efficiency of the lubrication condi- tions tested. The most efficient punch was the punch coa- ted with the resin film and swabbed with the lubricating paste (CS trial), then the punch coated by the resin film (C trial), and finally the punch swabbed with the lubri- cating paste (S trial), in terms of limiting the punch’s temperature increase or limiting the heat transfer between the hot glass and the punch. We conclude that the trials performed on the GTI platform for the different lubrication conditions showed that the present industrial practice of coating the punch by a resin film and swabbing it with a lubricating paste is appropriate for reducing the heat transfer between the hot glass and the punch. With the SEM/EDS analyses of the pressed es for the different lubrication conditions on the GTI punch, the traces of the lubricants were transferred onto the glass, appearing in tiny spots. Their composition de- pends on the lubrication condition (i.e., resin film in the C and CS trials, lubricating paste in the S and CS trials, both resin film and lubricating paste in the CS trial only). The EDS analyses revealed the existence of a defect e., white points) for the S and CS trials, which is simi- lar to the defects on perfume bottles manufactured on the industrial production lines. This is the most important result of our study because it was not possible to deter- mine the defect cause on these industrial lines, on which pollution sources are numerous. Using the GTI trials for different lubricant conditions and the EDS analysis of the glass samples, we identified the cause of the defect: one lubricating paste element with a percentage in the com- position that is undetectable by the preliminary EDS analysis presented in Part A. During the GTI trial, the lubricating paste transferred from the punch to the glass samples in a detectable element concentration produced a defect similar to a defect that was unacceptable on per- fume bottles in the production line. A new lubricating paste was cre GELUB® Special Lubricants Company. For the SN trial performed on the GTI platform with the punch swabbed with this new paste, there are 2 results: 1) The deviation for the average temperatures measure in the punch between the S and SN trial is lower than 1.2%, and the removal of the offending element did not affect the thermal exchange at the glass/punch interface. 2) The SEM/EDS analysis of the glass samples produced during the three repetitions of the SN trial highlighted that no white points were detected when using the new lubri- cating paste. These result production line. As general conclus riment using the GTI platform and SEM/EDS analysis is an efficient solution to test and improve thermal ca- pacities of lubricants for manufacturing flint glass per- fume bottles. 6. Acknowl This research was supported b Safety and Intermodality in Transportation, the Nord/- Pas-de-Calais Region, the Walloon Region, the European Community, the Regional Delegation for Research and Copyright © 2011 SciRes. NJGC  A New Way to Improve Thermal Capacities of Lubricants for the Manufacture of Flint Glass Perfume Bottles: Part B – How to Combine Thermal Analysis and Physico-Chemical Observations at the Glass/Punch Interface Copyright © 2011 SciRes. NJGC 103 REFERENCES [1] C. J. Fellows atory Investigation J. César de Sa g, “Meas- ling, H. V. Fairbanks and W. A. Koehler, “A Technology, the Ministry of Higher Education and Re- search, the National Center for Scientific Research, and the Verreries Pochet du Courval. The authors gratefully acknowledge the support of these institutions. and F. Shaw, “A Labor , of Glass to Mould Heat Transfer during Pressing,” Glass Technology, Vol. 19, No. 1, 1978, pp. 4-9. [2] P. Moreau, D. Lochegnies, S. Gregoire and “Analysis of Lubrification in Glass Blowing: Heat Trans- fer Measurements and Impact on Forming,” Glass Tech- nology : European Journal of Glass Science and Tech- nology, Part A, Vol. 49, No. 1, 2008, pp. 8-16. [3] D. Höhne, B. Pitschel, M. Merkwitz, R. Löbi urement and Mathematical Modelling of the Heat Trans- fer in the Glass Forming Process, in Consideration of the Heat Transfer Coefficients and Radiation Influences,” Glass Science and Technology, Vol. 76, No. 6, 2003, pp. 309-317. [4] W. C. Dow Study of the Effect of Lubricants on the Adherence of Molten Glass to Heated Metals,” Journal of the American Ceramic Society, Vol. 33, No. 9, 1950, pp. 269-273.. doi:10.1111/j.1151-2916.1950.tb12797.x [5] J. Pech, G. Berthomé, M. Jeymond and N. Eustathopou- los, “Influence of Glass/Mould Interfaces on Sticking,” Glass Science Technology, Vol. 78, No. 2, 2005, pp. 54-62. [6] P. Manns, W. Döll, G. Kleer, “Glass in Contact with Mould Materials for Container Production,” Glastech. Ber Glass Science and Technology, Vol. 68, No. 12, 1995, pp. 389-399. [7] K. D. Fischbach, K. Georgiadis, F. Wang, O. Dambon, F. Klocke, Y. Chen and A.Y. Yi, “Investigation of the Eff- ects of Process Parameters on the Glass-to-Mold Sticking Force during Precision Glass Molding,” Surface and Coatings Technology, Vol. 205, 2010, pp. 312-319. doi:10.1016/j.surfcoat.2010.06.049 [8] D. Rieser, G. Spieß and P. Manns, “Investigations on Glass-to-Mold Sticking in the Hot Forming Process,” Journal of Non-Crystalline Solids, Vol. 354, 2008, pp. 1393-1397. [9] M. Falipou, C. Donnet, “Sticking Temperature Investiga- tions of Glass/Metal contacts—Determination of Influ- encing Parameters,” Glastech. Ber. Glass Science and Technology, Vol. 70, No. 5, 1997, pp. 137-145. [10] G. de Vaucorbeil, “Le Choix des Matériaux pour les Moules de Verrerie,” Verre, Vol. 9, 2003, pp. 38-42. [11] R. Guilbaut, D. Lochegnies, P. Moreau, “In and Outside Vision of Glass Blow and Blow,” in: D. Lochegnies and P. Moreau, Eds., Proceedings of the 2nd International Colloquium Modelling of Glass Forming and Tempering, Valenciennes, France, Presses Universitaires de Valen- ciennes, Valenciennes, 23-25 January, 2002, pp. 57-64.  Current Distortion Evaluation in Traction 4Q Constant Switching Frequency Converters 104 Appendix ata from GTI able A.1 Average output data from the GTI platform and relative standard deviations for the three repetitions of the B trial Repetition Average glass Average temperature Average glass mit Average teme Average tempe Average tempe Average pres ) A. Output d T (bare punch and no lubrication), the C trial (punch c oated with a r esin film), the CS trial (punch c oated with a re sin film and then swabbed with the lubric ating paste). number sample mass (g)of the heating resistance (˚C) teperature at the ex of the furnace (˚C) perature of th ejector n 1 (˚C) erature of th ejector n 2 (˚C) erature of th ejector n 3 (˚C) sing force (N B 1 38.1 (1.4) 1106 (0.2) 972 (2.3) 560 (1.5) 567 (1.6) 575 (2.6) 389 (3.8) B 2 37.9 (1.7) 1115 (0.1) 967 (2.4) 559 (1.5) 567 (1.8) 575 (2.4) 393 (5.0) B 3 38.0 (1.1) 1112 (0.2) 973 (2.0) 560 (1.1) 564 (1.8) 569 (1.9) 393 (5.9) C 1 39.8 (2.0) 1102 (0.1) 971 (1.3) 560 (1.0) 566 (1.2) 574 (1.2) 397 (5.9) C 2 39.2 (0.9) 1101 (0.1) 971 (1.2) 558 (1.4) 563 (1.7) 570 (1.6) 401 (3.1) C 3 38.9 (1.3) 1101 (0.1) 972 (1.2) 558 (1.2) 564 (1.6) 568 (1.7) 385 (2.4) CS 1 38.3 (1.7) 1102 (0.1) 964 (1.2) 559 (1.8) 563 (2.0) 569 (2.1) 407 (7.9) CS 2 37.9 (1.8) 1105 (0.1) 960 (2.3) 558 (1.7) 564 (2.0) 569 (2.0) 402 (4.2) CS 3 37.8 (1.0) 1111 (0.1) 952 (2.5) 555 (1.6) 562 (2.0) 566 (2.1) 396 (5.5) able A.2. Average output data from the GTI platform and relative standard deviation for the B trial (bare punch and no Trial Average glass s Average temperature Average glass mit Average tempe Average temperature Average tempe Average pressing T lubrication), the C trial (punch coate d with a resin film), the CS trial (punch coated with a resin film and then swabbed with the lubricating paste) and the S trial (punch just swabbed with the lubric ating paste – last line Table A.1 in Part A). ample mass (g) of the heating resistance (˚C) teperature at the ex of the furnace (˚C) erature of th ejector n 1 (˚C) of the ejector n 2 (˚C) erature of th ejector n 3 (˚C) force (N) B 38.0 (1.5) 1111 (0.4) 970 (2.3) 560 (1.5) 566 (1.8) 573 (2.5) 392 (4.9) C 39.3 (1.7) 1101 (0.4) 971 (1.1) 559 (1.3) 564 (1.5) 571 (1.6) 394 (4.4) CS 38.0 (1.6) 1106 (0.4) 959 (2.1) 558 (1.7) 563 (2.0) 568 (2.1) 394 (6.1) S 38.2 (2.5) 1102 (0.3) 962 (2.6) 555 (1.9) 560 (2.1) 565 (2.3) 401 (3.6) able A.3 Average output data from the GTI platform and relative standard deviations for the three repetitions of trial SN Repetition Average glass Average temperature Average glass mit Average tempe Average tempe Average tempe Average press- T (punch swabbed w i th the new lubricating paste). number sample mass (g) of the heating resistance (°C) teperature at the ex of the furnace (°C) erature of th ejector n 1 (°C) erature of th ejector n 2 (°C) erature of th ejector n 3 (°C) ing force (N) SN 1 37.8 (1.4) 1115 (0.1) 967 (1.1) 553 (1.3) 560 (1.6) 567 (1.6) 401 (4.1) SN 2 38.0 (1.5) 1116 (0.1) 975 (1.8) 558 (1.2) 564 (1.9) 570 (1.6) 397 (4.2) SN 3 37.9 (0.9) 1111 (0.1) 972 (1.7) 562 (1.2) 564 (1.8) 575 (1.6) 401 (4.5) For the 3 trials 37.9 (1.3) 1114 (0.1) 971 (1.5) 558 (1.3) 563 (1.8) 570 (1.6) 400 (4.3) Copyright © 2011 SciRes. NJGC |