Journal of Water Resource and Protection
Vol. 5 No. 10 (2013) , Article ID: 38715 , 10 pages DOI:10.4236/jwarp.2013.510102
Assessment of Endocrine Disrupting Trace Metals in River Samre at Samreboi in the Wassa Amenfi West District of the Western Region of Ghana
1Department of Ecotourism and Environmental Management, Faculty of Renewable Natural Resources, University for Development Studies, Nyankpala Campus, Tamale, Ghana
2Council for Scientific and Industrial Research, Water Research Institute, Tamale, Ghana
Email: *matthewnkoom@yahoo.com, cobbinasamuel@yahoo.com, kumimichael@yahoo.com
Copyright © 2013 Matthew Nkoom et al. This is an open access article distributed under the Creative Commons Attribution License, which permits unrestricted use, distribution, and reproduction in any medium, provided the original work is properly cited.
Received June 17, 2013; revised July 23, 2013; accepted August 21, 2013
Keywords: Endocrine Disrupting Trace Metal; Samreboi; Non-Cancer; Risk Assessment; Hazard Quotient; Surface Water
ABSTRACT
The rational for the study was to assess the levels of endocrine disrupting trace metals in River Samre. The levels of Mercury ranged from 0.01 to 0.02 mg/l (mean of 0.006 mg/l), whiles cadmium levels ranged from 0.002 to 0.011 mg/l (mean of 0.01 mg/l). The high levels of Hg and Cd may have adverse effects on the endocrine system of inhabitants who drink directly from the river without treatment. High levels of mercury and cadmium might be caused by the activities of a Timber and Plywood Company located close to the river and the underlying bedrocks of the area exposed as a result of human activities such as farming. The concentration of lead was below detection limit (<0.005 mg/l) but that of Arsenic ranged from 0.001 to 0.007 mg/l (mean of 0.005). Health risk assessment conducted shows that the risk associated with exposure to these metals for now are low. Continuous water quality monitoring is recommended to help protect the resource and also to safeguard human health.
1. Introduction
Rivers are the main inland water resources for domestic, industrial and irrigational purposes and often carry large municipal sewage, industrial wastewater discharges and seasonal run-offs from agricultural lands [1]. The problem of water is more a case of distribution and quality than one of quantity. To be wholesome, water must be free from poisonous substances. The possibility of the presence of poisonous substances in water supplies is sometimes unsuspected. Potable water is water of sufficiently high quality that can be consumed or used with low risk of immediate or long term harm.
Pipe borne water is the major source of drinking water for the inhabitants of Samreboi. However, River Samre also serves as the major source of drinking water for places like Tigarikrom, Nyamebekyere, Zongo, and to most farmers at their various farms. An example of children fetching water from the river is shown in Plate 1. River Samre is highly susceptible to pollution from a Timber and Plywood Company located close to the river that uses chemicals to preserve timber logs in a log pond in the company. The waste water from the company as a result of chemicals used in boiling fliched logs are released into log ponds which drain into River Samre.
Also, the major occupation of the indigenes is farming and the farmers apply fertilizers, pesticides, herbicides just to mention a few in their farming activities especially the cocoa farmers. Most of these chemicals eventually find their way into the river from runoff. These activities necessitated this study to ascertain the level of endocrine disrupting trace metals in River Samre, since access to safe drinking water is essential to achieve good health in the population [2].
An endocrine-disrupting chemical is a compound, either natural or synthetic, which through environmental or inappropriate developmental exposures alters the hormonal and homeostatic systems that enable the organism to communicate with and respond to its environment [3]. Endocrine-Disrupting Chemicals (EDCs) released by human from sources such as wastewater effluent, industrial
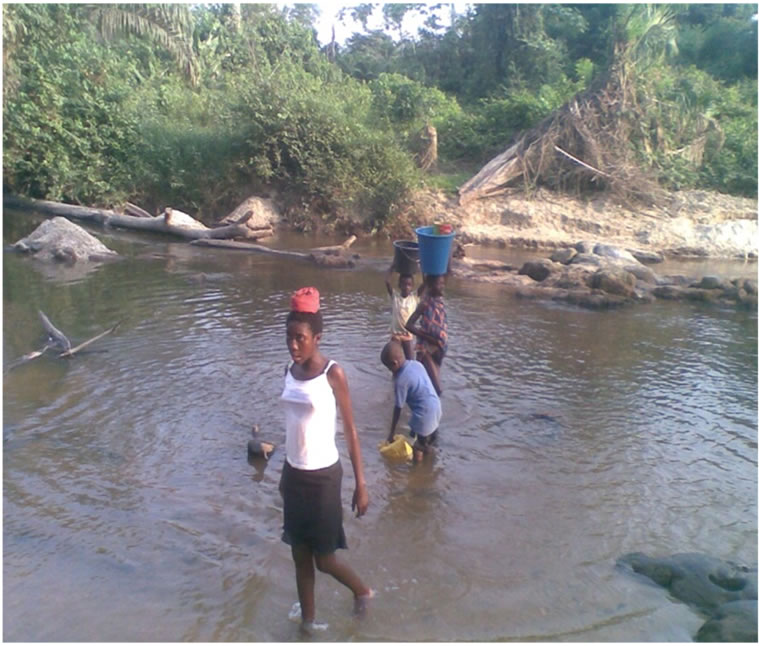
Plate 1. Children fetching water at the upstream.
discharges, landfills, agricultural runoff and livestock yard runoff have become a major concern among the scientific community due to their potential threats to the health of human and wildlife in recent years. Since the normal functions of all organ systems are regulated by endocrine factors, small disturbances in endocrine function, especially during early stages of the life cycle such as development, pregnancy and lactation, could lead to profound and lasting effects [4].
There is growing concern on possible harmful consequences of exposure to xenobiotic compounds that are capable of modulating or disrupting the endocrine system. This concern for endocrine disrupting chemicals is directed at both wildlife and humans [5]. Several expert working groups [6-8] have concluded that there is increasing evidence of adverse effects in human and wildlife reproductive health, and have discussed the hypothesis that chemicals in the environment have caused these endocrine mediated adverse effects. Endocrine disruption needs to be considered in the context of both individual and populations [9]. The importance of population is made clear from epidemiologic studies demonstrating clear evidence for environmental endocrine disruption in humans. Hauser et al. [10], provides a careful discussion of the epidemiologic evidence for a link between exposure to EDCs and male reproductive dysfunction. In addition, populations of wildlife are impacted by endocrine disruption [11]. However, not every individual within a population may be similarly affected [12]. Heavy metals are present in our environment as they are formed during the earth’s birth. Their increased dispersal is a function of their usefulness during our growing dependence on industrial modification and manipulation of our environment [13,14]. This study is the first part of a comprehensive study meant to assess levels of endocrine disrupting chemicals in the Samre River.
2. Materials and Method
2.1. Study Area
The study was carried out at Samreboi in the Wasa Amenfi west district located in the middle part of the western region of Ghana. It is bounded to the west by Sefwi Wiawso and Aowin Suaman district, to the south by Jomoro and Ellembele, to the south-east by Prestea Huni Valley and to the north by Bibiani-AnhwiasoBekwaiand to north-east by Wasa Amenfi East [15].
2.2. Water Sampling and Laboratory Analysis
Sampling was done between October 2011 and March 2012. Three sites namely upstream, midstream and downstream were selected for sampling. A total of thirtysix water samples were collected from the river during the period. Sample bottles were rinsed with deionised water twice before samples were collected. Collected samples were preserved in ice chest at temperature of 4˚C. Samples were taken in separate containers for physicochemical and trace metal analysis respectively. Samples for trace metal analysis were each preserved with 0.5 ml of concentrated nitric acid before transporting to the laboratory for analysis. The samples were analysed for various parameters including electrical conductivity, pH, total dissolved solids, turbidity and trace metals such as mercury (Hg), arsenic (As), cadmium (Cd), manganese (Mn), total iron (Fe), zinc (Zn) copper (Cu) and Lead (Pb). Physical parameters like conductivity and total dissolved solids of the samples were measured using conductivity meter. pH and turbidity were recorded using pH meter and turbidimeter respectively.
2.3. Analysis of Water for Hg, Cd, Pb, Zn, Cu, Fe, Mn and As
For the analysis of Hg, 5 ml of concentrated H2SO4 and 2.5 ml of concentrated HNO3 were added to 100 ml of water sample and thoroughly shaken to get a homogeneous mixture. 15 ml of 5% (w/w) of KMnO4 and 8 mL of 5% (w/w) potassium persulphate were added to the mixture and heated at 95˚C for 2 hours. The mixture was then allowed to cool to room temperature and 6 ml of 12% (w/w) hydroxylamine hydrochloride were added to the resulting solution to reduce the excess permanganate. The digested solution was stored for analysis [16]. In the Hg determination a carrier solution containing 3% (v/v) HCl and a reducing agent 1.1% (m/v) SnCl2 in 3% (v/v) HCl was added to digest sample to generate Hg vapour which was determined by cold vapour using a Shimadzu model AA 6300.
For the determination of Cd, Pb, Zn, Cu, Fe and Mn, 100 ml of acidified water sample were mixed with 5 ml each of conc. HNO3 and conc. H2SO4. The mixture was heated until the mixture was reduced to about 20 ml on a hot plate. The digested samples were cooled to room temperature, filtered through a 0.45-μm Whatman filter paper and the final volume adjusted to 100 ml with double distilled water and stored for analysis [16]. The concentration of Cd, Pb, Zn, Cu, Fe and Mn were determined using flame Atomic Absorption Spectrophotometer (AAS) Shimadzu model AA 6300.
For the determination of As, 5 ml of 0.5 M HCl and 5 ml of 0.5% NaBH4 were added to the digested water samples to reduce all As to arsine gas, in the arsine gas generator. The arsine gas generator was coupled to the flame atomic absorption spectrophotometer, Shimadzu model AA 6300, for the determination of As in the samples.
Recovery and reproducibility studies were conducted during analysis of the water samples to check the sensitivity and efficiency of the method used in the chemical analysis. The percentage of Hg, Cd, Pb, Zn, Cu, Fe, Mn and As recovered in the recovery studies were 97, 94, 98, 96, 98 95 and 100%, respectively. Similar results were recorded for the reproducibility studies.
2.4. Health Risk Assessment Process
This is the process of estimating the health effects that might result from exposure to carcinogenic and non-carcinogenic chemicals [17-19]. In this study, non-carcinogenic health risk refers to harm done to the central nervous and other adverse health effects (except cancer) due to exposure to neurotoxic chemicals such as Hg and Pb. The risk assessment process is made up of four iterative steps namely, hazard identification, exposure assessment, dose-response assessment and risk characterization [19, 20].
2.4.1. Hazard Identification
Hazard identification basically defines the hazard and nature of the harm. This is the first step of the risk assessment process that was used to establish a link between the toxic chemicals identified and their health effects on residents in the study area [21]. In this study, Hg, Cd, and As, were identified as possible hazards in the community when they drink directly from the river without treatment.
2.4.2. Exposure Assessment
Exposure assessment is the process of measuring or estimating the intensity, frequency, and duration of human exposures to an environmental agent. It also helps in estimating the rate of intake of a contaminant by the target organism. In the exposure assessment, the average daily dose (ADD) of Hg, Cd, and As ingested from drinking of River Samre in the study area was calculated using:
 (1)
(1)
where, EPC is exposure point concentration of toxicant in the drinking water (mg/L), IR is the ingestion rate per unit time (L/day), ED is the exposure duration (years), EF is the exposure frequency (days/year), BW is the body weight of receptor (kg) and AT is the averaging time (years) which is equal to the life expectancy of a resident Ghanaian. 365 is the conversion factor from year to days. The ADD is the quantity of Hg, Cd, and As, ingested per kilogram of body weight per day [21-23]. With the exception of EPC and BW, the rest were default values in the Risk Integrated Software for Clean-up (RISC 4.02) developed by the USEPA. Body weights of 13.5 and 58.6 kg were used for resident children and resident adults, respectively in line with Ghana Statistical Service [24]. For dermal contact, average daily dose was calculated using the formula:
 (2)
(2)
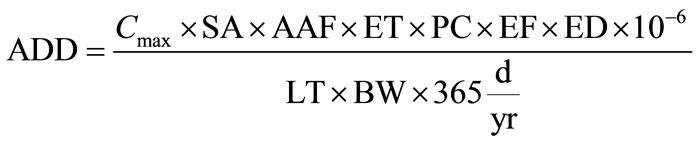
where, Cmax is the maximum 7-year average concentration of chemical in drinking water (mg/L), SA is the total skin surface area (cm3), AAF is the dermal-water chemical specific absorption adjustment factor (mg/mg), ET is the bath or shower duration (h/day), PC is the chemical specific skin permeability constant (cm/h), EF is the exposure frequency (events/years), ED is the exposure duration (years), LT is the lifetime = 70 years by definition and BW is the body weight.
2.4.3. Dose-Response Assessment
Dose-response assessment is basically the quantitative relationship that indicates a contaminants degree of toxicity to exposed species. In this study, oral reference dose values for Hg, As, and Cd, from RISC 4.0 software were used in characterizing non-cancer health risk from exposure to the aforementioned toxic chemicals in the study area [25].
2.4.4. Risk Characterization
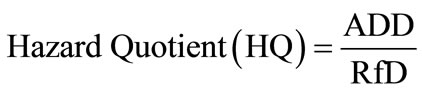
Risk characterization is the final phase of the risk assessment process. In this phase, exposure and dose-response assessments are integrated to yield probabilities of effects occurring in human beings under specific exposure conditions. In line with USEPA risk assessment guideline, the risk characterization process incorporated all the information gathered from hazard identification, exposure assessment and dose-response assessment to evaluate the potential non-cancerous health risk of resident children and adults in the study area from exposure to the toxicants in drinking water [25]. In this study, the extent of the harm incurred was expressed in terms of hazard quotient:
 (3)
(3)
where, ADD is the average daily dose a resident adult or child is exposed to via drinking water or dermal contact with water containing Hg and Cd. RfD is the reference dose which is the daily dosage that enables the exposed individual to sustain level of exposure over a prolonged time period without experiencing any harmful effect.
2.5. Statistical Analysis
Statistical analysis was performed using Statistical package for social sciences (SPSS) version 16.0 software for windows. The Pearson’s rank correlation was used to examine correlation between endocrine disrupting trace metals and some physic-chemical parameters; all tests were two tailed.
3. Result and Discussion
3.1. Physico-Chemical Analysis
Generally, most of the water quality parameters analyzed were within WHO recommended limit for potability (Table 1). The pH ranged from 6.75 to 7.71 with a mean of 7.36. The turbidity levels ranged from 14.3 - 43 NTU with a mean of 23.28 NTU. These levels are higher than recommended levels for drinking water which is 5 NTU [2] with the highest level recorded at the midstream in October and lowest value at the upstream in December. However, the highest level in October may be due to runoff that occurred after the rains in September. The concentration of conductivity ranged from 68.2 to 176.4 mS/cm with a mean of 97.52 mS/cm. Total Dissolved Solids (TDS) ranged from 41 to 105.6 mg/l with a mean of 61.27 mg/l. The least level was recorded in October at the upstream and the highest in January at the downstream. The levels are within the background level lay down for drinking water. The variation in TDS, conduc-
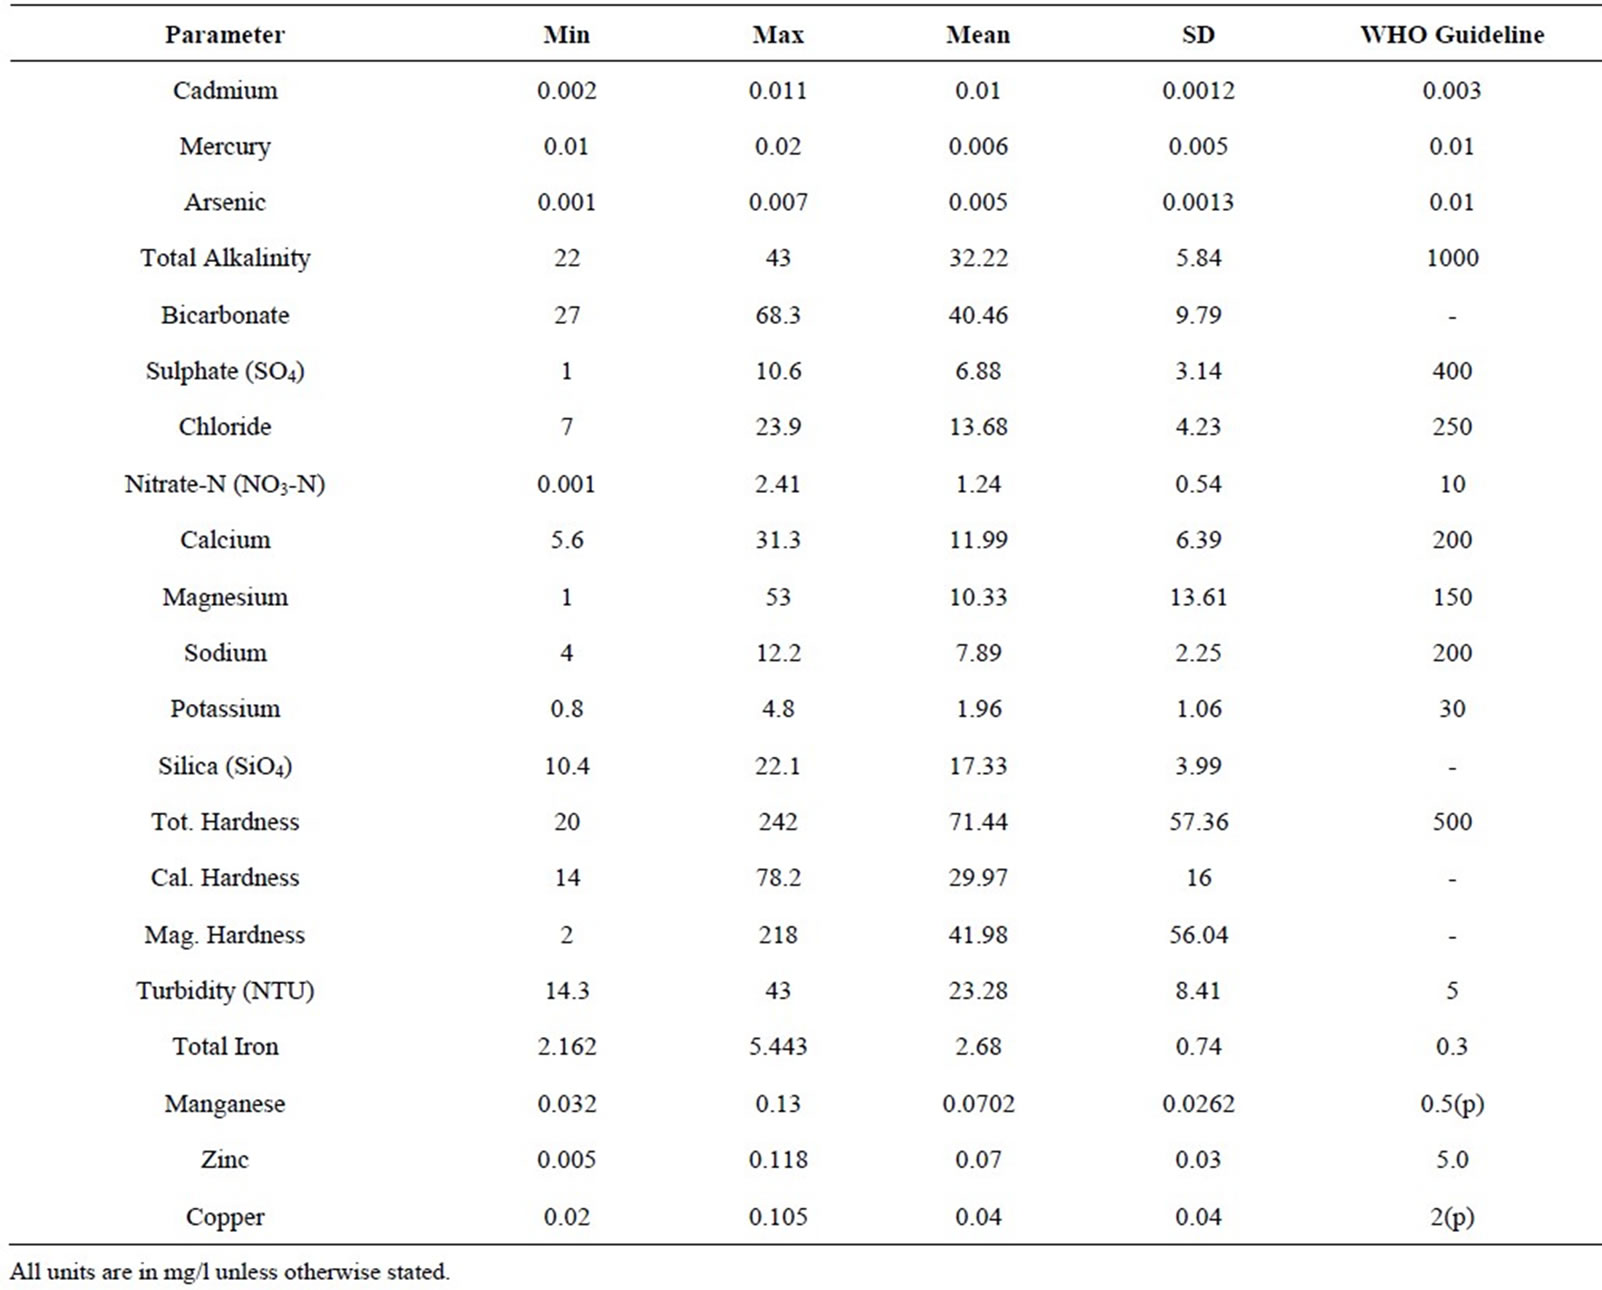
Table 1. Results of trace metal analysis and physico-chemicals.
tivity, and pH and turbidity are shown in Figures 1 and 2 respectively.
The levels of total alkalinity ranged from 22 to 43 mg/l with a mean of 32.22 mg/l. The highest value was recorded in October at the midstream and the least in December at the midstream. The levels are within the recommended levels for drinking water (1000 mg/l) by the [2]. The Sulphate levels ranged from 1 to 10.6 mg/l with a mean of 6.88 mg/l. The highest value was recorded in March at the upstream and the lowest value in January at the midstream and is within the recommended levels for drinking water (400 mg/l). The levels of Bicarbonate ranged from 27 to 68.3 mg/l with a mean of 40.46 mg/l. The highest value of bicarbonate was recorded in October at the upstream and the lowest value was in December at the midstream. The levels of Chloride ranged from 7 to 23.9 mg/l with a mean of 13.68 mg/l. The highest was value recorded in November at the upstream whiles the lowest was in October at the downstream. These levels are within the recommended levels for drinking water (250 mg/l). Figures 3 and 4 show the monthly variation in total alkalinity and bicarbonate, and Sulphate and chloride respectively.
The levels of Nitrate ranged from 0.001 to 2.41 mg/l with a mean of 1.24 mg .The highest value recorded in March at the upstream whiles the lowest in January at the downstream. These levels are within the recommended levels for drinking water which is 10 mg/l [2].
The levels of Calcium ranged from 5.6 to 31.3 mg/l with a mean of 11.99 mg/l. The highest value was recorded in October at the upstream whiles the lowest in February at the same site and is all within the recommended levels for drinking water which is 200 mg/l [2].
The levels of Magnesium ranged from 1 to 53 mg/l with a mean of 10.33 mg/l. The highest value was recorded in March at the upstream whiles the lowest in November at the upstream and downstream. These levels are within the recommended levels for drinking water which is 150 mg/l [2].
The levels of Sodium ranged from 4 to 12.2 mg/l with a mean of 7.89 mg/l. The highest value was recorded in October at the midstream whiles the lowest value in November at the midstream. The levels of Silica ranged from 10.4 to 22.1 mg/l with a mean of 17.33 mg/l. The highest value was recorded in December at the upstream whiles the lowest value in November at the mid-stream.
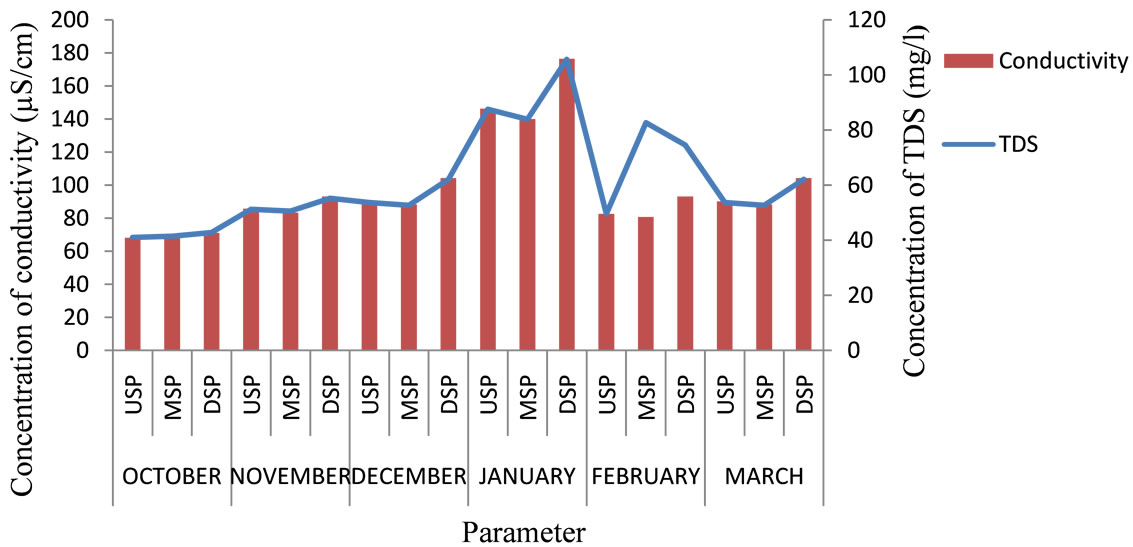
Figure 1. Levels of TDS and conductivity for the six months.

Figure 2. pH and turbidity of River Samre.
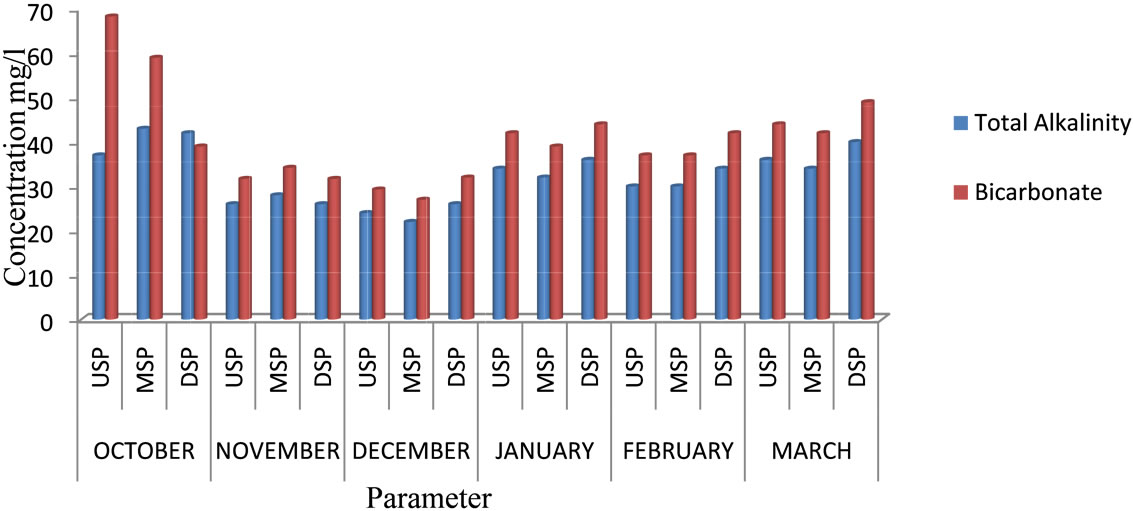
Figure 3. Total alkalinity and bicarbonate of River Samre.
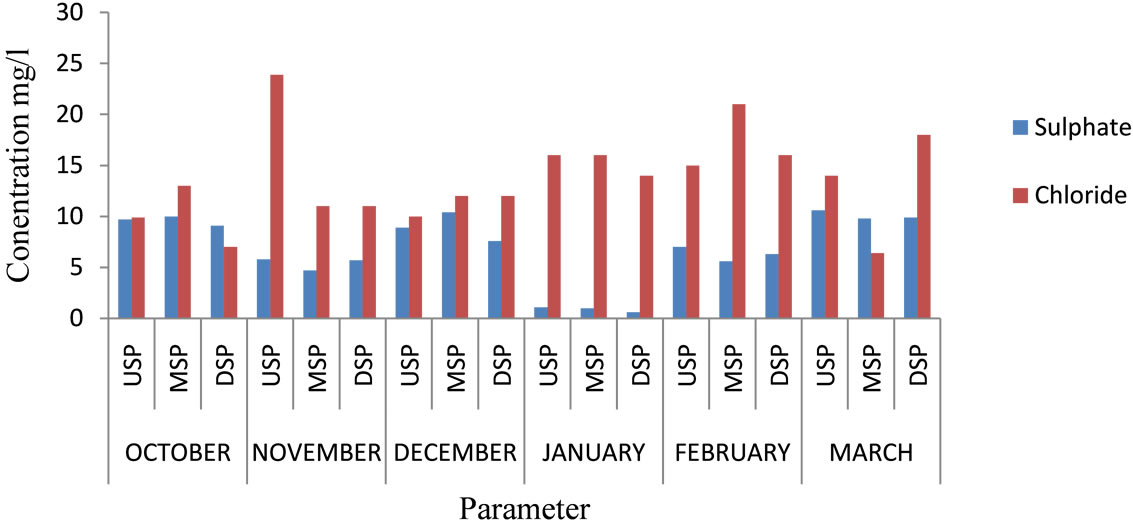
Figure 4. Sulphate and chloride of River Samre.
The variation in Silica and Sodium, are shown in Figure 5.
The levels of Total hardness ranged from 20 to 242 mg/l with a mean of 71.44 mg/l .The highest values were recorded in March at the upstream and midstream whiles the lowest in December at the midstream which are within the recommended levels of 500 mg/l [2].
The levels of Total Iron ranged from 2.162 to 5.443 mg/l with a mean of 2.68 mg/l. However, the higher levels of total iron may be due to runoff and erosion of soils. This may cause staining of laundry, unpleasant appearance and unpleasant taste when used without treatment. The variation in Magnesium hardness, Calcium hardness and Total hardness are shown in Figure 6.
3.2. Endocrine Disrupting Trace Metals
Mercury, cadmium, lead and Arsenic are considered as endocrine disrupting traces metals. The levels of Mercury ranged from 0.01 to 0.02 mg/l with a mean of 0.006 mg/l. The highest level was recorded in January at the upstream and the least in December at the midstream. The mean is within the recommended levels for drinking water which is 0.01 mg/l [2], but other areas recorded higher levels than this standard.
The levels of Cadmium ranged from 0.002 to 0.011 mg/l with a mean of 0.01 mg/l. The highest level was recorded in March at the midstream. The high levels of mercury and cadmium might be caused by the soil and the underling rocks that the river flows through. The concentration of lead was below detection limit of less than 0.005 mg/l but that of Arsenic ranged from 0.001 to 0.007 mg/l with a mean of 0.005 mg/l. The highest arsenic level was recorded in February at the downstream and this might be due to a timber company close to the river using Chromated copper Arsenate to preserve wood in the log pond. This higher level and the mean are higher than the WHO recommended standard of 0.003 for drinking water. The variation in mercury concentrations are shown in Figure 7.
3.3. Hazard Quotients from Exposure to Hg, Cd, and As via Surface Water
The hazard quotients (HQ) through Central tendency exposure (CTE) and Reasonable maximum exposure (RME) to Hg, Cd and As by resident children and adults in the study area were less than 1.0 for surface water in

Figure 5. Silica and sodium of River Samre.

Figure 6. Levels Tot., Cal. and Mag. hardness of River Samre.
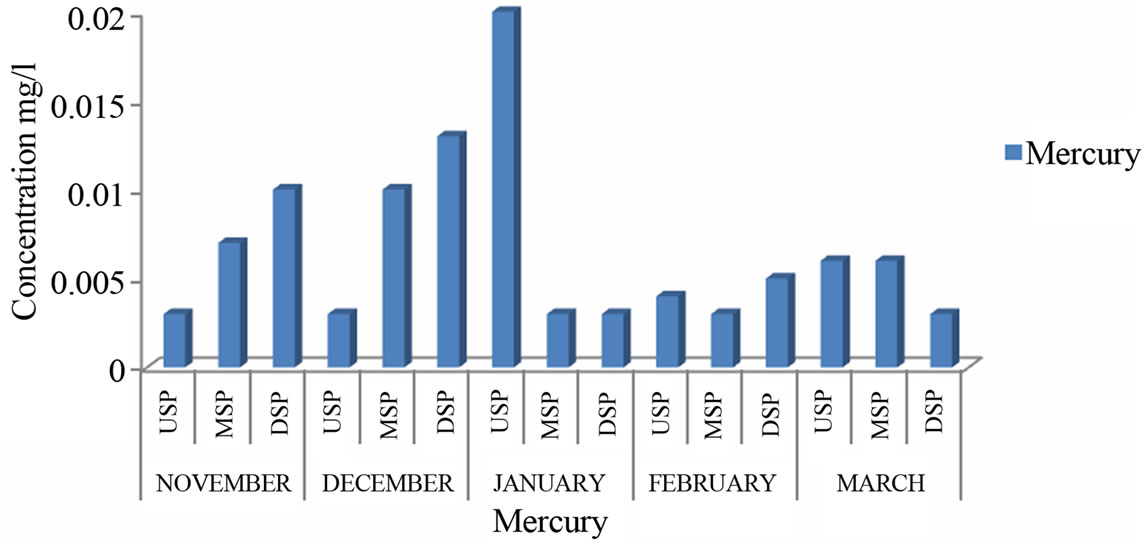
Figure 7. Levels of mercury of River Samre.
the river via oral ingestion and dermal contact (Figure 8). According to USEPA risk assessment guidelines, a hazard quotient greater than 1.0 means that the probability for adverse health effects associated with exposure to such a chemical is high [19,26,27]. Since the hazard quotients through CTE and RME are less than 1.0, the community members who drink directly from the river without treatment may not be at a high risk with exposure to the endocrine disrupting trace metals.
3.4. Correlation Matrix
Correlation analyses show that there were significant differences between the parameters measured within the period of the research which suggests strongly positive relationships between parameters such as Turbidity, Cadmium, Arsenic, Zinc and Manganese as indicated in (Table 2). Turbidity strongly correlated with Cadmium (r = 0.772, p < 0.01), Arsenic also strongly correlated with Manganese (r = 714, p < 0.01) and Turbidity again exhibited positive correlations with Zinc (r = 0.797, p < 0.01). There were also strongly negative relationships between parameters such as Turbidity, pH, Arsenic and Zinc indicating that they do not emanate from the source.
4. Conclusions and Recommendations
The concentrations of turbidity with a mean of 23.28 NTU and that of total iron with a mean of 2.68 mg/l were higher than WHO recommended level of 5 NTU and 0.3 mg/l respectively for drinking water making the river unsafe for drinking purposes unless treated.
The levels of Cadmium with a mean of 0.01 mg/l and mercury with a mean of 0.006 mg/l were higher than the WHO recommended levels of 0.003 mg/l and 0.01mg/l respectively and may disrupt the endocrine system of consumers who used it without treatment.
Based on the findings of this study, it is recommended that there should be periodic monitoring of the levels of the endocrine disrupting trace metals in River Samre.
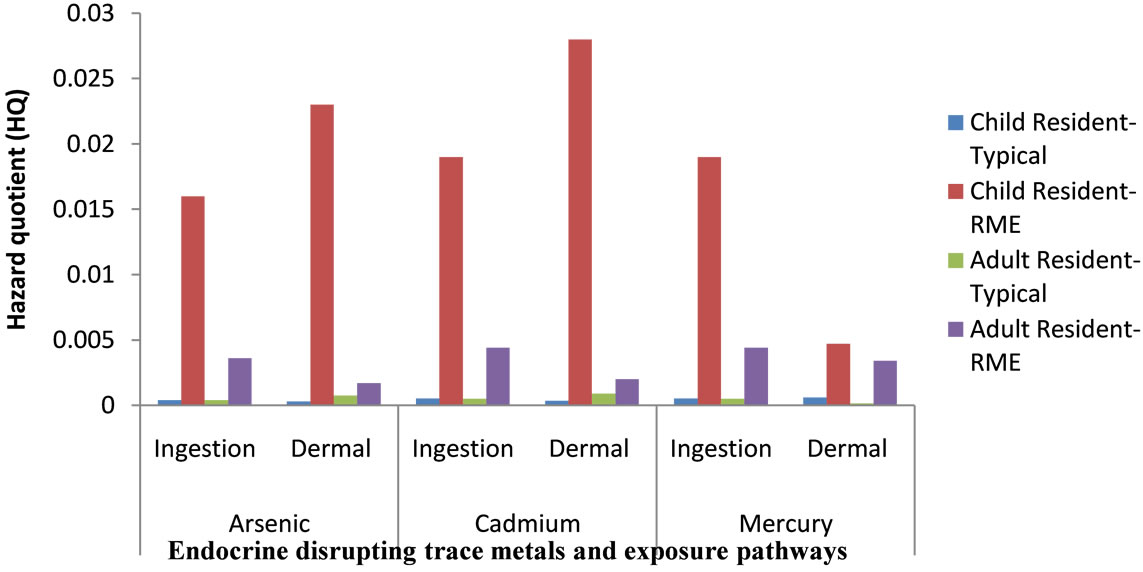
Figure 8. Hazard quotient (HQ) for exposures to endocrine disrupting trace metals by resident children and adults in the river.

Table 2. Correlation analysis showing the differences between the parameters measured within the six months.
Also further research should be carried out in River Samre on other endocrine disrupting chemicals.
5. Acknowledgements
The authors are very grateful to the staff of CSIR Water Research Institute Tamale, especially Millicent E. AduBoakye for the analysis of the samples.
REFERENCES
- U. K. Pradhan, P. V. Shirodkar and B. K. Shahu, “Physicochemical Characteristic of the Coastal Water off Devi Estuary, Orissa and Evaluation of Its Seasonal Changes Using Chemometric Techniques,” Current Science, Vol. 96, No. 9, 2009, pp. 1203-1209.
- World Health Organization, “Guidelines for DrinkingWater Quality [Electronic Resource]: Incorporating First Addendum,” 3rd Edition, 2006.
- E. Diamanti-Kandarakis, L. J.-P. Bourguignon, C. Giudice, R. Hauser, S. Gail, A. M. Prins, R. Soto, T. Zoeller and A. C. Gore, “Endocrine-Disrupting Chemicals: An Endocrine Society Scientific Statement,” Endocrine Reviews, Vol. 30, No. 4, 2009, pp. 293-242. http://dx.doi.org/10.1210/er.2009-0002
- R. J. Kavlock, G. P. Daston and C. DeRosa, “Research Needs for Risk Assessment of the Usepa-Sponsored Workshop,” Environmental Health Perspectives, Vol. 104, Supplement 4, 1996, pp. 715-740.
- R. M. Sharpe and N. E. Skakkebaek, “Are Oestrogens Involved in Falling Sperm Counts and Disorders of the Male Reproductive Tract?” Lancet, Vol. 341, No. 8857, 1993, pp. 1392-1396. http://dx.doi.org/10.1016/0140-6736(93)90953-E
- P. T. C. Harrison, C. D. N. Humfrey, M. Litchfield, D. Peakall and L. K. Shuker, “IEH Assessment on Environmental Oestrogens: Conseqiuences to Human Health and Wildlife,” Medical Research Council, Institute for Environment and Health, Page Bros, Norwich, 1995, 107 pp.
- J. Toppari, J. C. Larsen, P. Christiansen, A. Giwercman, P. Grandjean, L. J. Guillette, B. Jegou, T. K. Jensen, P. Jouannet, N. Keiding, H. Leffers, J. A. McLachlan, O. Meyer, E. Müller, D. Rajpert, E. Meyts, T. Scheike, R. Sharpe, J. Sumpter and N. Skakkebaek, “Male Reproductive Health and Environmental Chemicals with Estrogenic Effects,” Danish Environmental Protection Agency, Copenhagen, 1995, 166 p.
- Proceedings of European Workshop on the Impact of Endocrine Disrupters on Human Health and Wildlife, Weybridge, 2-4 December 1996.
- D. Crews and J. A. McLachlan, “Epigenetics, Evolution, Endocrine Disruption, Health, and Disease,” Endocrinology, Vol. 147, No. 6, 2006, pp. S4-S10. http://dx.doi.org/10.1210/en.2005-1122
- R. Hauser, J. S. Barthold and J. D. Meeker, “Epidemiologic Evidence on the Relationship between Environmental Endocrine Disruptors and Male Reproductive and Developmental Health,” In: A. C. Gore, Ed., EndocrineDisrupting Chemicals: From Basic Research to Clinical Practice, Humana Press, Totowa, 2007. http://dx.doi.org/10.1007/1-59745-107-X_10
- S. M. Zala and D. J. Penn, “Abnormal Behaviours Induced by Chemical Pollution: A Review of the Evidence and New Challenges,” Animal Behaviour, Vol. 68, No. 4, 2004, pp. 649-664. http://dx.doi.org/10.1016/j.anbehav.2004.01.005
- D. Crews, E. Willingham and J. K. Skipper, “Endocrine Disruptors: Present Issues, Future Directions,” The Quarterly Review of Biology, Vol. 75, No. 3, 2000, pp. 243- 260. http://dx.doi.org/10.1086/393498
- L. Jarup, “Hazards of Heavy Metal Contamination,” British Medical Bulletin, Vol. 68, No. 1, 2003, pp. 167-182. http://dx.doi.org/10.1093/bmb/ldg032
- T. Colborn, F. S. Vomsaal and A. M. Soto, “Developmental Effects of Endocrine-Disrupting Chemicals in Wildlife and Humans,” Environmental Health Perspectives, Vol. 101, No. 5, 1993, pp. 378-384. http://dx.doi.org/10.1289/ehp.93101378
- “Annual Action Plan,” Wasa Amenfi West District Asembly Profile, 2009.
- “Standard Methods for the Examination of Water and Wastewater,” 20th Edition, American Public Health Association, Washington, 1998.
- S. Obiri, “Determination of Heavy Metal in Water from Boreholes in Dumasi in the Wassa West District of Western Region of Republic of Ghana,” Environmental Monitoring and Assessment, Vol. 130, No. 1-3, 2007, pp. 455- 463. http://dx.doi.org/10.1007/s10661-006-9435-y
- J. F. Artiola, I. L. Pepper and M. L. Brusseau, “Environmental Monitoring and Characterization,” Academic Press, Waltham, 2004, 410 p.
- US Environmental Protection Agency, “Integrated Risk Information System (IRIS),” National Centre for Environmental Assessment, Office of Research and Development, Washington, 2001.
- D. K. Asante-Duah, “Managing Contaminated Sites: Problem Diagnosis and Development of Site Restoration,” Wiley & Sons, Chichester, 1996, 254 p.
- S. Obiri, D. K. Dodoo, D. K. Essumang and F. A. Armah, “Cancer and Non-Cancer Risk Assessment from Exposure to Arsenic, Copper, and Cadmium in Borehole, Tap, and Surface Water in the Obuasi Municipality, Ghana,” Human and Ecological Risk Assessment, Vol. 16, No. 3, 2010, pp. 651-665. http://dx.doi.org/10.1080/10807031003788907
- D. K. Asante-Duah, “Public Health Risk Assessment for Human Exposure to Chemicals,” Kluwer Academic Publishers, Dordrecht, 2002. http://dx.doi.org/10.1007/978-94-010-0481-7
- R. V. Kollunu, S. M. Bartell, R. M. Piebald and R. S. Stricoff, “Risk Assessment and Management Handbook,” McGraw-Hill, New York, 1996.
- Ghana Statistical Service, “2000 Population and Housing Census, Summary Report of Final Results,” Ghana Statistical Service, Accra, 2002.
- US Environmental Protection Agency, “Child-Specific Exposure Factors Handbook. General Factors,” Office of Research and Development, Washington, 2008.
- US Environmental Protection Agency, “Risk Assessment Guideline for Superfund (RAGS): Vol. 1—Human Health Evaluation Manual (Part A),” EPA-540/1-89-002, 1989.
- “Mercury Study Report to Congress,” US Environmental Protection Agency, Washington, 1997.
NOTES
*Corresponding author.