Journal of Water Resource and Protection
Vol. 3 No. 4 (2011) , Article ID: 4445 , 6 pages DOI:10.4236/jwarp.2011.34033
Seasonal Variations of Some Ecological Parameters in Tigris River Water at Baghdad Region, Iraq
Department of Biology, College of Science, University of Baghdad, Baghdad, Iraq
E-mail: adelmashaan@yahoo.com, baha782004@yahoo.co.uk
Received February 12, 2011; revised March 10, 2011; accepted March 31, 2011
Keywords: Ecological Parameters, Fecal Ccoliform, Tigris River, Water Pollution
ABSTRACT
This study aimed at using nine ecological parameters in evaluating the quality of the Tigris River for public usage, by choosing five sampling sites along the river in Baghdad area. These parameters included temperature, pH, the saturated ratio by dissolved oxygen (%sat), biological oxygen demand (BOD5), nitrate ( ), phosphate (
 ), fecal coliform (FC) turbidity and total dissolved solids (TDS), and these parameters were used for calculating overall water quality index in the Tigris River at study area. The results showed high values of turbidity and TDS, as well as high count of FC in all study stations, while other studied parameters were within permissible limit defined by world health organization and Iraqi criteria. The results of the overall water quality index indicated that the Tigris River was in class medium, therefore the Tigris River water in study area is relatively not safe for direct domestic use in all seasons.
1. Introduction
Water is an essential requirement of human and industrial developments and it is the most delicate part of the environment [1]. “Water quality deals with the physical, chemical and biological characteristics in relation to all other hydrological properties” [2]. “A continuous monitoring of water quality is very essential to determine the state of pollution in our rivers, and water quality index (WQI), in common with many other indices system, relates to a group of water quality parameters to a common scale and combines them into single number in accordance with a chosen method or model of computation”[3-5]. The index presented here is a unit less number ranging from 1 to 100. A higher number is indicative of better water quality.
2. Materials and Methods
2.1. Study Sites
The Tigris River is one of the largest rivers of the Middle East stretching for over 1 900 km, of which 1415 km are within Iraq, with a catchment area of 235000 km2, sharing with Euphrates River as the main sources for man use, especially for drinking water since they pass the major cities in the country [6]. In the present study five sites were chosen on the Tigris River to cover Baghdad area (Figure 1), these were, site 1 (Al-Tarmiyahm) located north of Baghdad, site 2 (Al-Utafiah) and site 3 (Al-Jadiriah) located middle of Baghadad area, while site 4 (Al-Rasheed) and site 5 (Al-Zafaraniah) located south of Baghdad.
2.2. Samples Collection and Procedures
Seasonally water samples were collected from selected five sites in Tigris River from February to October 2009, respective in winter (February), spring (May), summer (August) and autumn (October). The samples were collected from just under water surface for analysis of selected parameters included: temperature, pH, the saturated ratio by dissolved oxygen (%sat), biological oxygen demand (BOD5), nitrate ( ), phosphate (
 ), fecal coliform (FC), turbidity and total dissolved solids (TDS). Temperature, pH and total dissolved solids were determined in the field with portable Multimeter HANNA Model (HI 9811-5), while other examinations were done according to standard specifications presented by the American public health association [7], except turbidity by using Turbidimeter TN-100.
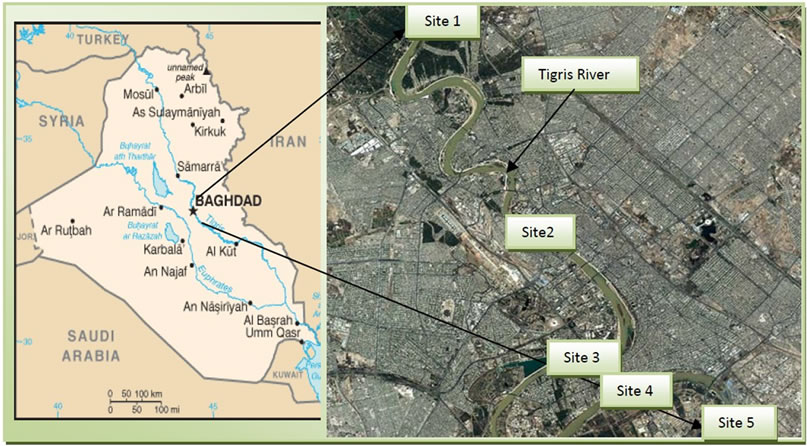
Figure 1. Map of Iraq showing the sample sites on Tigris River.
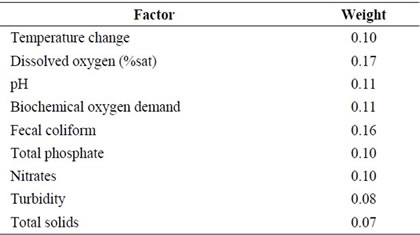
Table 1. Water quality factors and weights used in this study.
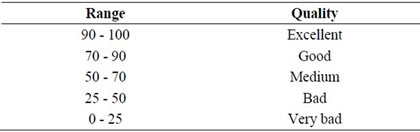
Table 2. Water quality classification based on WQI value.
2.3. The Evaluation of Tigris Water
Present study was designed firstly to monitor seasonal variation in water quality parameters in Tigris river and secondly to calculate overall water quality index (WQI) for evaluate Tigris river water in study area by using same studied parameters. The water quality index concept is based on the comparison of the water quality parameters with respective regulatory standards [8].
The development process of a water quality index can be generalized in four steps:
1) Selecting the set of water quality variables of concern - parameter selection
2) Transformation of the different units and dimensions of water quality variables to a common scale - developing sub-indices.
3) Weighing of the water quality variables based on their relative importance to overall water quality - assignment of weights.
4) Formulation of overall water quality index-aggregation of sub-indices to produce an overall index [9].
The WQI was calculated by summing up individual quality rating (qi) and weighing these parameters in total quality evaluation (wi) as shown in following equation:
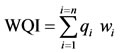
where:
qi = water quality score of parameter i (calculated from special calculator found in Center for Environmental Quality).
wi = weight factor of parameter i (Table 1).
i and n= number of parameters [9].
The 100 point index can be divided into several ranges corresponding to the general descriptive terms shown in the Table 2.
3. Results and Discussion
3.1. Physico-chemical and Biological Parameters
3.1.1. Temperature
Temperature during the sampling of different seasons was found to vary from 11℃ to 26℃ (Table 3). The overall

Table 3. The range, average and standard deviation for recorded parameters in studied sites.

Table 4. The overall water quality index for Tigris River in winter.

Table 5. The overall water quality index for Tigris River in spring.

Table 6. The overall water quality index for Tigris River in summer.
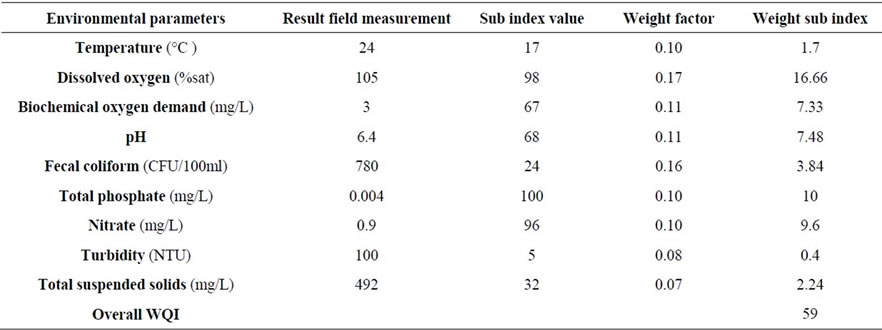
Table 7. The overall water quality index for Tigris River in autumn.
range in water temperature was minimum in winter (Table 4) and maximum in summer (Table 6), seemingly these values followed almost identical seasonal cycles.
3.1.2. pH
The pH of the aquatic systems is an important indicator of the water quality and the extent pollution in the watershed areas [10]. The variations of pH among the seasonal samples of the Tigris River were statistically insignificant at the 5% level. The pH for the water samples varied between 6.2 - 8.3 (Table 3) and these values ranged from a minimum average in autumn to a maximum average in summer (Table 6 and Table 7). The generally higher values of the pH could be due to the release of acid-forming substances such as sulphate, phosphate, nitrates, etc. into the water [11]. The pH was relatively lower in autumn, which was the peak of the dry season, when the water level as well as the flow rate was very low. The pH of the water under study in both seasons was within the WHO standard of 6.50 - 8.50. However, the pH concentration in the study area was within allowable limits for surface water [12].
3.1.3. Saturated Oxygen Ratio
The variations of saturated oxygen ratio (%sat) along the course of the river were statistically significant at the 5% level. These values ranged from a minimum of 73% in summer to a maximum of 105 % in winter (Tables 4, 6). According to the USDA [13], the level of oxygen depletion depended primarily on the amount of added waste, the size, velocity and turbulence of the stream, the initial DO level in the water and in the stream, and the temperature of the water.
3.1.4. Biochemical Oxygen Demand
Values of biochemical oxygen demand varied between 0.9 - 4.4 mg/L (Table 3). The high BOD5 value in summer (Table 6) may be due to discharge of organic wastes (e.g. refuse, human and animal excreta, soap, etc.) into the water, resulting in the uptake of oxygen in the oxidative breakdown of these wastes [11]. It is obvious that the BOD5 concentration decreases gradually during the river passage downstream of the river. This phenomenon can be attributed to the natural self-purification of the river and the lack of outfalls along this stretch.
3.1.5. Nitrate
The variations of nitrate among the sampling seasons were statistically significant at the 5% level. Nitrate values fluctuated between 0.1 - 3.9 mg/L in all study sites (Table 3), with high average recorded in winter (Table 4). The high levels of nitrate recorded in winter might have been because of surface run-off from agricultural activities into the river from the rains. All the nitrate values were within the “no effect” range of 0 mg/L - 6 mg/L for drinking water use [14]. This indicates that no adverse health effects were expected during the sampling months.
3.1.6. Phosphate
The phosphate values obtained is within the tolerable limits. The total phosphate concentrations in study period varied between 0.001 - 0.30 mg/L (Table 3), with recorded high values in winter (Table 4), which suggest that phosphorus is rarely found in high concentrations in waters as it is actively taken up by plants. High concentrations of phosphates can indicate the presence of pollution and are largely responsible for eutrophic conditions [12]. The phosphate levels increased during winter due to agricultural runoff containing phosphate fertilizers as well as waste water containing detergents.
3.1.7. Fecal Coliform
Fecal coliform have been shown to represent 93% - 99% of coliform bacteria in faeces from humans, poultry, cats, dogs and rodents [14]. Fecal coliform counts ranged from a minimum of 200 CFU/100 ml in spring (Table 5) to a maximum of 1 320 CFU/100 ml in winter (Table 4). The variations among the sampling seasons were statistically significant at the 5% level. The high counts in winter can be attributed to suitable environmental conditions for bacteria growth in this season [15], and also returned to domestic waste waters and indiscriminate defecation along the river banks by both humans and other animals that graze along the river banks. The major sources of coliform bacteria in this stretch of the Tigris include runoff discharge, agricultural return flow, swimming and animal bathing and excrements [16]. However, the downstream counts in spring were lower than other seasons. This can be attributed to the increased flow rates in that season as most of the tributaries started discharging into the river. The counts of fecal coliform in almost all occasions of sampling indicate significant and increasing risk of infectious diseases transmission [14].
3.1.8. Turidity
The variations of turbidity among the sampling months were statistically significant at the 5% level. Turbidity values ranged from a minimum of 4 NTU in summer (Table 6) to a maximum of 102 NTU in winter as average (Table 4). Winter recorded the highest values, this could be attributed to presence of organic matter pollution, other effluents, run-off with a high suspended matter content and heavy rain fall. The lower values recorded in summer can be that, at that time, all the tributaries had dried up, thus, reducing the influx of suspended matter.
3.1.9. Total Dissolved Solids
Total dissolved solids varied between 350 - 723 mg/L in all study sites, and ranged from a minimum of 462 mg/L in autumn (Table 7) to a maximum of 962 mg/L in winter (Table 4) as average. The high dissolved solids recorded in winter could be because of domestic effluent discharges and surface run-off from the cultivated fields which might have increased the concentration of ions. The observed high concentration of dissolved solids in the surface water is a pointer to the fact that there are intense anthropogenic activities along the course of the river and run-off with high suspended matter content [17]. The variations of total dissolved solids among the sampling seasons were statistically significant at the 5% level.
3.2. Overall Water Quality Index
Water quality index (WQI) was used to assess water quality relative to the standard for domestic use and to provide insight into the degree to which water quality is affected by human activity [11].
Calculation of overall quality indexes for all seasons is given in Table 4, 5, 6 and 7 respectively. The highest value of WQI for the Tigris River reached to 66.4 in spring (Table 5), while the lowest value of WQI reached to 59 was recorded in autumn (Table 7). The values of WQI indicates that water quality in the Tigris River was in class Medium (Table 2) in all seasons. In general, all of studied sites showed high numbers of fecal coliform, high values of turbidity and presence of dissolved salts and that reflected in the values of their WQI. This could be attributed to improper disposal of wastes, large quantity of agricultural and urban run-off, sewage, over application of inorganic fertilizer, improper operation and maintenance of septic system [12,17]. The previous values of WQI refer to possible decline of environmental properties for Tigris River in study area. A small difference between values of WQI in different seasons could be attributed to discharge of pollutants to a water resource system from domestic sewers, water discharges, industrial wastes discharges, agricultural runoff and other sources, which can have significant effects of both short term and long term duration on the quality of a river system [18]. However, the ecological parameters and the WQI calculated in this paper give us some idea of the overall pollution of the Tigris River. We can conclude from this that the Tigris River water was slightly polluted in study area, therefore this water is not suitable for direct public usage at all the seasons, in view of the high counts of both fecal coliform and turbidity. Besides, all the other water quality parameters were within the limits set out by the Iraqi [19] and world health organization standards for drinking water. Overall, we need fast measures to avoid further deterioration of the river water quality and we need correct treatment for Tigris water to supply health drinking water for Baghdad population.
REFERENCES
- J. Das and B. C. Acharya, “Hydrology and Assessment of Lotic Water Quality in Cuttack City, India,” Water, Air and Soil Pollution, Vol. 150, 2003, pp. 163-175 doi:10.1023/A:1026193514875
- P. U. Atulegwu and J. D. Njoku, “The Impact of Biocides on the Water Quality,” International Research Journal Engineering Science Technology, 2004, Vol. 1, pp. 47-52.
- Anonymous, “Water Analysis Hand Book,” 3rd Edition, Hach Company, USA, 1997.
- S. L. Dwivedi and V. Pathak, “A Preliminary Assignment of Water Quality Index to Andakini River, Chitrakoot,” Indian Journal of Environtal Protection, Vol. 27, No. 11, 2007, pp. 1036-1038.
- D. Couillard and Y. Lefebvre, “Analysis of Water Quality Indices,” Journal of Environmental Management, Vol. 21, 1985, pp. 161-179.
- J. Rzoska, “Euphrates and Tigris, Mesopotamia Ecology and Destiny,” The Hague, Boston, London, p. 122, 1980.
- APHA (American Public Health Association), “Standard Methods for the Examination of Water and Wastewater,” 20th edition, Washington, DC, 1998.
- F. Khan, T. Husain and A. Lumb, “Water Quality Evaluation and Trend Analysis in Selected Watersheds of the Atlantic Region of Canada,” Environment Monitoring Assessment, Vol. 88, 2003, pp. 221-242. doi:10.1023/A:1025573108513
- M. Nasirian, “A New Water Quality Index for Environmental Contamination Contributed by Mineral Processing: A Case Study of Amang (Tin Tailing) Processing Activity,” Journal of Applied Sciences, Vol. 7, No. 20, 2007, pp. 2977-2987.
- J. Yisa and T. Jimoh, “Analytical Studies on Water Quality Index of River Landzu,” American Journal of Applied Sciences, Vol. 7, No. 4, 2010, pp. 453-458. doi:10.3844/ajassp.2010.453.458
- A. B. Abdul-Razak, R. E. M. Asiedu, and K. A. A. deGraft-Johnson, “Assessment of the Water Quality of the Oti River in Ghana,” West African Journal of Applied Ecology, Vol. 15, 2009.
- WHO (World Health Organization), “Guidelines for Drinking Water Quality,” 2nd Edition, Geneva, 1998.
- USDA (United States Department of Agriculture), “Agricultural Waste Management Building Design Handbook,” Soil Conservation Service, Washington, DC, 1992.
- WRC (Water Resources Commission), “Ghana Raw Water Criteria and Guidelines,” Domestic Water, Vol. 1, CSIR-Water Research Institute, Ghana, 2003.
- Y. F. Al-Fatlawy, “Study the Drinking Water Quality of Some Baghdad Drinking Water Treatment Stations,” Ph.D. College of Science, Baghdad University, 2007.
- R. B Banks, “Distribution of BOD and DO in Rivers and Lakes,” Environmental Engineering, Vol. 102 (EE 2), 1976, pp. 265-280.
- UNESCO/WHO/UNEP, “Water Quality Assessment-A Guide to Use Biota, Sediment and Water in Environmental Monitoring,” 2nd Edition, 2001, pp. 10-14.
- R. W. Crabtree, I. D. Cluckie and C. F. Forster, “A Comparison of Two Quality Models,” Water Reserch, 1986, pp. 53-61.
- S. A. Abawi and M. S. Hassan, “Environmental Engineering, Water Analysis,” University of Mosel (In Arabic), 1990.