Journal of Water Resource and Protection
Vol. 2 No. 10 (2010) , Article ID: 2969 , 9 pages DOI:10.4236/jwarp.2010.210107
Adsorption of Methyl Orange onto Chitosan from Aqueous Solution
1Department of Chemistry, Jahangirnagar University, Savar, Bangladesh
2Faculty of Pharmaceutical Sciences, Kobe Gakuin University, Chuo-ku, Japan
E-mail: tksaha_ju@yahoo.com
Received August 8, 2010; revised September 7, 2010; accepted September 17, 2010
Keywords: Adsorption, Kinetics, Chitosan, Anionic Dyes, Wastewater
ABSTRACT
Chitosan was utilized as adsorbent to remove methyl orange (MO) from aqueous solution by adsorption. Batch experiments were conducted to study the effects of pH, initial concentration of adsorbate and temperature on dye adsorption. The kinetic data obtained from different batch experiments were analyzed using both pseudo first-order and pseudo second-order equations. The equilibrium adsorption data were analyzed by using the Freundlich and Langmuir models. The best results were achieved with the pseudo second-order kinetic model and with the Langmuir isotherm equilibrium model. The equilibrium adsorption capacity (qe) increases with increasing the initial concentration of dye and with decreasing pH. The values of qe were found to be slightly increased with increasing solution temperatures. The activation energy (Ea) of sorption kinetics was found to be 10.41 kJ/mol. Thermodynamic parameters such as change in free energy (DG), enthalpy (DH) and entropy (DS) were also discussed.
1. Introduction
With economic and technological development, water pollution is a common problem in worldwide. Water pollution has become more and more serious, especially regarding dye ions. Dye ions; mainly from dyeing industries have become serious threats to human beings and the aquatic ecosystem, due to their toxicity and persistence after being released into the natural water [1,2]. Therefore, discharge regulations are progressively becoming more stringent. Many recent studies have been focused on the development of efficient processes for the recovery of these organic contaminants from the effluents of textile industries [3-5]. Usually conventional techniques such as precipitation, coagulation and flocculation have been used in wastewater treatment although these techniques are not very efficient for removing several common dyes, especially from dilute solutions [3]. Photo-oxidation has also been proposed for the treatment of dye-containing effluents [4,5], however, this process is relatively expensive and not appropriate for the treatment of large flows. More recently, biological degradation has been cited as an alternative process for the decolorization of the reactive dye [6]. On the other hand, adsorption processes remain the most common useful techniques for the decontamination of the effluents of textile and dyeing industries. Many studies have been made on the possibility of adsorbents using mineral sorbents [7], activated carbons [8-10], peat [11,12], chitin [13-16], rice husk [17], soy meal hull [18] and agro wastes [19-21]. However, the adsorption capacity of the adsorbents is not very effective; to improve adsorption performance new adsorbents are still under development.
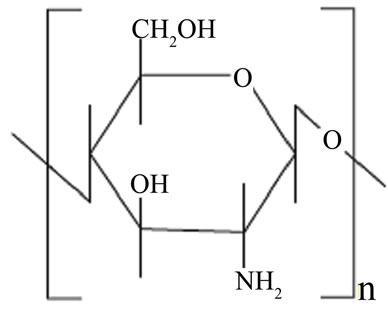
It is well known that chitosan (Figure 1(a)) has widely been used in the preparation of various biomedical products [22-24]. Chitosan is easily prepared from chitin by deacetylating its acetoamide groups with a strong alkaline solution. This is the most abundant biopolymer in nature after cellulose. The high proportions of amino functions in chitosan have been found to provide novel adsorption properties for many metal ions [25-27] and organic dyes [28-36]. The deacetylated amino groups in chitosan can be protonated and the polycationic properties of the polymer are expected to contribute to the charged interactions with a model dye, methyl orange (MO), which is an anionic azo dye (Figure 1(b)).
 (a)
(a)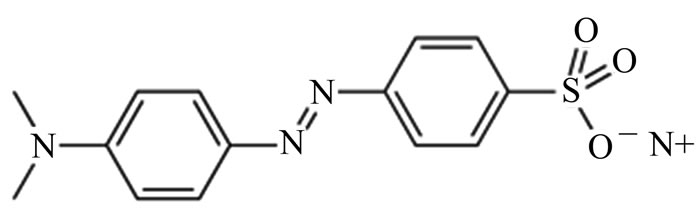 (b)
(b)
Figure 1. (a) The structures of chitosan 10B; (b) methyl orange (MO).
In this study, chitosan 10B (100% deacetylated) was used as an adsorbent to remove dye MO from aqueous solution. The investigation for dye removal was carried out through a series of batch adsorption experiments. The attention has been placed in an understanding of the kinetics; mechanisms and equilibrium processes involved in adsorption of MO onto the chitosan 10B. Treatment of the chitosan surface with a cross-linking agent was not utilized in this study since cross-linking may change the properties of chitosan. The effects of pH, initial concentration of MO and temperatures on the adsorption phenomena have been studied.
2. Materials and Methods
2.1. Chemicals and Preliminary Characterization of the Chitosan Sample
Chitosan 10B (100% deacetylated, Katokichi Bio Co., Ltd., Japan) was used without further purification. The mass median diameters of the chitosan flakes were estimated to be (228 ± 5) mm using a laser scattering particle size analyzer (LDSA-2400A, Tonichi Computer Applications, Japan) equipped with a dry dispersing apparatus (PD-10S, Tonichi Computer Applications, Japan).
The dye methyl orange (MO) was from Acros Organics (New Jersey, USA) and was used without further purification. The chemical structure of MO is shown in Figure 1(b). The other reagents used in this study were of pure analytical grade. Deionized water was prepared by passing distilled water through a deionizing column (Barnstead, Syboron Corporation, Boston, USA).
2.2. Batch Adsorption Experiments
Batch adsorption experiments of MO were carried out in a 122 mL stoppered bottle at a constant temperature (33 ± 0.2°C) using a shaking thermostat machine at a speed of 120 r/min. The effect of pH on the adsorption of MO was examined by mixing 0.05 g of chitosan 10B with 25 mL of MO (100 mmol/L) solution with the pH ranging from 4.0 to 9.0. The pH of the samples was adjusted by adding micro liter quantities of 1 mol/L HCl or 1 mol/L NaOH. In kinetics studies, 0.05 g of chitosan 10B was mixed with 25 mL of MO solution with varied initial concentrations (15–100 mmol/L), and samples were withdrawn at desired time intervals. In isotherm experiments, 0.05 g of chitosan 10B was added to 25 mL of MO solution with varied initial concentrations (5–50 mmol/L).
After adsorption, the samples were centrifuged using a centrifuge machine (Labofuge 200, D-37520 Osterods, Germany) at a speed of 4000 r/min. The concentrations of MO in the supernatant liquor were determined by using standard curve. The absorbance of MO in aqueous solutions was measured with a Shimadzu UV-1601PC spectrophotometer at 465 nm, equipped with an electronically thermostatic cell holder (Shimadzu); the quartz cell had a path length of 1.0 cm. Before each measurement, the base line of spectrophotometer was calibrated against solvent. The standard curve was obtained by plotting absorbance versus concentration of MO.
The amount of MO adsorbed (qe) was determined by using the following equation:
qe = V(C0 – Ce)/m(1)
where C0 and Ce represent the initial and equilibrium MO concentrations (mmol/L), respectively; V is the volume of the MO solution (L) and m is the amount (g) of chitosan 10B. The adsorption kinetics and equilibrium adsorption were also performed at different temperatures (27, 33, 40 and 45°C), respectively. The amount of adsorption was determined in the same way as described above.
3. Results and Discussion
3.1. Kinetics of Adsorption
3.1.1. Effect of pH
In order to avoid solubilization of the chitosan in aqueous solution at very low pH [37], adsorption experiments were conducted with the pH ranging from 4.0 to 9.0. The effect of pH on adsorption kinetics of MO onto chitosan 10B at 33oC is shown in Figure 2, where the initial dye concentration was 100 mmol/L. It indicates that the adsorption rate (dq/dt) and adsorption capacity (qt) increase significantly with decrease in solution pH. After 240 min of adsorption, the equilibrium adsorption capacity (qe) at pH 4.0 (30.14 mmol/g) is more than double of that at pH 9.0 (11.79 mmol/g) (Table 1). It can be seen that the pH
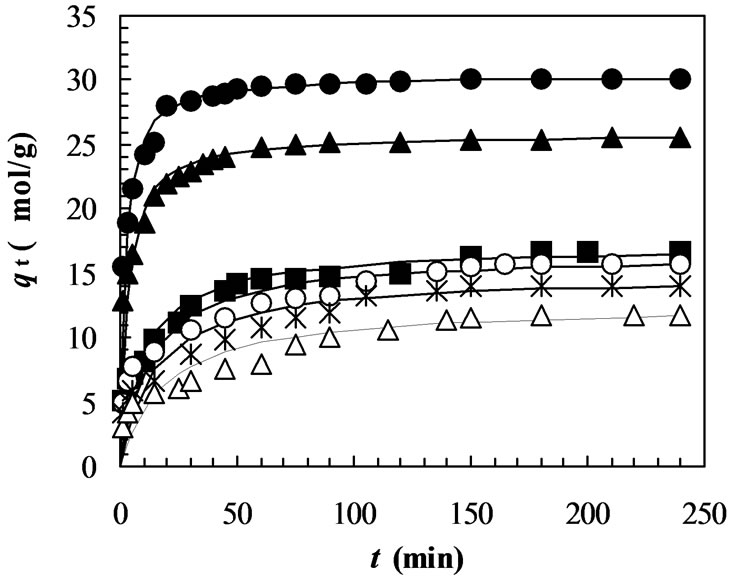
Figure 2. Adsorption kinetics of MO on chitosan 10B at different pH (initial concentration of MO: 100 mmol/L; solution volume: 25 mL; chitosan: 0.05 g; temperature: 33 °C; solution pHs: closed circles: pH 4; closed triangles: pH 5; closed squares: pH 6; opened circles: pH 7; stars: pH 8; opened triangles: pH 9). All solid lines are simulated adsorption kinetics of MO onto the chitosan at respective pHs. The simulated adsorption kinetic profiles were generated using the pseudo second-order model in Equation (3) and the values of equilibrium adsorption capacity (qe(cal)) and the pseudo second-order rate constant (k2) listed in Table 1.
of aqueous solution plays an important role in the adsorption kinetics of MO onto chitosan 10B and the most suitable pH is 4.0 among the observed pH ranging from 4.0 to 9.0. Similar results were also observed in the adsorption of reactive [32] and acid dyes [33] on crosslinked chitosan. Figure 2 also shows that the time to reach equilibrium adsorption increases gradually with increase in pH of the aqueous solution. Our data show that the time to reach equilibrium adsorption is about 60 min for pH 4.0-5.0 and 120 min for pH 6.0-9.0, respectively.
3.1.2. Effect of Initial Dye Concentration
Figure 3 shows that the effect of initial MO concentration on the adsorption kinetics of the chitosan 10B at pH 4.0 and temperature 33oC. An increase in the initial dye concentration leads to an increase in the adsorption capacity of the dye on chitosan. This is due to the increase in the driving force of the concentration gradient, as an increase in the initial dye concentration [32]. Figure 3 also shows that most of the dye is adsorbed to achieve equilibrium adsorption within 60 min, although the data were taken for 120 min. The equilibrium adsorption capacity (qe) at an initial dye concentration of 100 mmol/L is nearly six times larger than that of 15 mmol/L (Table 1).
3.1.3. Effect of Temperature
The effect of temperature on adsorption kinetics of MO
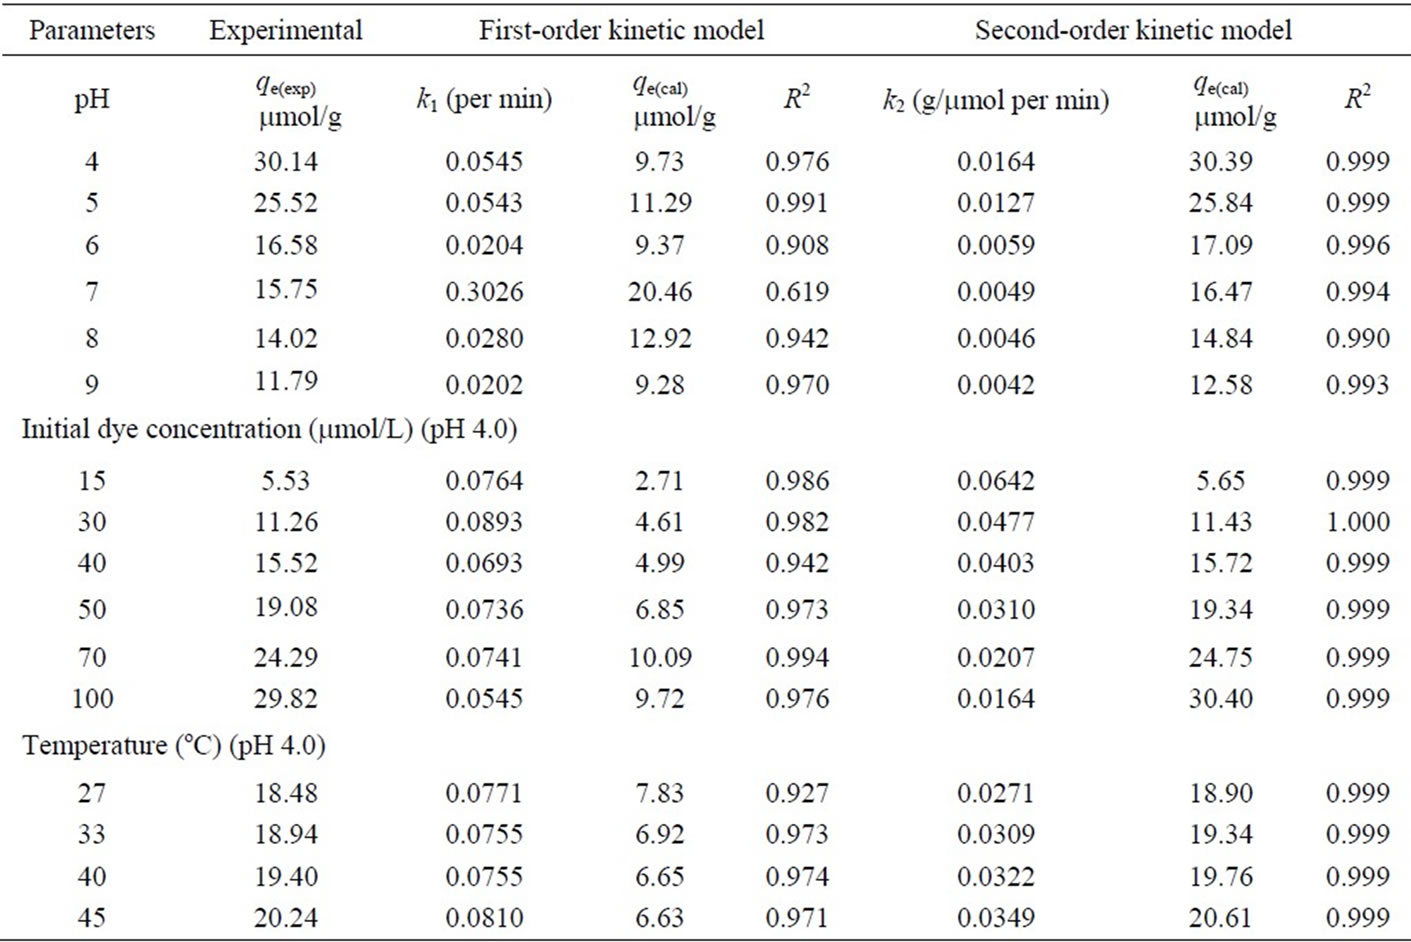
Table 1. Comparison of the pseudo firstand second-order adsorption rate constants, and calculated and experimental qe values for different pH, initial dye concentrations and temperatures.
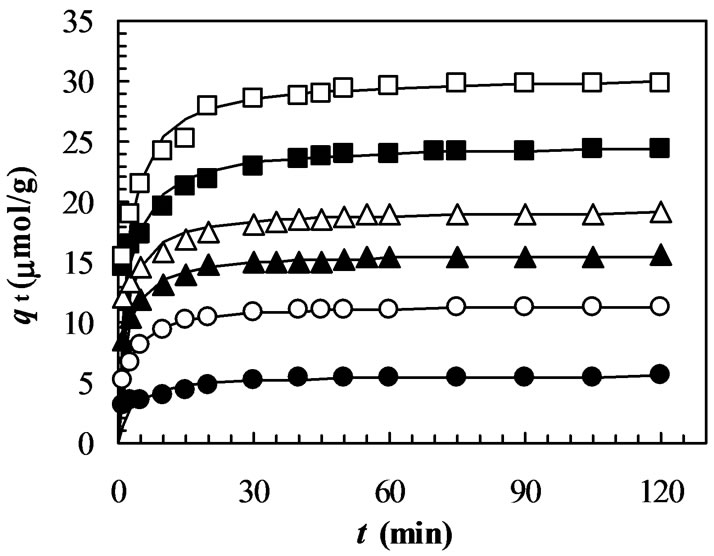
Figure 3. Adsorption kinetics of MO on chitosan 10B at different initial concentration. (solution volume: 25 mL; chitosan: 0.05 g; solution pH: 4; temperature: 33°C; initial concentrations of MO: closed circles: 15 mmol/L; opened circles: 30 mmol/L; closed triangles: 40 mmol/L; opened triangles: 50 mmol/L; closed squares: 70 mmol/L; opened circles: 100 mmol/L). All solid lines are simulated adsorption kinetics of MO onto the chitosan at respective initial concentrations of dye. The simulated adsorption kinetic profiles were generated using the pseudo second-order model in Equation (3) and the values of equilibrium adsorption capacity (qe(cal)) and the pseudo second-order rate constant (k2) listed in Table 1.
onto chitosan at pH 4.0 is shown in Figure 4 where initial dye concentration was 50 mmol/L. Below and above the equilibrium time, an increase in the temperature leads to an increase in dye adsorption rate (dq/dt) and adsorption capacity (qt), this indicates a kinetically controlling process. However, it can be seen from Figure 4 that the temperature effects are insignificant. It has been reported that the variation of wastewater temperature does not significantly affect the overall decolorization performance [34]. However, a significant effect of temperature on the equilibrium isotherms was observed in the adsorption of trisodium 2-hydroxy-1,1’-azonaphthalene-3,4’,6- trisulfonate onto chitosan [28] and of Acid Orange II (acid dye) onto the cross-linked chitosan [33].
3.2. Rate Constant Studies
In order to investigate the mechanism of adsorption kinetics, the pseudo first-order and pseudo second-order equations were used to test the experimental data of pH, initial concentration and temperature, respectively. The pseudo first-order rate expression of Lagergren and Annadurai and Krishnan [38,15] is given as:
log(qe – qt) = logqe – (k1/2.303)t (2)
where qe and qt are the amounts of dye adsorbed on chitosan 10B at equilibrium and at time t, respectively (mmol/g), and k1 is the rate constant of pseudo first-order
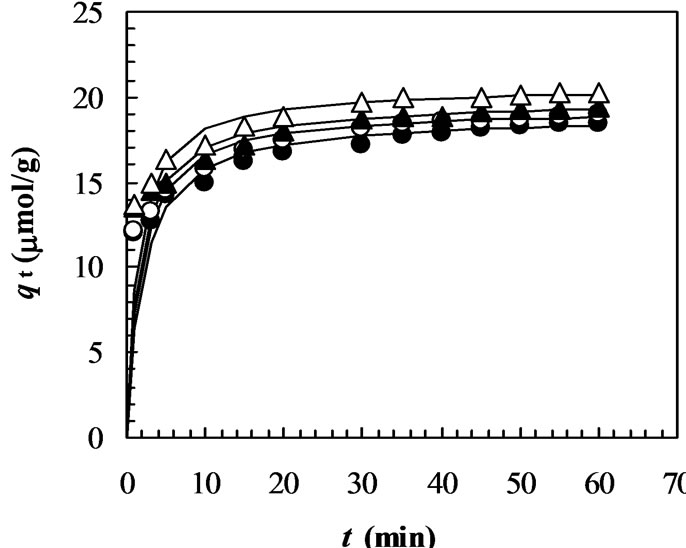
Figure 4. Adsorption kinetics of MO on chitosan 10B at different temperatures (initial concentration of MO: 50 mmol/L; solution volume: 25 mL; chitosan: 0.05 g; solution pH: 4; temperatures: closed circles: 27°C; opened circles: 33°C; closed triangles: 40°C; opened triangles: 45°C). All solid lines are simulated adsorption kinetics of MO onto the chitosan at respective temperature. The simulated adsorption kinetic profiles were generated using the pseudo second-order model in Equation (3) and the values of equilibrium adsorption capacity (qe(cal)) and the pseudo secondorder rate constant (k2) listed in Table 1.
adsorption (per min). A straight line of log(qe – qt) versus t suggests the applicability of this kinetic model to fit the experimental data. The equilibrium adsorption capacity (qe) is required to fit the data, but in many cases qe remains unknown due to slow adsorption processes. Also, in many cases, the pseudo first-order equation of Lagergren does not fit well to the whole range of contact time and is generally applicable over the initial stage of the adsorption processes [38,39].
The pseudo second-order kinetic model [39,40] is expressed as:
qt = k2qe2t/(1+ k2qet)(3)
where k2 (g/mmol per min) is the rate constant of pseudo second-order adsorption and can be determined from a linearized form of this equation, represented by Equation (4):
t/qt = 1/k2qe2 + (1/qe)t(4)
If second-order kinetics is applicable, the plot of t/qt versus t should show a linear relationship. There is no need to know any parameter beforehand and the equilibrium adsorption capacity (qe) can be calculated from Equation (4). Contrary to the other model it predicts the behavior over the whole range of adsorption and is in agreement with an adsorption mechanism being the ratecontrolling step [39,40], which may involve interactions between dye anions and adsorbent.
The slopes and y-intercepts of plots of log(qe – qt) versus t were used to determine the pseudo first-order rate constant (k1) and equilibrium adsorption capacity (qe). These results are shown in Table 1. A comparison of results with the correlation coefficients (R2) is also shown in Table 1. The values of R2 for the pseudo firstorder kinetics model were low. Also, the calculated qe values obtained from the pseudo first-order kinetic model do not give reasonable values, which are too low compared with experimental qe values (Table 1). These results suggest that the adsorption of dye MO onto the chitosan 10B is not a pseudo first-order reaction.
The slopes and y-intercepts of plots of t/qt versus t were used to calculate the pseudo second-order rate constant k2 and qe. The straight lines in plot of t/qt versus t (Figure 5) show a good agreement of experimental data with the pseudo second-order kinetic model for different initial dye concentrations. The similar straight-line agreements are also observed for data at different pH and temperature although their plots are not shown in this paper. The computed results obtained from the pseudo second-order kinetic model are shown in Table 1. The values of correlation coefficients (R2) for the pseudo second-order kinetic model are ≥ 0.999 for almost all the cases. The values of calculated equilibrium adsorption capacity (qe(cal)) also agree very well with experimental data (Table 1). Moreover, the experimental adsorption kinetic profiles (Figures 2, 3 and 4) are perfectly reproduced in the simulated data (each solid line in Figures 2, 3 and 4) obtained from numerical analysis on the basis of pseudo second-order kinetic model (Equation (3)) using the values of k2 and qe(cal) listed in Table 1. These results indicate that the present adsorption system belongs to the pseudo second-order kinetic model. The similar phenomena were also observed in biosorption of reactive blue 2 (RB2), reactive yellow 2 (RY2) and Remazol black B on biomass [20,21]. According to the pseudo second-order model, the adsorption rate dq/dt is proportional to the second-order of (qe – qt). Since the chitosan 10B in our experiments have relatively high values of qe (Table 1), the adsorption rates become very fast and the equilibrium times are short. Such short equilibrium times coupled with high adsorption capacity indicate a high degree of affinity between the dye MO and the chitosan 10B [20].
The rate constant k2 at different temperatures listed in Table 1 was used to estimate the activation energy of the MO adsorption onto chitosan 10B. Assume that the correlation among the rate constant (k2), temperature (T) and activation energy (Ea) follows the Arrhenius equation, which induces the following expression:
lnk2 = – Ea/R (1/T) + const(5)
where R is the gas constant. The slope of plot of lnk2 versus 1/T was used to evaluate Ea. The value of Ea was estimated to be 10.41 kJ/mol. This value seems to be small and the adsorption rate is not very sensitive to
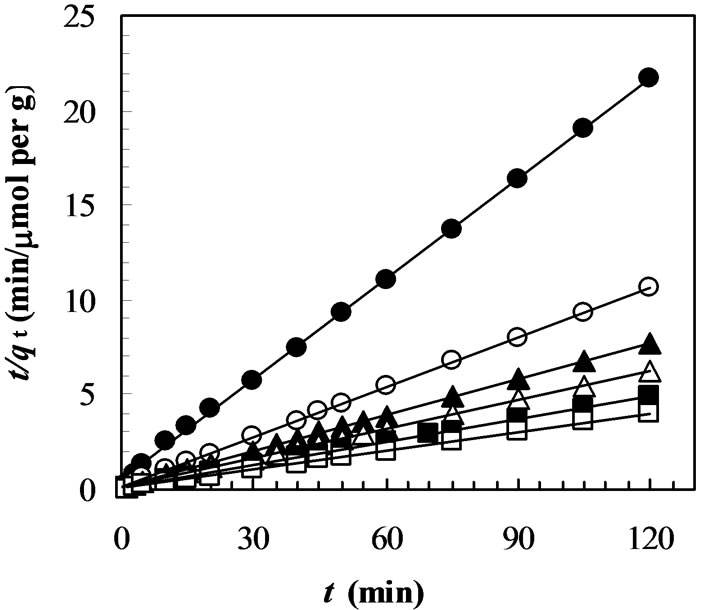
Figure 5. Plot of the pseudo second-order model (t/qt versus t) at different initial dye concentration. (closed circles: 15 mmol/L; opened circles: 30 mmol/L; closed triangles: 40 mmol/L; opened triangles: 50 mmol/L; closed squares: 70 mmol/L; opened circles: 100 mmol/L).
temperature in the range (27−45°C) we studied.
3.3. Equilibrium Adsorption
Adsorption isotherms describe how adsorbates interact with adsorbents and so are critical in optimizing the use of adsorbents. Thus, the correlation of equilibrium data by either theoretical or empirical equations is essential to the practical design and operation of adsorption systems. A plot of the equilibrium adsorption capacity, qe (mmol/g), versus the liquid phase MO equilibrium concentration, Ce (mmol/L), for various temperatures at pH 4 is shown in Figure 6. The adsorption capacities of the chitosan increased slightly when the solution temperature was increased from 27 to 45°C. The isotherm constants obtained from the linearized plots of Freundlich and Langmuir equations and the values of correlation coefficients (R2) are discussed in the following sections.
3.3.1. Freundlich Isotherm
The well-known Freundlich isotherm [41] used for isothermal adsorption is a special model for heterogeneous surface energy in which the energy term in the Langmuir equation varies as a function of surface coverage strictly due to variation of the sorption. The Freundlich equation is given as:
qe = KFCe1/n(6)
Equation (6) can be linearized by taking logarithms to find out the parameters KF and 1/n.
ln(qe) = (1/n)ln Ce + lnKF(7)
where KF is roughly an indicator of the adsorption capacity and 1/n of the adsorption intensity. KF and 1/n can be determined from the linear plot of ln(qe) versus ln(Ce). The calculated results are listed in Table 2. The magni
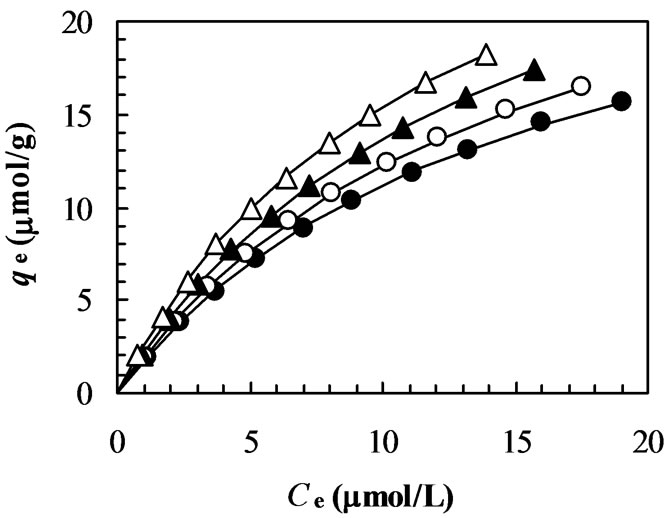
Figure 6. Equilibrium adsorption of MO on chitosan 10B at different temperatures (initial concentration of MO: 5-50 mmol/L; solution volume: 25 mL; chitosan: 0.05 g; solution pH: 4; temperatures: closed circles: 27°C; opened circles: 33°C; closed triangles: 40°C; opened triangles: 45°C). All solid lines are simulated equilibrium adsorption of MO onto the chitosan at respective temperature. The simulated equilibrium adsorption isotherms were generated using the Langmuir model in Equation (8) and the Langmuir isotherm constants listed in Table 2.
tude of the exponent 1/n gives an indication of the favorability of adsorption. From Table 2, the exponent n is larger than 1 for adsorption of MO onto the chitosan at different temperatures indicating favorable adsorption condition [14]. However, the low values correlation coefficients (R2 < 0.999) show poor agreement of Freundlich isotherm with the experimental data.
3.3.2. Langmuir Isotherm
The widely used Langmuir isotherm [42] has found successful application in many real sorption processes and is expressed as:
qe = KLCe/(1 + aLCe)(8)
The constants KL and aL are the characteristics of the Langmuir equation and can be determined from a linearized form of this equation, represented by Equation (9):
Ce/qe = 1/KL + (aL/KL)Ce (9)
Therefore, a plot of Ce/qe versus Ce gives a straight line of slope aL/KL and y-intercept 1/KL. The constant KL is the equilibrium constant and the ratio aL/KL gives the inverse of theoretical monolayer saturation capacity (qm).
A linearized plot of (Ce/qe) versus Ce is obtained from the model as shown in Figure 7. The values of KL and aL are computed from the slopes and y-intercepts of different straight lines representing at different temperatures. The calculated results are shown in Table 2. The fits are quite well for all the four different temperatures under the concentration range studied (correlation coefficient, R2 > 0.999). From the results shown in Table 2, the capacities of the chitosan for dye adsorption are not significantly dependent on the solution temperature although the values of KL and qm slightly increase when the solution temperature was increased from about 27 to 45°C. These results also suggest that the dye-chitosan interaction must be an endothermic process.
In an effort to understand the equilibrium processes involved in MO adsorption onto the chitosan, a computer simulation of the adsorption isotherms has been performed numerically on the basis of the Langmuir model in Equation (8) and using the Langmuir isotherm constants listed in Table 2, and the results are compared with the experimental data (Figure 6). The observed curves were obtained from the plots of equilibrium adsorption capacity, qe (mmol/g), versus the liquid phase MO equilibrium concentration, Ce (mmol/L), at different temperatures. The simulated curves (all solid lines) were obtained as described as stated. The adsorption capacities of the chitosan increased slightly when the solution tem-
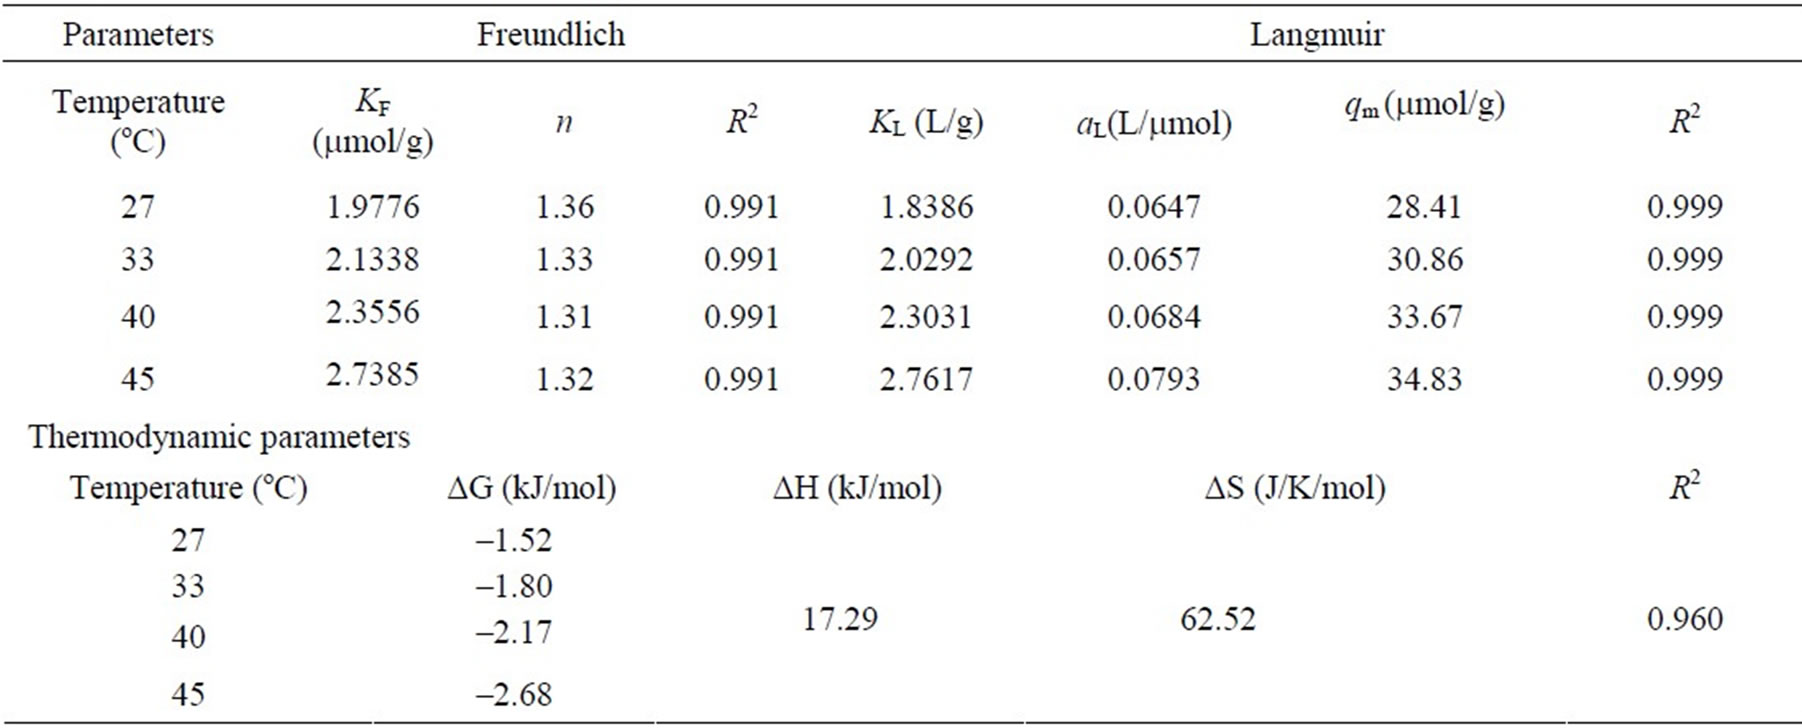
Table 2. Freundlich and Langmuir isotherm constants at different temperatures, and thermodynamic parameters for the adsorption of dye MO onto chitosan from aqueous solution at pH 4.
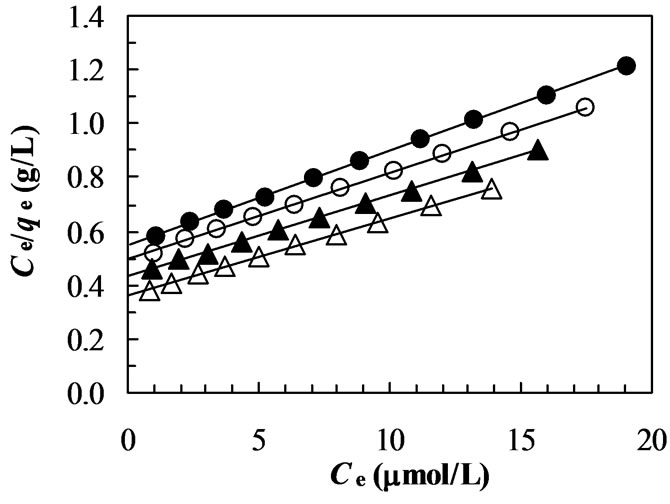
Figure 7. Plot of Langmuir model (Ce/qe versus Ce) at different temperatures (closed circles: 27°C; opened circles: 33°C; closed triangles: 40°C; opened triangles: 45°C).
perature was increased from 27 to 45°C. These features of the observed data are well reproduced in the simulated data as shown in Figure 6, supporting that the all isotherms data are described well by the Langmuir equation.
The thermodynamic parameters such as change in free energy (DG), enthalpy (DH) and entropy (DS) were determined using the following equations [35]:
DG = –RTlnKL(10)
lnKL = DS/R – DH/RT(11)
where KL is the equilibrium constant, T is the solution temperature (K) and R is the gas constant. DH and DS were calculated from the slope and y-intercept of van’t Hoff plots of lnKL vs. 1/T. The results are presented in Table 2. The negative values of DG and positive value of DH indicate that the adsorption of MO on chitosan 10B is spontaneous and an endothermic process. These behaviors seem to be explained by the ionic-nature of the dye MO-chitosan interaction [16,36]. The positive value of DS suggests that entropy is responsible for making the DG negative for the adsorption process to be spontaneous.
4. Conclusions
The kinetics and adsorption mechanism of methyl orange (MO) onto chitosan 10B were studied in the present work. Batch experiments showed that both the initial dye concentration and the pH of aqueous solutions significantly affect the adsorption capacity of dye MO on the chitosan 10B. However, the adsorption kinetics of the dye on chitosan is slightly influenced by the temperature. The pseudo second-order kinetic model agrees very well with the dynamical behavior for the adsorption of dye MO on chitosan flakes under several different pHs, initial dye concentrations and temperatures in the whole ranges we studied. The qe values calculated from this kinetic model are very similar to the experimental qe values obtained from several experiments as shown in Table 1. Moreover, the experimental adsorption kinetic profiles are perfectly reproduced in the simulated data obtained from numerically on the basis of the pseudo second-order kinetic model in Equation (3) and using the isotherm constants listed in Table 1. On the contrary, the pseudo first-order kinetic model fits the experimental data poorly for the entire range under study.
The Langmuir equation is the best-fit equilibrium isotherm for the sorption of dye MO onto chitosan based on a linearized correlation coefficient. The experimental adsorption isotherms also are perfectly reproduced in the simulated data obtained from numerical analysis on the basis of the Langmuir model in Equation (8) and using the Langmuir isotherm constants listed in Table 2.
The Gibbs free energy (DG) demonstrated that the adsorption process is favorable for the interaction cited and the pronounced chitosan-dye interaction is reflected in the positive values of entropy (DS).
It may be concluded that chitosan may be used as a low-cost, natural and abundant source for the removal of anionic azo dyes from water and wastewater as an alternative to more costly materials such as activated carbon.
REFERENCES
- M. S. Tsuboy, J. P. F. Angeli, M. S. Mantovani, S. Knasmueller, G. A. Umbuzeiro and L. R. Ribeiro, “Genotoxic, Mutagenic and Cytotoxic Effects of the Commercial Dye CI Disperse Blue 291 in the Human Hepatic Cell Line HepG2,” Toxicology in Vitro, Vol. 21, No. 8, 2007, pp. 1650-1655.
- S. Vinitnantharat, W. Chartthe and A. Pinisakul, “Toxicity of Reactive Red 141 and Basic Red 14 to Algae and Waterfleas,” Water Science and Technology, Vol. 58, No. 6, 2008, pp. 1193-1198.
- Z. Raïs, L. El Hassani, J. Maghnouje, M. Hadji, R. Ibnelkhayat, R. Nejjar, A. Kherbeche and A. Chaqroune, “Dyes’ Removal from Textile Wastewater by Phosphogypsum Using Coagulation and Precipitation Method,” Physics and Chemistry News, Vol. 7, 2002, pp. 100-109.
- A. Rezaee, M. T. Ghaneian, S. J. Hashemian, G. Moussavi, A. Khavanin and G. Ghanizadeh, “Decolorization of Reactive Blue 19 Dye from Textile Wastewater by the UV/H2O2 Process,” Journal of Applied Sciences, Vol. 8, No. 6, 2008, pp. 1108-1112.
- J. Racyte, M. Rimeika and H. Bruning, “pH Effect on Decolorization of Raw Textile Wastewater Polluted with Reactive Dyes by Advanced Oxidation with UV/H2O2,” Environmental Protection Engineering, Vol. 35, No. 3, 1999, pp. 167-178.
- R. Saraswathi and M. K. Saseetharan, “Investigation on Microorganisms and their Degradation Efficiency in Paper and Pulp Mill Effluent,” Journal of Water Resource and Protection, Vol. 2, No. 7, 2010, pp. 660-664.
- C. Varlikli, V. Bekiari, M. Kus, N. Boduroglu, I. Oner, P. Lianos, G. Lyberatos and S. Icli, “Adsorption of Dyes on Sahara Desert Sand,” Journal of Hazardous Materials, Vol. 170, No. 1, 2009, pp. 27-34.
- A. Rodriguez, J. Garcia, G. Ovejero and M. Mestanza, “Adsorption of Anionic and Cationic Dyes on Activated Carbon from Aqueous Solutions: Equilibrium and Kinetics,” Journal of Hazardous Materials, Vol. 172, No. 2-3, 2009, pp. 1311-1320.
- G. McKay, “The Adsorption of Dyestuffs from Aqueous Solution Using Activated Carbon: Analytical Solution for Batch Adsorption Based on External Mass Transfer and Pore Diffusion,” Chemical Engineering Journal, Vol. 27, No. 3, 1983, pp. 187-196.
- K. C. L. N. Rao and K. K. Ashutosh, “Color Removal from a Dyestuff Industry Effluent using Activated Carbon,” Indian Journal of Chemical Technology, Vol. 1, No. 1, 1994, pp. 13-19.
- A. N. Fernandes, C. A. P. Almeida, C. T. B. Menezes, N. A. Debacher and M. M. D. Sierra, “Removal of Methylene Blue from Aqueous Solution by Peat,” Journal of Hazardous Materials, Vol. 144, No. 1-2, 2007, pp. 412-419.
- K. R. Ramakrishna and T. Viraraghavan, “Dye Removal Using Low Cost Adsorbents,” Water Science and Technology, Vol. 36, No. 2-3, 1997, pp. 189-196.
- R. Dolphen, N. Sakkayawong, P. Thiravetyan and W. Nakbanpote, “Adsorption of Reactive Red 141 from Wastewater onto Modified Chitin,” Journal of Hazardous Materials, Vol. 145, No. 1-2, 2007, pp. 250-255.
- G. McKay, H. S. Blair and J. R. Gardner, “Adsorption of Dyes on Chitin. I. Equilibrium Studies,” Journal of Applied Polymer Science, Vol. 27, No. 8, 1982, pp. 3043- 3057.
- G. Annadurai and M. R. V. Krishnan, “Adsorption of Acid Dye from Aqueous Solution by Chitin: Batch Kinetic Studies,” Indian Journal of Chemical Technology, Vol. 4, 1997, pp. 213-222.
- E. Longhinetti, F. Pozza, L. Furlan, M. D. N. D. Sanchez, M. Klug, M. C. M. Laranjeira and V. T. Favere, “Adsorption of Anionic Dyes on the Biopolymer Chitin,” Journal of Brazilian Chemical Society, Vol. 9, No. 5, 1998, pp. 435-440.
- A. K. Chowdhury, A. D. Sarkar and A. Bandyopadhyay, “Rice Husk Ash as a Low Cost Adsorbent for the Removal of Methylene Blue and Congo Red in Aqueous Phases,” Clean, Vol. 37, No. 7, 2009, pp. 581-591.
- M. Arami, N. Y. Limaee, N. M. Mahmoodi and N. S. Tabrizi, “Equilibrium and Kinetics Studies for the Adsorption of Direct and Acid Dyes from Aqueous Solution by Soy Meal Hull,” Journal of Hazardous Materials, Vol. 135, No. 1-3, 2006, pp. 171-179.
- K. S. Mundhe, A. A. Bhave, R. C. Torane, N. R. Deshpande and R. V. Kashalkar, “Removal of Cationic Dye from Aqueous Solution Using Raw Agro Wastes as Non–Conventional Low–Cost Adsorbent,” Oriental Journal of Chemistry, Vol. 25, No. 4, 2009, pp. 953-959.
- Z. Aksu and S. Tezer, “Equilibrium and Kinetic Modeling of Biosorption of Remazol Black B by Rhizopus Arrhizus in a Batch System: Effect of Temperature,” Process Biochemistry, Vol. 36, No. 5, 2000, pp. 431-439.
- Z. Aksu, “Biosorption of Reactive Dyes by Dried Activated Sludge: Equilibrium and Kinetic Modeling,” Biochemical Engineering Journal, Vol. 7, No. 1, 2001, pp. 79-84.
- T. K. Saha, H. Ichikawa and Y. Fukumori, “Gadolinium Diethylenetriaminopetaacetic Acid-Loaded Chitosan Microspheres for Gadolinium Neutron-Capture Therapy,” Carbohydrate Research, Vol. 341, No. 17, 2006, pp. 2835-2841.
- N. Bhattarai, J. Gunn and M. Zhang, “Chitosan-Based Hydrogels for Controlled, Localized Drug Delivery,” Advanced Drug Delivery Reviews, Vol. 62, No. 1, 2010, pp. 83-99.
- M. Manconi, S. Mura, M. L. Manca, A. M. Fadda, M. Dolz, M. J. Hernandez, A. Casanovas and O. Díez-Sales, “Chitosomes as Drug Delivery Systems for C-Phycocyanin: Preparation and Characterization,” International Journal of Pharmaceutics, Vol. 392, No. 1-2, 2010, pp. 92-100.
- K. H. Chu, “Removal of Copper from Aqueous Solution by Chitosan in Prawn Shell: Adsorption Equilibrium and Kinetics,” Journal of Hazardous Materials, Vol. 90, No. 1, 2002, pp. 77-95.
- P. Miretzky and A. Fernandez Cirelli, “Hg(II) Removal from Water by Chitosan and Chitosan Derivatives: A Review,” Journal of Hazardous Materials, Vol. 167, No. 1-3, 2009, pp. 10-23.
- J. R. Rangel-Mendez, R. Monroy-Zepeda, E. LeyvaRamos, P. E. Diaz-Flores and K. Shirai, “Chitosan Selectivity for Removing Cadmium(II), Copper(II), and Lead(II) from Aqueous Phase: pH and Organic Matter Effect,” Journal of Hazardous Materials, Vol. 162, No. 1, 2009, pp. 503-511.
- T. K. Saha, S. Karmaker, H. Ichikawa and Y. Fukumori, “Mechanisms and Kinetics of Trisodium 2-Hydroxy-1, 1’-Azonaphthalene-3,4’,6-Trisulfonate Adsorption onto Chitosan,” Journal of Colloid and Interface Science, Vol. 286, No. 2, 2005, pp. 433-439.
- P. R. Modak, K. S. Singh and D. A. Connor, “Experimental Study on the Elimination of Colour and Organic Matter from Wastewater Using an Inexpensive Biomaterial, Chitosan,” Water Quality Research Journal of Canada, Vol. 44, No. 3, 2009, pp. 295-306.
- A. H. Chen and Y. Y. Huang, “Adsorption of Remazol Black 5 from Aqueous Solution by the Templated Crosslinked-Chitosans,” Journal of Hazardous Materials, Vol. 177, No. 1-3, 2010, pp. 668-675.
- N. K. Lazaridis, G. Z. Kyzas, A. A. Vassiliou and D. N. Bikiaris, “Chitosan Derivatives as Biosorbents for Basic Dyes,” Langmuir, Vol. 23, No. 14, 2007, pp. 7634-7643.
- M.-S. Chiou and H.-Y. Li, “Equilibrium and Kinetic Modeling of Adsorption of Reactive Dye on Cross-Linked Chitosan Beads,” Journal of Hazardous Materials, Vol. 93, No. 2, 2002, pp. 233-248.
- H. Yoshida, A. Okamoto and T. Kataoka, “Adsorption of Acid Dye on Cross-Linked Chitosan Fibers: Equilibria,” Chemical Engineering Science, Vol. 48, No. 12, 1993, pp. 2267-2272.
- M. N. V. R. Kumar, “A Review of Chitin and Chitosan Applications,” Reactive and Functional Polymers, Vol. 46, No. 1, 2000, pp. 1-27.
- M. S. Chiou and H. Y. Li, “Adsorption Behavior of Reactive Dye in Aqueous Solution on Chemical CrossLinked Chitosan Beads,” Chemosphere, Vol. 50, No. 8, 2003, pp. 1095-1105.
- F. S. C. dos Anjos, E. F. S. Vieira and A. R. Cestari, “Interaction of Indigo Carmine Dye with Chitosan Evaluated by Adsorption and Thermochemical Data,” Journal of Colloid and Interface Science, Vol. 253, No. 2, 2002, pp. 243-246.
- R. A. A. Muzzarelli, “Natural Chelating Polymers: Alginic Acid, Chitin and Chitosan,” Pergamon, Oxford, 1973.
- S. Lagergren, “Zur Theorie der Sogenannten Adsorption Geloster Stoffe,” K. Sven. Vetenskapsakad. Handl., Vol. 24, No. 4, 1898, pp. 1-39.
- G. McKay and Y. S. Ho, “The Sorption of Lead(II) on Peat,” Water Research , Vol. 33, No. 2, 1999, pp. 578-584.
- G. McKay and Y. S. Ho, “Pseudo-Second Order Model for Sorption Processes,” Process Biochemistry, Vol. 34, No. 5, 1999, pp. 451-465.
- H. Freundlich, “Adsorption Solution,” Zeitschrift für Physikalische Chemie, Vol. 57, 1906, pp. 384-470.
- I. Langmuir, “Adsorption of Gases on Plain Surfaces of Glass Mica Platinum,” Journal of American Chemical Society, Vol. 40, No. 9, 1918, pp. 1361-1403.