Journal of Biomedical Science and Engineering
Vol. 5 No. 12 (2012) , Article ID: 25779 , 7 pages DOI:10.4236/jbise.2012.512094
Multimodal compression applied to biomedical data
![]()
Laboratoire Images Signaux et Systèmes Intelligents, Université Paris-Est Créteil (UPEC), Créteil, France
Email: emre.zeybek@u-pec.fr, rfournier@u-pec.fr, naitali@u-pec.fr
Received 14 November 2011; revised 6 January 2012; accepted 12 February 2012
Keywords: Biomedical Signal Compression; Biomedical Image Compression; JPEG2000; Lossy Compression; Multimodal Compression; Quad-Tree Decomposition
ABSTRACT
In this paper, we introduce a novel approach to compress jointly a medical image and a multichannel biosignals (e.g. ECG, EEG). This technique is based on the idea of Multimodal Compression (MC) which requires only one codec instead of multiple codecs. Objectively, biosignal samples are merged in the spatial domain of the image using a specific mixing function. Afterwards, the whole mixture is compressed using JPEG 2000. The spatial mixing function inserts samples in low-frequency regions, defined using a set of operations, including down-sampling, interpolation, and quad-tree decomposition. The decoding is achieved by inverting the process using a separation function. Results show that this technique allows better performances in terms of Compression Ratio (CR) compared to approaches which encode separately modalities. The reconstruction quality is evaluated on a set of test data using the PSNR (Peak Signal Noise Ratio) and the PRD (Percent Root Mean Square Difference), respectively for the image and biosignals.
1. INTRODUCTION
Compression of biomedical data becomes nowadays a very important process in some applications such as telemedicine. For this purpose, many specific encoders have been proposed in the literature to deal with various types of medical data. For instance, when considering biosignal compression, huge number of papers on ECG and EEG compression has been published during the last decade [1,2].
On the other hand, interesting methods including standards have been proposed to encode medical images such as Ultra-Sounds images (US) and Magnetic Resonance Image (MRIs) [3]. In such a context, both 2D and 3D methods have been considered.
In this paper, we are interested in compressing jointly medical signals with biosignals using the principle of Multimodal Compression, as used in its simple form in [4] and introduced as a concept in [5]. We believe that this scheme can be useful in some telemedicine applications where various clinical data are acquired simultaneously with specific sensors. Generally speaking, the MC approach is the process of compressing and decompressing, after an intelligent fusion, different data sets produced by different modalities, using a single codec system (e.g. image with signals, video with signals, etc.).
When dealing with this concept, it is important that one should not confuse the Multimodal Compression with watermarking which is a technique to hide data in others. Actually, performing a multimodal compression makes sense, when the data to be fusionned are semantically coherent. For example, one may consider that cardiac ultrasound images are semantically coherent with ECG signals and Brain MRI images are semantically coherent with the electroencephalogram (EEG).
The main key when using the MC approach is the way that one should perform the fusion between the image and signals. In this case, one can talk about the mixture function which allows inserting signal samples into some specific region of the image phase. This mixing function should be chosen so that a separation function is possible without any significant loss of information. Main steps of the Multimodal Compression are depicted in Figure 1 where JPEG 2000 is used for the compression of mixed data (see Figure 1(a)) and employed as well for the decompression purpose through a specific separation function (see Figure 1(b)).
This paper is organized as follows: in Section 2, different MC phases are presented. Afterwards, results are analyzed and discussed in Section 3. Finally, a conclusion is drawn in Section 4.
2. MULTIMODAL COMPRESSION OF BIOMEDICAL SIGNAL AND IMAGE DATA
2.1. Description of the Method
As it is shown in Figure 1, with the proposed compression method, samples of a signal are inserted into the image. This operation results in a mixture image, which contains both image and signal data. This mixture image is then lossy compressed by JPEG2000 encoder at the selected bitrate. For the remainder of this article; the image which is used to host these samples and the signal whose samples are inserted into the host image are referred as the host image and the guest signal, respectively.
At the decoder side of the proposed scheme, as seen in Figure 1(b), the mixture image, which is obtained by JPEG2000 decoder, is introduced to the “separation process”. The separation process, in contrast, is responsible for extracting the guest signal samples from the mixture image and reconstructing the host image. According to MC scheme shown in Figure 1, the two important entities are the mixing function and the separation function.
2.2. Mixing Function
The mixing function is responsible for inserting guest signal samples into a given region of the host image.
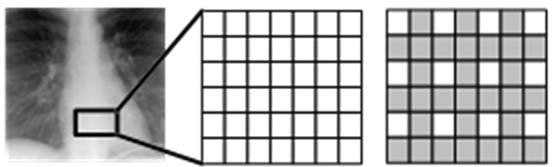
In this region, the insertion operation is done according to an “insertion pattern”. That means in such region, only pixels on locations allowed by this pattern are replaced by the guest signal samples. This is shown with an example in Figure 2. Figure 2(a) illustrates a rectangle highlighting the insertion region. In Figure 2(b), the pixel layout of the region highlighted by this rectangle is given. Figure 2(c) shows the insertion pattern used in replacing the host image pixels by the guest signal samples. Here, the pixels marked as gray are replaced by the guest signal samples, whereas white ones are left untouched. Figure 3 illustrates also the order in which the samples are inserted. The use of this pattern is closely related to “the separating function” and will become clear shortly.
The guest signal samples might have a different dynamic range then that of the host image. So the values
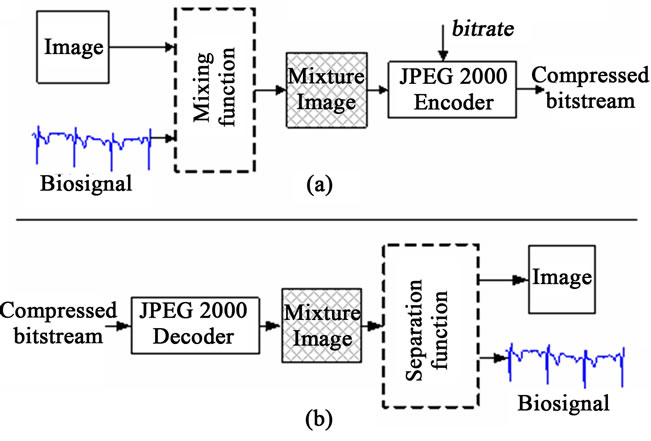
Figure 1. Illustration of the proposed compression scheme (a) Encoder side; (b) Decoder side.
 (a) (b) (c)
Figure 2. (a) An insertion region defined on an ultrasound image, which is used as the host image (b) The pixel layout on the insertion region (c) The insertion pattern used for the insertion region.
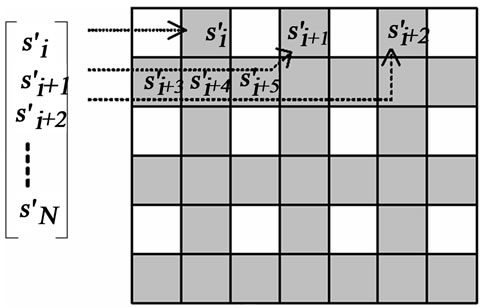
Figure 3. The insertion pattern and the guest signal samples. The samples are inserted into gray locations starting from the left to the and right and from the top to the bottom.
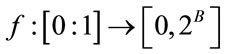
of the guest signal samples should be mapped to the dynamic range of the host image. For a normalized guest signal, this is mapping of the form:
 (1)
(1)
Or more generally, it can be expressed as:
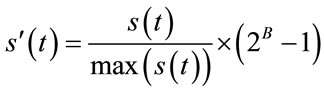 (2)
(2)
where, B is the bit-depth of the host image and  is the original signal whose samples are mapped to the range [0 - 2B] and
  is the maximum value of the original signal
 .
.
2.3. Separation Function
The separation function on the decoder is responsible for extracting the guest signal samples from the mixture image, and reconstructing the host image.
The extracted guest signal samples should be mapped to their original dynamic range. By using the same notation in Equation (2), it can be done with the following equation:
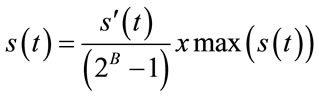 (3)
(3)
As a matter of fact, the replaced pixels of the host image during the mixing cannot be recovered to their exact values. These pixels values need to be estimated in order to reconstruct the host image. The cubic spline interpolation is used to estimate those pixels as it is well suited to image interpolation [6].
From the insertion pattern shown in Figure 2(c), the pixel values of gray samples can be estimated from the white ones, using a method like the cubic spline interpolation. If the original pixel values in the insertion region are slowly varying in horizontal and vertical directions, the error of this estimation would be small. This can be verified as follows:
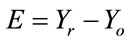
Let  be the part of the host image in the rectangular insertion region R, and let the subscripts o and r denote the original and the image reconstructed by cubic spline interpolation respectively.
  and
and  denote respectively the cubic spline interpolation and downsampling operators. The reconstruction error can be calculated according to:
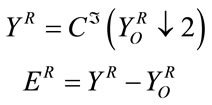 (4)
(4)
From Equation (4) we can say that, if the host image has slowly varying pixel values in R, then the interpolation of the gray pixels from the white ones in such region should be small. If it is the case, we can use R as the insertion region.
Consequently, a good selection for the rectangular insertion region should fulfill the below criterion:
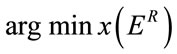 (5)
(5)
With x denoting the vector of coordinates [x0, y0, x1, y1] of R.
2.4. Quadtree Based Detection of the Insertion Region
According to Equation (5), the insertion region should be the one which minimize the reconstruction error. In order to detect regions of the image that can be used as insertion regions, we present a simple method, based on the quadtree spatial decomposition algorithm [7]. The steps involved in the detection process are given in the following listing:
Q1.1 Calculate an error image:
 , where
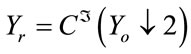
Q1.2 Perform a quadtree decomposition on the error image, a node is divided into four child nodes, if the following criteria has been met:
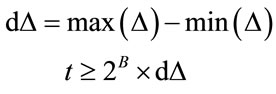 (6)
(6)
where t is threshold value such that. B is the bit-depth of the image. The  denotes the node being tested. The
 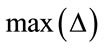 and
and are the maximum and minimum pixel values in the area of the host image represented by the node
 .
.
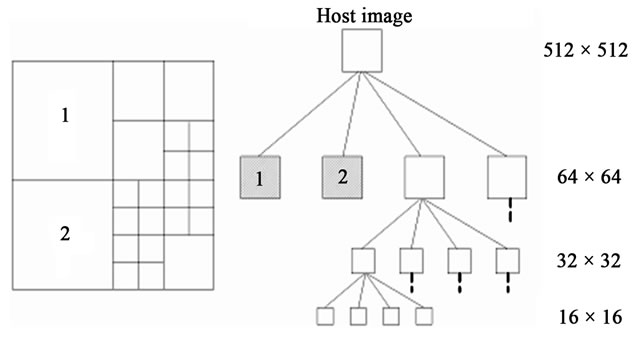
Q1.3 Select the nodes of the highest dimension and having no children. For example, the algorithm selects the nodes numbered as 1 and 2; on the spatial representation of the hypothetical quadtree in Figure 4.
Q1.4 Selected nodes are numbered and sorted, starting from the top-left node on the spatial representation of the quadtree.
2.4.1. The Threshold Parameter
As it can be made out from the division criterion in step Q1.2 of the detection algorithm, the parameter t has a direct effect on sizes of the detected and selected nodes, which also affect the size of the detected insertion regions (see Figure 5). A good choice of t should result in detected regions, which do not overlap with clinically important part of the image, in other words, the Region of Interest (ROI).
2.4.2. Limitations of the Quadtree Based Detection Algorithm
A limitation of the quadtree based detection algorithm is that, it can work only with images whose sizes are powers of two. This is an inherent limitation related to quadtree decomposition [8]. If the host image’s sizes are not a power of two, the algorithm might get stuck after several iterations. For example, the algorithm decides to divide a node for which the division test is passed, but it may happen that a division is not be possible because at least one of the dimensions is odd, so it causes to algorithm to terminate prematurely.
2.5. Defining a Region of Interest
The detection algorithm based on quadtree decomposition that we have seen in the previous section, does not account for an ROI existing on the host image. It can
 (a) (b)
Figure 4. The quadtree decomposition for an image 512 × 512 pixels (a) Spatial representation; (b) Tree representation of the quadtree (on the right column) dimensions corresponding to each node level is given respectively.
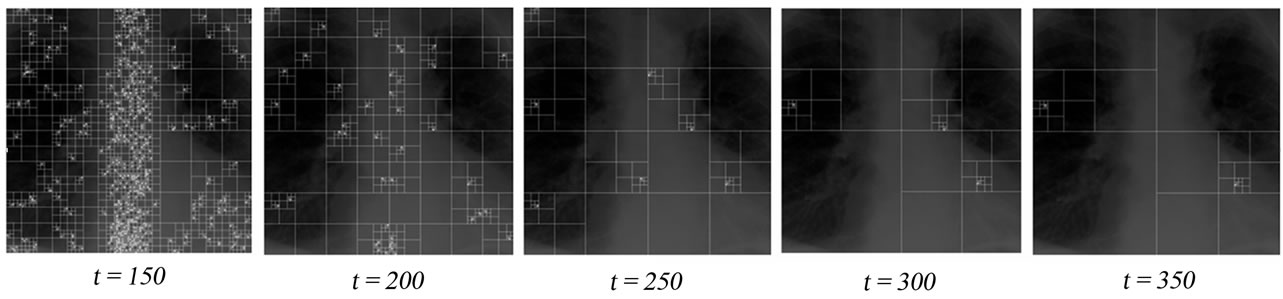
Figure 5. Effect of the threshold parameter t for the quadtree decomposition: In all figures, the algorithm will select the nodes of the highest dimension having no child nodes as insertion regions.
eventually lead to detection of an insertion region, in the ROI. As the reconstruction step of our proposed method is based on interpolation, an insertion in the ROI can degrade potentially vital data for diagnosis.
The quadtree based detection algorithm can be modified so that it accounts for existent ROI defined by an operator, before the detection process actually begins.
In order to do that, the pixel data of the ROI is simply replaced by a noise image to avoid having relatively large nodes on this region of the image by the subsequent quadtree decomposition of the image.
The algorithm would divide a region according to Equation (6), and highly varying pixels values of the noise image leads to detection of very small nodes on the region covered by the ROI. Since the algorithm selects the nodes of the highest dimensions with no children, the ROI is guaranteed to be leaved intact during the insertion process.
This can also be verified from Figure 6. As is shown in Figure 6(a), a ROI is defined on the host image and in Figure 6(b) the area of the image which corresponds to the ROI is replaced by a noise image. Figure 6(c) shows its resulting quadtree decomposition.
Once the algorithm terminates, and the coordinates of the nodes corresponding to the insertion regions are obtained, (see Q1.4), the insertion process can continue.
3. Analyses and Results
3.1. Test Signal and Images
The images used to evaluate proposed method can be downloaded from MeDEISA database [8]. We have used two sets of images throughout tests.
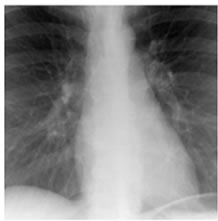
The first set (Figure 7) contains 4 X-ray images (XR2 DLung), and they are compressed according to our proposed compression scheme along with an ECG signal (ECG200).
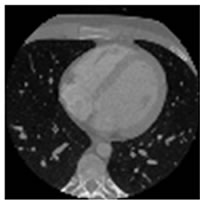
The second set (Figure 8) is composed from images taken from a CT sequence (CT_data_1). Once again, they are compressed according to the proposed scheme along with an EEG signal (EEG200). Furthermore, for the tests concerning the CT images a rectangular ROI of 256 × 256 pixels wide, is defined as shown in Figure 6.
3.2. Quality Measure for Reconstructed Image and Signal
The quality of the reconstructed images is evaluated according to the well known PSNR (Peak signal to noise ratio) criteria. For the evaluation of quality of the reconstructed signals, the PRD (Percent root mean degradation) has been used. The amount of degradation on the reconstructed signal  and the original
  is given by the following PRD formulae:
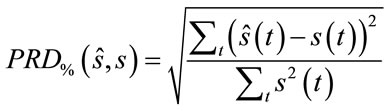 (7)
(7)
3.3. Results
3.3.1. Effect of the Threshold Parameter t on Capacity and Image Quality
The threshold parameter t has a direct effect on the number and the sizes of the detected nodes, hence the signal insertion capacity. This affects also the quality of the reconstructed images. The results of the evaluation of the reconstructed image quality and the sample insertion capacity as a function of t are given in Table 1. As it can also be seen from Figure 5, for the XR2DLung11 image shown in Figure 5(a), when t = 150, the selected insertion regions by the algorithm do not overlap with the ROI, hence causing no degradation therein.
3.3.2. Evaluation of the Quality of the Image and the Signal Compressed with the Proposed Method
In Table 2 at the given bitrate r in bpp (bit per pixel), the reconstruction quality (Po) obtained in terms of PSNR by compressing each image alone with JPEG2000 encoder, has been compared to the quality of the reconstructed image (Pm) and the signal (SP) obtained at the same compression bitrate using the proposed method.
From Table 2, one can notice that, starting from ~0.50 bpp there is a small or no difference between the reconstructed image quality with and without method (Po and Pm). Moreover, at that bitrate, we have an acceptable quality for the reconstructed signal (SP < ~0.4%).
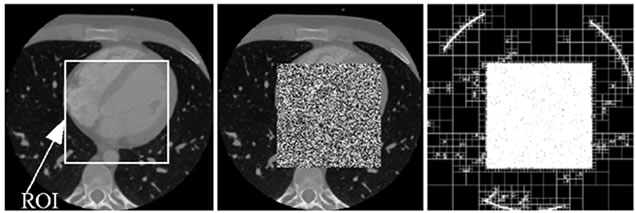 (a) (b) (c)
Figure 6. A CT image. (a) A ROI is defined on the original host image; (b) The ROI data is replaced by noise; (c) The resulting quadtree decomposition.
 (a)
(a)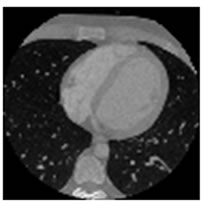 (b)
(b)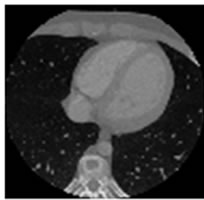 (c)
(c)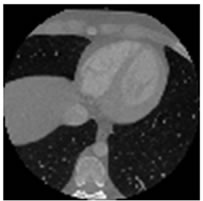 (d)
(d)
Figure 7. CT test images downloaded from MeDEISA [9] and referenced as (a) IM112. dcm; (b) IM130; (c) IM152; (d) IM170. dcm, in image set “CT_data_1”.
 (a)
(a)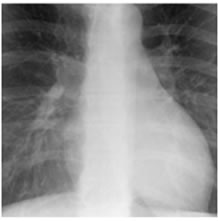 (b)
(b)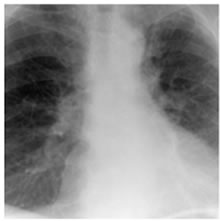 (c)
(c)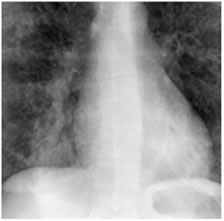 (d)
(d)
Figure 8. XR2DLung test images downloaded from MeDEISA [9] and referenced as (a) XR2DLung1. dcm; (b) XR2DLung2. dcm; (c) XR2DLung11. dcm; (d) XR2DLung12. dcm.
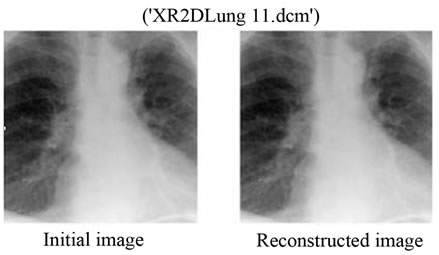
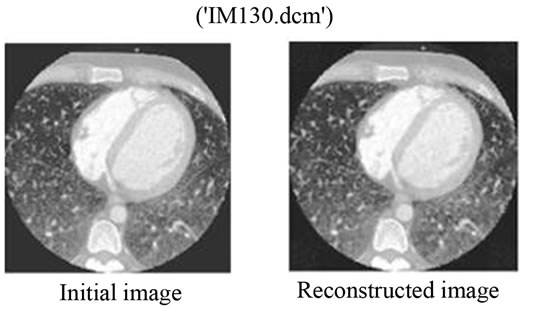
We can say that for bitrates r ≥ 0.50 bpp for JPEG2000, it would be more interesting to use the proposed Multimodal Compression scheme instead of compressing the image and the signal separately. Figures 9 and 10 show the original and the reconstructed images for XR2DLung 11. dcm (Figure 9(a)) and IM130. dcm (Figure 10(a)), respectively. Two images are compressed at a bitrate of 0.05 bpp with JPEG2000 encoder following the proposed method. The value of 0.05 bpp is chosen to show the worst case performance.
Moreover, Figures 11 and 12 show original and extracted
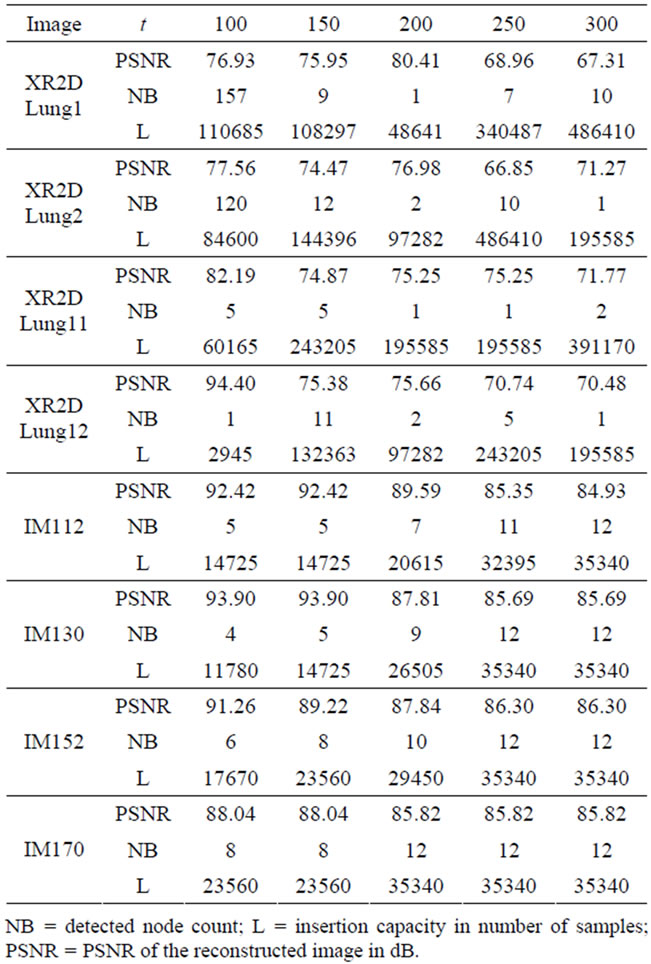
Table 1. Evaluation of the quality on reconstructed images and the insertion capacity for different threshold parameters.
 (a) (b)
Figure 9. (a) The initial image of “XR2D Lung11. dcm”; (b) The reconstructed image with the proposed method. The bitrate used for the JPEG2000 compression here is 0.05 bpp.
ECG and EEG signals from their respective images, hence those are XR2DLung11 for the ECG signal, IM130 for the EEG signal. As it can be verified from the figures and from Table 1, the resulting decoding error for reconstructed signals are in acceptable limits.
 (a) (b)
Figure 10. (a) The initial image of “IM130. dcm”; (b) The reconstructed image with the proposed method. The bitrate used for the JPEG2000 compression here is 0.05 bpp.
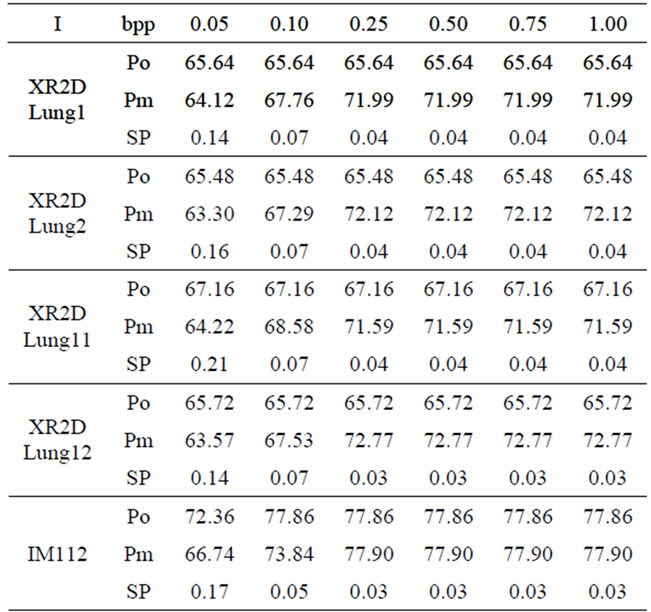
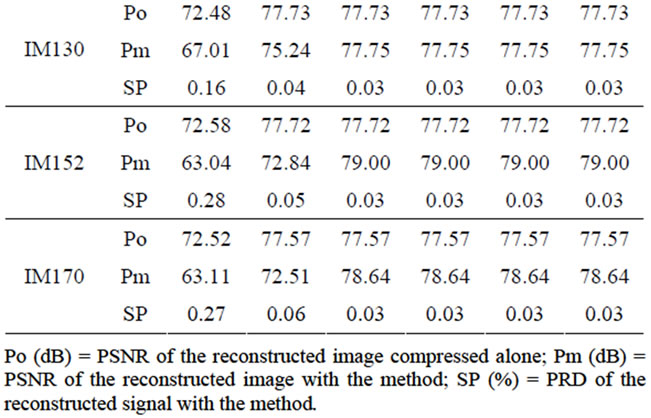
Table 2. Comparative study of Po, Pm and Sp with different bitrates chosen for Jpeg2000 compression.
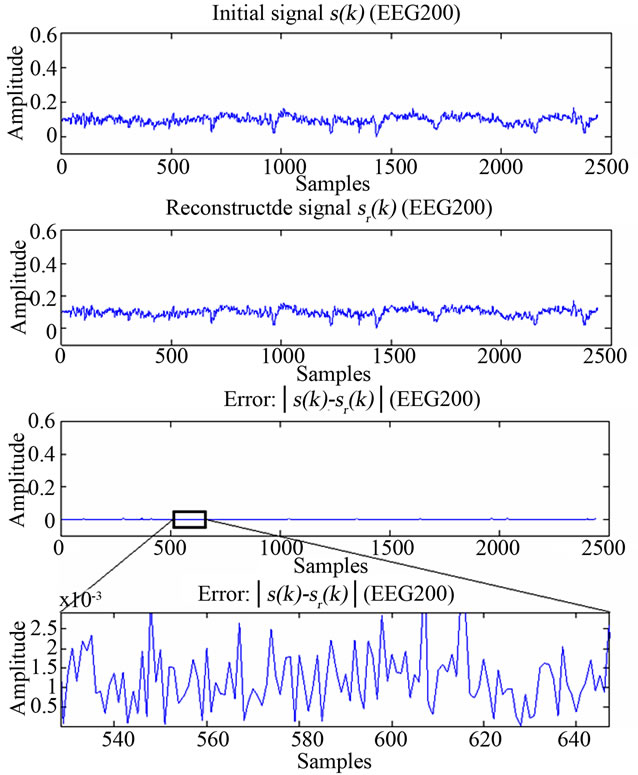
Figure 11. Figure showing reconstructed signal quality of EEG200.
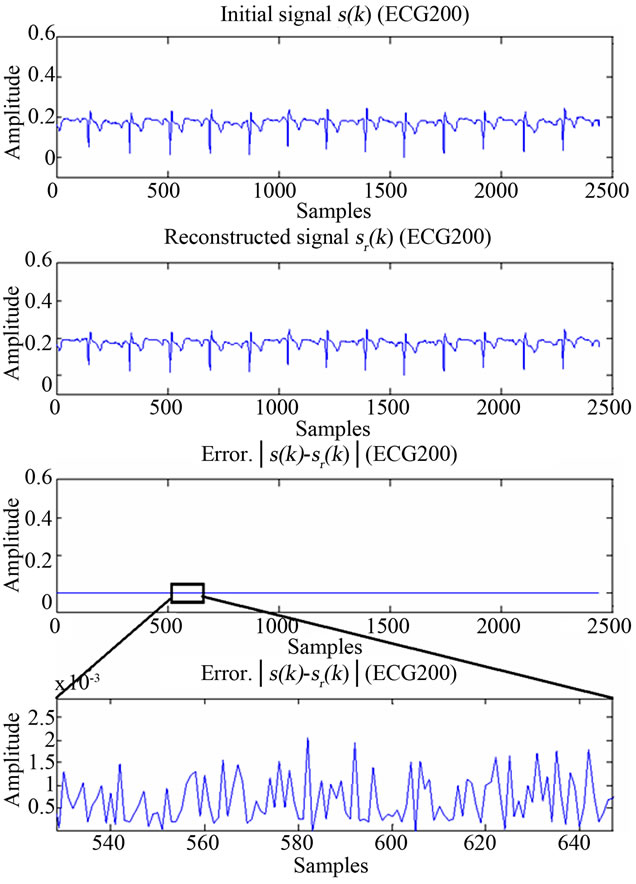
Figure 12. Figure showing reconstructed signal quality of ECG200.
4. CONCLUSIONS
The MC approach described in this paper is highly modular in the sense that it can be used with any other codec (i.e. not especially JPEG2000).
With the MC approach, it is more beneficial to maintain biosignals and images related to a patient, in a mixture image, instead of stocking them in separate physical units. As a consequence, this approach can reduce effectively the need of storage requirements.
The proposed method is also suited to dealing with a limited bandwidth. It can be employed through a single transmission channel instead of two distinct channels, one for the image and the other for the biosignal. This can be particularly useful for telemedicine applications.
As a perspective, the method can also be applied on volumetric images using 3D codecs, such as 3D SPIHT. More specifically, the idea consists in including (by extending the 2D scheme) signal samples in sub-volumes by avoiding the Region of Interest. In addition, the multimodal compression can be used for videos, by processing frames, separately.
REFERENCES
- Cetin, A.E., Koymen, H. and Aydin, M.C. (1993) Multichannel ECG data compression by multirate signal processing and transform domain coding techniques. IEEE Transactions on Biomedical Engineering, 40, 495-499. doi:10.1109/10.243411
- Nave, G. and Cohen, A. (1993) ECG compression using long-term prediction. IEEE Transactions on Biomedical Engineering, 40, 877-885. doi:10.1109/10.245608
- Nait-Ali, A. and Cavaro-Menard, C. (2008) Compression of biomedical images and signals. Wiley, London.
- Zeybek, E.H., Amine, N.-A., Christian, O. and OuledZaid, A. (2007) A novel scheme for joint multi-channel ECG-ultrasound image compression. Proceedings of Engineering in Medicine and Biology Society, 29th Annual International Conference of the IEEE, Lyon, 2007, 713-716.
- Naït-Ali, A., Zeybek, E.H. and Drouot, X. (2009) Introduction to multimodal compression of biomedical data. Springer, Berlin, Heidelberg, 2009, pp. 353-375.
- Thévenaz, P., Blu, T. and Unser, M. (2000) Interpolation Revisited. IEEE Transactions on Medical Imaging, 19, 739-758.
- Finkel, R. and Bentley, J.L. (1974) Quadtrees: A data structure for retrieval on composite keys. Acta Informatica, 4, 1-9.
- Naït-Ali, A., Cavaro-Menard, C. and Zeybek, E. (2007) MeDEISA. http://www.medeisa.net
- Batista, L., Melcher, E.U.K. and Carvalho, L.C. (2001) Compression of ECG signals by optimized quantization of discrete cosine transform coefficients. Medical Engineering & Physics, 23, 127-134. doi:10.1016/S1350-4533(01)00030-3