iBusiness
Vol.1 No.2(2009), Article ID:1054,11 pages DOI:10.4236/ib.2009.12015
A Note on Secondary Buyouts-Creating Value or Recycling Capital
![]()
1European Business School, Department of Finance, Accounting and Real Estate, Oestrich-Winkel, Germany; 2Tech University Darmstadt, Department of Business Administrations, Economics and Law, Darmstadt, Germany.
Email: schiereck@bwl.tu-darmstadt.de
Received September 25, 2009; revised October 29, 2009; accepted November 31, 2009.
Keywords: Management Buyouts, Performance, Private Equity, Secondary Buyout
ABSTRACT
This paper analyzes whether secondary buyouts of private equity (PE) investors in general create value and therefore are a suitable alternative to exit strategies like trade sales and IPOs. Theoretically, two conflicting approaches might explain the use of secondary buyouts as an exit channel of private equity investors: the capital recycling effects and different potential sources of value creation. We present empirical tests of these approaches. The profitability of secondary buyouts is assessed by a comparison of exit multiples realized with secondary buyouts and trade sales. The results are not unequivocal, but overall we interpret our findings in a way that awards secondary buyouts a profitability that is not significantly different from trade sales. Therefore, we argue that secondary buyouts have the potential for adding value that arise from different sources like the reduction of agency costs or the functions of the financial investor. Secondary buyouts should thus not be seen as a second best alternative for recycling the PE investors’ capital in situations where alternative—and supposedly more attractive—exit channels are unavailable.
1. Introduction
The profitability of a private equity (PE) investments critically depends on the realization of a successful exit strategy to terminate an investment [1,2] Throughout the 1990s and until the year 2000, PE investments were primarily exited through initial public offerings (IPOs) [3]. Later, this once highly attractive exit channel for PE investors was not longer attractive or available anymore. Because of the sluggish economy and the dwindling acquisition funds of corporations, the sale of equity shares to trade buyers also decreased. Thus, due to highly difficult market conditions, the traditional investment exit routes, IPOs and trade sales, turned out to be highly challenging [4].
Our study analyzes the return realized by secondary buyouts—the sale of a PE investor’s equity stake in a portfolio company to another PE fund—as one possible exit alternative. The lack of alternative exit opportunities may be one reason why secondary buyouts as a means of rolling over PE investments were more and more taken into consideration over the last years [5–7]. But the bright future prospects which promise the secondary market for PE shareholdings to further grow significantly [8], underlines that it is not only the high liquidity of PE investors, who are looking to invest their free funds, that drives the market [4]. One specific characteristic of a secondary sale is that only the equity of the financial investor is sold; the entrepreneur remains in possession of his equity share of the company [9]. Obviously, a secondary buyout will only be realized if the purchaser of the minority equity share can also expect the realization of an appropriate risk-adjusted return on this investment. Thus, as a prerequisite, the retiring financial investor must not have been able to use all available growth potentials of the company into a financial gain or the new investor has to possess specific supplementary knowhow. From that perspective, a secondary buyout either can still generate value or is only used when other sale alternatives are not suitable for the portfolio company. It remains ex ante not clear why other financial investors should “see potential in a company their competitor is already trying to exit, unless their views are widely divergent?” [10].
Thus, a secondary buyout may only serve the PE investor to recycle his funds invested. However, an argument for wealth creation can be seen in that a secondary buyout is typically used during the expansion phase of a portfolio company, because different financial investors engage in different lifecycle phases of a company. Thus, the acquiring investor may still be able to use his different expertise in order to maximize firm value. We study if secondary buyouts in general create wealth, where these potentials for value can be found, or whether secondary buyouts are merely used as a second best alternative in order to recycle capital in a situation where alternative exit channels are unavailable. Overall, the potential profitability of secondary buyouts will be derived by a comparison of secondary buyouts to alternative exit strategies, using data from worldwide exit transactions from 1999 until 2004.
PE investments can be defined as minority participations in the equity of companies that are not publicly listed at a stock market [11]. These kinds of investments have “a strict finite life with an expected duration of a few years [11]1 and the nature of the investment usually requires a high degree of direct involvement by the investor.” [12,13] The overriding importance of an efficient exit strategy thereby results from the fact that most of the PE investor’s return arises in the form of capital gains at the time of the exit, and not through cash flows during the investment period [8,9].
The paper is organized as follows: Chapter 2 gives an introduction to exit channels fro PE investments. After that, Chapter 3 focuses on secondary buyouts and how they impact exit values. Chapter 3 describes different sources of capital recycling effects caused by secondary buyouts. Opposing to that, Chapter 4 continues by introducing several wealth creating hypothesis from secondary buyouts. Chapter 5 represents the main part of this paper, with an empirical examination of secondary buyouts’ profitability compared to alternative exit methods. Finally, Chapter 6 will give a brief summary as well as a short outlook.
2. Secondary Buyout Exits and Their Impact on Exit Values
The most important characteristic of a secondary buyout exit is that the equity share of the financial investor is passed on to a second PE investor. Thus, the wealth creating potential of a secondary buyout results from the value-adding services and the involvement of the new financial investor in the portfolio company. Since the company remains independent, both the entrepreneur’s and the PE investor’s efforts will contribute to the success of the venture [14,15].
The financial investor serves several functions that are for the benefit of the portfolio company’s value. His value-adding services include “a combination of financial capital, monitoring and advisory services, and reputational capital”, [6] and he makes significant contributions beyond the money provided to the portfolio companies [16,17]. The financial investor often brings in his expertise in financial engineering and helps in negotiating with potential corporate customers; he contributes his experience and contacts. Overall, an intensive involvement is crucial for portfolio companies since an increase of the firm value can be achieved through the investor’s activities [18–20].
3. Capital Recycling By Secondary Buyout Exits
The term capital recycling should comprise all cases where a secondary buyout is either chosen by the retiring PE investor because an IPO or a trade sale is not available, or where a secondary buyout results in a situation where no real value is added by the acquiring financial investor, i.e. only wealth redistribution effects are used to increase exit value.
Secondary buyouts as second best alternatives for exit -The PE investor’s value added will decline over the time of the investment, as the portfolio firm matures [21]. A hypothesis by Cumming and MacIntosh states that a PE investor will exit from an investment when the projected marginal value added—resulting from his investment efforts—is less than the projected marginal cost of these efforts. Thus, the exit will occur at a point in time when the financial investor’s skill set is exhausted and the firm value cannot be further increased [22]. Deriving from this hypothesis, a central argument for secondary buyouts to be only a means of capital recycling is that a second financial investor can hardly be able to realize a positive return on investment since the former investor—now seeking the exit–has already exploited the means of increasing firm value [23]. Thus, secondary buyouts can be seen as a second best alternative in order to recycle the selling financial investor’s capital and reinvest it in new ventures [6]. An indication can be seen in the fact that PE participations often trade at a discount in the market for secondary buyout companies.
Re-capitalizations (recaps) can be seen as a special form of a secondary buyout. It is used especially for companies with high free cash flows [24]. In a recap, the company is newly levered, based e.g. on the current EBITDA. The residual portion of the equity which exceeds the total firm value at that time flows back to the PE investor, so that he can pull out his invested equity [24]. Thus, a recap does not involve the sale to a new PE investor. Re-leveraging investments can be realized e.g. via securitisations, high yield debt offerings or sales and lease-backs [5]. A re-capitalization or re-leveraging of the portfolio company can be seen as a way of recycling capital, since no new “real” value is added by the transaction. The refinancing by the PE investor may be seen as a means of effecting exit for those portfolio companies for which other, more profitable, transactions were not available [8].
4. Value Creation Effects
The central question of this paper is, whether secondary buyouts are a qualified exit channel through which wealth can be created, so that the financial investor can realize a positive capital gain through the termination of his investment [20]. In this paper, it is assumed that wealth will be created if the buyer of the equity shares is able to add value to the portfolio company. If he is, he will be in the position of paying a price that enables the seller to realize a successful exit, that is comparable to an IPO or a trade sale exit. Value creation by the new owner can occur through several means. As already pointed out, it is the new owner’s ability to resolve information asymmetries in valuing the firm, and his ability of monitoring the management and of resolving agency problems after the exit, that has an influence on the choice of exit. Since the acquiring PE investor may be superior in these abilities, a secondary buyout may turn out to be a favourable exit compared to other alternatives.
Reduction of agency costs—Corporate managers are the agent for their equity investors as the principals, a relationship that is usually impaired by agency costs. It is assumed that the managers, if left alone, will attempt to act in their own self-interest [25,26]. Such an agency conflict is also possible for portfolio companies financed with PE [27]. In a secondary buyout, the portfolio company’s equity is acquired by a new financial investor, and it is this characteristic that is a potential source of value creation. The new PE investor is said to be better at overseeing and guiding the enterprise than a pool of small investors, thereby mitigating agency costs [28]. When compared to an IPO as exit channel, a secondary buyout has a clear advantage. In a public company, management’s tendency to pursue its own interests is combined with the dispersed stockholders’ inability to observe and precisely assess management’s effort and its outcomes [29,30]. This conflict “creates a moral hazard and can lead to departures from the generally assumed principle of value maximization.” [31] A secondary buyout exit, in contrast, results in ownership structures that are more efficient in resolving agency conflicts. They have the potential to increase firm value because the governance structure of the portfolio company after the exit provides stronger incentives for managers to operate firms efficiently [32]2.
Monitoring by the new owners-After a secondary buyout, the portfolio company is largely controlled by the new PE investor, which results in a potential superiority of secondary buyouts over e.g. IPOs from the monitoring aspect of reducing agency costs. Since the financial investor has a high equity interest in the corporation, he has a strong incentive to monitor the management so that he can ensure that it follows only the most profitable strategies that increase firm value. Because of his substantial equity position, he is more interested in monitoring the managers’ actions [33,34] than dispersed stockholders in a public firm are [35]3. Additionally, due to his expertise in the field of PE investments, he has a comparative advantage in monitoring the management. As a consequence of this diligent monitoring, the private secondary buyout company is likely to show better performance due to superior management decisions and commitment [36–40].
Reduction of information asymmetries - The problem of information asymmetries acknowledges that information is distributed unevenly in the business environment; management and investors have different information about a corporation’s situation and prospects [41]. Information asymmetries are particularly developed in public companies where management has a better idea of the actual and potential performance of the firm than outside—and often uninformed—investors. In contrast to this, a secondary buyout company is controlled by the financial investor as an inside investor who not only provides capital but who also is actively involved in the portfolio company and is very well informed about the firm’s future and investment opportunities. PE investors have a strongly developed experience in the concerned industries and are better able to reduce information asymmetries than most stockowners in a public company, thereby reducing one component of the agency cost [38,42–44].
Reduction of the overinvestment problem and finance staging—The overinvestment problem results from the limited liability of the entrepreneur. Since he uses the money of investors in his venture, a situation may arise where the entrepreneur wants to continue to invest in a project even when it has a negative net present value. As long as there is some probability that the investment will turn out to be successful, the entrepreneur will invest as long as he will be provided with capital [41]. This overinvestment problem can be solved if the financing comes from the PE investor after the secondary buyout. He plays the role of an inside investor and observes private information about the project’s profitability [38]. For solving the overinvestment problem, the financial investor uses a staged capital commitment, i.e. he commits only a fraction of the capital needed for achieving certain milestones. Subsequent financing is dependent on the successful completion of these intermediate objectives [38,39,45].
Transaction synergies, economies of scope and learning curve effects—In general, PE investors have lower than average information-gathering costs. They can benefit from transaction synergies, i.e. they gather the information about potential portfolio companies on behalf of a number of investors in PE funds [43,44,46]. They can use economies of scope because they invest in different ventures, thereby being able to creating a network of referral sources, service providers like attorneys and accountants and industry contacts. Also, a PE investor profits from learning curve effects in that he can use information produced for one proposal for subsequent proposals, thereby dramatically reducing information-gathering costs. These three sources of savings are especially developed for investors who specialize in certain industries [28,47]. Because of the transaction synergies, the economies of scope and the learning curve effects, a PE investor acquiring a portfolio company in a secondary buyout might be able to bid higher prices, thereby increasing the rate of return that the retiring financial investor can realize. Additionally, the new PE investor may be able to use his expertise and information base in order to guide this knowledge into value-adding actions for the portfolio company.
5. Data and Methodology
The following empirical examination aims at testing the introduced theories—capital recycling and value creating theories for secondary buyouts—for practical relevance.
The purpose of the following empirical examination is the analysis of the profitability of different exit transactions. Profitability in this context is defined as the value that the retiring PE investor can realize with the exit transaction. Thus a higher exit profitability will lead to a higher realized return on investment for the financial investor and is therefore in accordance with the object of exit value maximization. The comparison of different exit channels’ profitability will be used in order to determine whether secondary buyouts are value creating or not. It is assumed that secondary buyouts can create wealth if they provide comparable profitability to those exit strategies which are widely described to be superior exit forms in the literature. If the profitability of secondary buyouts turns out to be inferior to alternative exit strategies, they are assumed to be merely a means of recycling capital. This would also indicate that secondary buyouts are chosen primarily for lower quality portfolio companies.
In order to be able to compare alternative exit strategies with each other and in order to draw a conclusion whether secondary buyouts are competitive exits compared to IPOs, trade sales, or MBOs, a ranking order hypothesis for the four different exit strategies is developed in a first step. IPO exits appear to be the most desirable exit for high quality, rapid growth firms for which PE investors derive most of their returns. The listing at a public market is unique in its ability to supply capital on a large scale and to spread risk. IPOs have the potential to maximally enhance the PE investor’s reputation and that of the portfolio company. The IPO may result in a public profile for the firm that facilitates the sale of its products or services and that assists in future capital raising efforts. As a result, the IPO exit is hypothesized to be the most desirable form of exit. Of course, only portfolio firms that surmount specific hurdle sizes and growth rates are suitable candidates for IPOs, so that other exit alternatives must be taken into consideration for companies that are not saleable in the public market [22].
Trade sales are considered to be the second best form of exit, following IPOs. One of the great advantages is the ability of the acquirer to generate transaction synergies [23]. A trade sale will be especially attractive when the firm’s technology is highly complementary to technologies possessed by the strategic acquirers. Additionally, the strategic acquirer in a trade sale will be uniquely well positioned to monitor and discipline the management of the portfolio company [34,48].
MBOs are hypothesized to be an inferior form of exit. MBOs result in no transaction synergies and are typically used for investments with no potential for alternative exits. Even though post-exit managerial incentives will be high, managers may tend to prefer non-financial objectives, in particular indulging a leisure preference. Additionally, since the entrepreneurs usually do not have the funds to affect a MBO, they will need large amounts of debt financing, which in turn will only be available at great cost [6].
Secondary buyouts, finally, are hypothesized to be on average inferior to an IPO and a trade sale, but superior to a MBO. Since the acquirer will purchase less than 100 percent of the portfolio company’s equity in a secondary buyout, the incentive and ability to monitor post-exit will be less than in connection with a trade sale, thereby lowering the value of the purchase to the acquirer. Secondary buyouts may be slightly inferior with respect to trade sales in reducing agency costs. Since the portfolio company is usually integrated into another company after a trade sale, and since the entire equity stake is acquired by the buyer, the new owners have the total monitoring and decision control over the operations, which often results in a high control premium [24].
However, secondary buyouts have more capacity than MBOs to generate high returns, since a high valuing acquirer may be content to purchase the equity shares of the retiring PE investor, and may be willing to pay a high multiple to effect this purchase. Additionally, a secondary buyout will bring on board a new actively involved monitor with specialized knowledge [49]. The different functions and tasks of the new financial investor will often enhance the value of the firm and will hence increase the buyer’s willingness to pay [22]. Overall, the alternative exit channels can be ranked in the order IPO, trade sale, secondary buyout, and MBO. If this ranking order is confirmed in the following examination of exit multiples, this could be assessed as an indication for secondary buyouts to be merely a means of capital recycling. If this ranking order cannot be confirmed, the empirical examination would be supporting the value adding potential of secondary buyouts.
Examination of exit multiples realized with secondary buyouts—The data comprises four different exit multiples—turnover multiples, EBITDA multiples, EBIT multiples and earnings multiples – from secondary buyout, trade sale and MBO transactions worldwide, recorded by www.mergermarket.com. The examined exit transactions took place during a time period from 1999 to 2004. In total, the data set comprises 63 secondary buyout transactions, 36 MBO transactions, and 96 trade sales [50] In addition to the exit multiples for each registered transaction, the available data includes the industry group for the respective portfolio companies as well as the turnover, EBITDA, EBIT and earnings of the portfolio companies at the time of the exit transactions. This allows a categorization of the total data set into industry groups and into groups of companies with comparable levels of turnover and EBITDA levels respectively.
In order to make a statement about the profitability of secondary buyouts, four different exit multiples for secondary buyout transactions will be compared to exit multiples for MBOs and trade sales. Since IPOs are assumed to be a superior form of exit [6,49,51], and since exit multiples for private exit transactions are hardly comparable to exit multiples realized with IPOs [39]4, the paper confines itself to a comparison between the three mentioned methods of private exits.
In a first step, the total data set will be analyzed; thus, no grouping or clustering will be used. The mean multiples for the three exit channels will be compared for every multiple category so that there will be four different examinations.
In a second step, this procedure will be applied to the data set categorized into the different industry groups, in order to gain more specific insights and results. In a third step, the clusters of companies with comparable levels of turnover and EBITDA will be analyzed. In order to examine whether there is sufficient evidence to conclude that the multiples for different exit strategies differ significantly from each other, an analysis of variance (ANOVA) will be conducted following the described comparisons. Finally, the results of the empirical examination will be tested for their accordance with the hypothesized ranking order so that a statement about secondary buyouts’ value creation potential can be made as a central conclusion.
In the empirical examination, exit multiples are used in order to determine the profitability of secondary buyouts in comparison to trade sales and management buyouts. It is assumed that in a case where secondary buyouts show comparable or significantly higher exit multiples, this kind of exit strategy has the potential for wealth creation and is not only used as a second best alternative to recycle capital. The examined data comprises four different exit multiples: turnover multiples, EBITDA multiples, EBIT multiples and earnings multiples. The exit multiples can be calculated by dividing the value of the exit transaction by the turnover, EBITDA, EBIT or earnings of the portfolio company at the time of the exit. Turnover, EBITDA, EBIT or earnings serve as reference values for the respective multiple. In a case where several portfolio companies have comparable reference values, the higher the exit multiple, the higher will be the value of the exit transaction. Therefore, a high exit multiple would indicate that the buyer of the equity shares attaches value to the portfolio company and was ready to pay a relatively high price, making the respective exit a value adding one. As a result, it is possible to compare exit multiples from different exit methods in order to determine which exit strategy is the most profitable one, resulting in the highest values of exit transaction.
A prerequisite for this procedure of examination comes from the use of multiples. Multiples should only be used among comparable companies, e.g. within peer groups, in order to ensure that these firms being used for comparison have similar characteristics [52]. For the examination in this paper, the companies whose exit multiples are being compared should have similar turnover, EBITDA, EBIT and earnings levels respectively. Otherwise, similar exit multiples for different exit strategies could arise even if the transaction values are highly different from each other. Thus, higher multiples would not unequivocally indicate higher transaction values and thus higher profitability. To sum up, a multiple’s value can be driven by two influence factors, the reference value and the transaction value. In order to be able to compare the different exit channels’ profitability unrestrictedly, the first influence factor has to be eliminated.
When determining the members of a peer group, i.e. the comparable firms, one should control for all the variables that can influence the multiple, in theory [52]. Because of the limited data set available for the empirical examination, the total data set is analyzed in a first step, even though it is assumed that the results are potentially biased because of possible differences in the reference values.
In a second step, peer groups are formed by dividing the transactions data into industry groups according to the industry sector of the portfolio companies. By this, at least a minimum of comparability between the exit multiples is achieved. However, when analyzing the results of this examination, one should always keep in mind that they could be biased. The fact that no two companies are exactly similar in terms of reference values, the definition of “comparable” firms is somewhat “vague” [52].
In a third step, several clusters are formed from the total data set based on the reference values. In other words, within one cluster, the analyzed exit multiples come from portfolio companies with similar turnover and EBITDA levels, respectively. By this clustering, the problem of missing clearness can be eliminated by some extent, i.e. a high multiple would necessarily indicate higher transaction values. This clustered analysis was only conducted for the turnover and EBITDA multiples since the clustered data sets for the remaining two multiples were too small in order to conduct a meaningful ANOVA.
In order to draw a conclusion about the competitiveness of secondary buyouts, one has to analyze the transaction multiples from each of the three exit categories. The objective thereby is to compare the means. With an analysis of variance (ANOVA) it is possible to determine whether there is sufficient evidence to conclude that the transaction multiples from at least one exit strategy on average differ significantly from at least one other exit strategy’s multiples. Since we have three data sets—multiples for secondary buyouts, MBOs and trade sales-, ANOVA is used, because this method uses the F distribution and can test the significance among multiple data sets simultaneously. Since we have one factor as the independent variable—namely the multiple—and three levels—secondary buyouts, MBOs and trade sales—we can use a single factor ANOVA. When a single factor is employed, the levels of the factor are called the treatments of the examination. Since ANOVA assumes that all of the data sets are normally distributed, the normality of the different data sets was assessed in a first step. This was done by computing the intervals ,
,  , and
, and  -where
  stands for the mean and s stands for the standard deviation-and by determining the percentages of measurements falling in each. This method is based on the properties of a normal distribution. Since the percentages were tested to be approximately equal to 68%, 95%, and 100% respectively, a normal distribution of the analyzed data sets could be assumed. ANOVA can therefore be applied. For all ANOVA examinations in this paper, a significance level of 0,05 is used. In the ANOVA examinations, two hypotheses are tested:
 : There is no significant difference among the exit multiples for the three exit categories.
 At least one of the exit channels shows multiples significantly different from at least on other exit channel’s multiples.
6. Results
As ANOVA only shows that a difference exists between at least two treatments, this leads to the question which of the means differ. A graphical representation is used to answer this question. First, the 95% confidence intervals on the mean are calculated for each data series. With the confidence intervals, upper and lower bounds according to the chosen confidence level are determined. The re sults are shown in an effects plot. The graphical representation emphasizes which means show a significant difference. If the intervals of two exit channels do not overlap, this means that their multiple means differ statistically significantly.
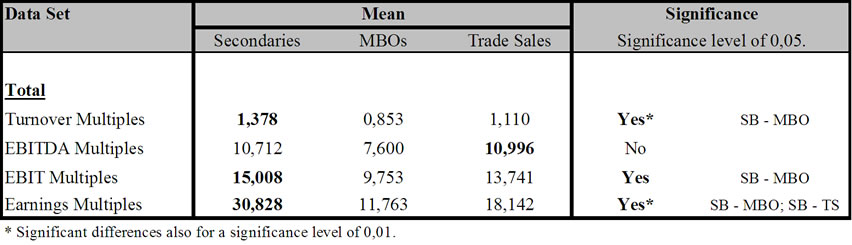
Table 1. Results summary of the empirical analysis of exit multiples—Total data set
In Table 1, an overview is given of the results of the empirical analyses of exit multiples. First, the examination of the total data set will be analyzed. Important to notice is, that secondary buyouts show the highest mean for turnover, EBIT and earnings multiples. Only for EBITDA multiples trade sales have a slightly higher mean. However, the differences found for the EBITDA multiples are statistically not significant for a significance level of α = 0,05. In contrast, the F values for turnover, EBIT and earnings multiples were higher than the F crit. values, so that the null hypotheses had to be rejected in these cases. Thus, significant differences were found where multiple means were highest for secondary buyouts. The effects plots drawn for the four multiple categories show that there is a significant difference between secondary buyouts and MBOs for the turnover multiples and for the EBIT multiples; and there is a significant difference between secondary buyouts and MBOs and between secondary buyouts and trade sales for the earnings multiples. In the mentioned cases, the bars-representing the confidence intervals added on and
subtracted from the means—do not overlap.
Concerning the examination of the data divided up into industry groups, results are similar to the total data set results in that secondary buyouts in most cases showed the highest multiple means. Trade sales had the highest means in only four of the 15 data sets analyzed; means for MBOs were always lower than those of at least one alternative exit channel. However, when analyzing the exit multiples for the industry groups, onlyfor the turnover multiples in the leisure category can be found a statistical significance between secondary buyouts and management buyouts. For all other data sets, the ANOVA showed no significant differences in the multiple means. The results for this second examination method are summarized in Table 2.
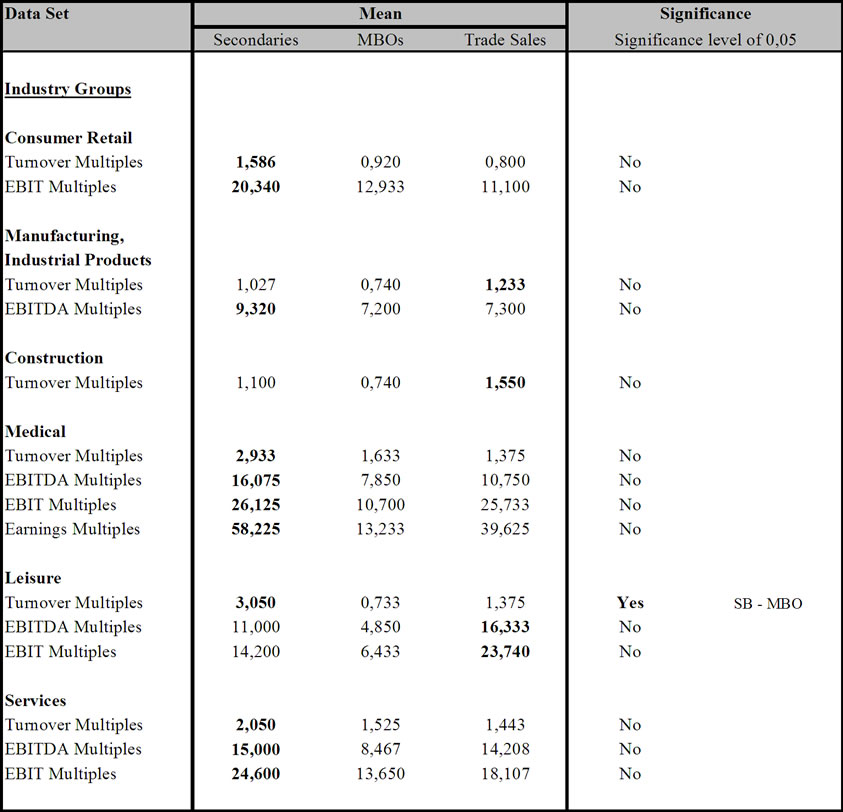
Table 2. Summary of results of the empirical analysis of exit multiples—Industry Groups
Concerning the clustered ANOVA analyses summarized in Table 3,
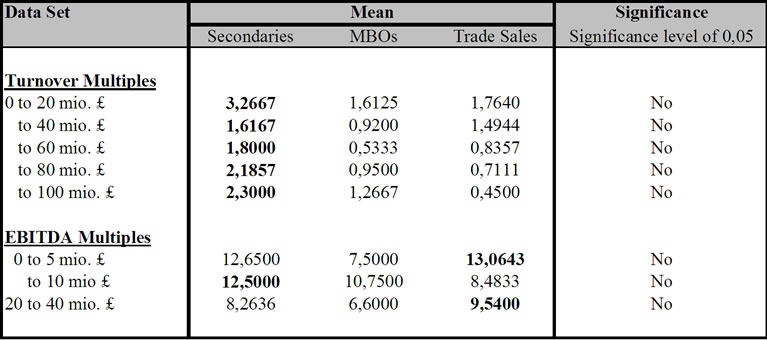
Table 3. Summary of results of the empirical analysis of exit multiples–Clusters
again secondary buyouts showed the highest means in most of the analyzed cases, but no significant differences between secondary buyouts, trade sales and MBOs could be found at all.
To sum up the results, it can be said that in all three different methods of examination, secondary buyouts showed the highest multiple means in most cases. In all other cases, trade sales had the highest average means. Management buyouts were always inferior to at least on other category of exit strategy. However, significant differences between the multiple means for secondary buyouts, trade sales and MBOs were only found in the examination of the total data set and for the industry group leisure for the turnover multiple. Concerning the total data set analysis, significant differences were proven between secondary buyouts and MBOs in three cases (turnover multiples, EBITDA multiples, and earnings multiples) and between secondary buyouts and trade sales in one case (earnings multiples). Relating to the established ranking order hypothesis, these results are more or less in harmony with the hypothesized superiority of secondary buyouts over MBOs. In contrast, the results for the relationship between secondary buyouts and trade sales seem to deviate from the ranking order. While the theory predicts trade sales to be a more profitable exit channel than secondary buyouts, the results of the empirical examination indicate that secondary buyouts are at least of equal quality, showing comparable or even higher exit multiples than trade sales. However, these first results are probably of little explanatory power because the total data set may not exclusively comprise comparable companies with similar reference values. Therefore, the results should be seen with caution and one should always keep in mind the assumptions that have been made.
In contrast, the industry group examination and the analyses of the clustered groups should yield more reliable results. For both methods no significance—with exception of the industry group leisure for the turnover multiple–between the exit multiples of the three exit channels was discovered. This result is also in contradiction with the hypothesized ranking order. Secondary buyouts not only seem to be a competitive exit strategy— as opposed to trade sales—but also provide multiples that are as high or even higher as the supposedly superior trade sale exits. This would indicate that secondary buyouts result in transaction values that are comparable to those of trade sales. While MBOs had consistently lower multiple means than secondary buyouts and/or trade sales, no statistical significance could be found here either. Thus, according to these results, management buyouts could not be ranked as an inferior exit strategy per se.
When considering the results of the two last examination methods, some restrictions have to be made here as well. It is true that the grouping into industry sectors and the clustering resulted in a comparison of a more peer group like data set, but simultaneously reduced the data sets dramatically. In some cases, there were only three multiples left for one exit category. Thus, the small data sets could turn out as a problem by introducing biases because they are not representative anymore [53].
The discussed empirical examination is suitable to make concrete statements about the profitability of secondary buyouts. All three different methods applied validate the discovery that secondary buyouts are a competitive exit strategy compared to trade sales, and are therefore not only a second best alternative that is chosen when alternative exits are not available in order to recycle capital. However, potential biases in the examinations cause the existence of two different potential explanations for these results. One possibility is that secondary buyouts indeed have value adding potentials that could arise from the various sources already described in detail. Due to the new financial investor’s functions and the value creation effects, secondary buyout candidates are highly valued by the potential buyer, which in turn drives up the transaction values realized in secondary buyouts. As a result, secondary buyout transaction values are comparable to those realized with trade sales, the exit method that is widely regarded as a superior form of exit in the literature [49]. Since therefore the retiring PE investor would be able to realize the same return on investment with these two exit alternatives, he should be indifferent when choosing between these two—in a case where portfolio characteristics would allow the availability of both. Also, the results indicate that secondary buyouts are a superior form of exit compared to management buyouts. This result is in accordance with the literature, describing MBOs as a suitable exit form mainly for moderately successful companies with stable cash flows [24].
Another possibility is that the empirical results were driven by potential biases in the data sets. Distortions can especially be suspected for the results of the examinations of the total data set because of the limited comparability of the exit multiples due to unequal reference values. Additionally, problems may arise due to the varying amount of data for the three different exit channels compared in the examinations. The amount of transaction data for MBOs was much smaller than for secondary buyouts and trade sales, which may cause biases due to the restricted representativeness. Additionally, the classification of the exit multiples according to the portfolio companies’ industry groups and reference values resulted in relatively small data sets, causing similar potential biases and therefore limited explanatory power. Thus, it remains possible that secondary buyouts indeed do not have value creation potential and are therefore only a means of recycling capital. However, the fact that in no case was found a significant superiority of trade sales over secondary buyouts could be seen as a hint that reality shows a tendency towards the first explanation. Overall, all the findings should be considered as merely hypothetical.
7. Conclusions and Outlook
The central subject of examination in this paper has been the question whether secondary buyouts in general create value and are therefore a suitable alternative to exit strategies like trade sales and MBOs. In a theoretical part, two main hypotheses were discussed: the capital recycling effects of secondary buyouts and different potential sources of value creation. These theories were tested in an empirical examination.
It was assumed that secondary buyouts would be potentially value adding exit channels, if their profitability would be comparable to that of trade sales. The profitability was therefore assessed by a comparison of exit multiples realized with secondary buyouts and trade sales. The results were not unequivocal, but could be interpreted in a way that awards secondary buyouts a profitability that is not significantly different from trade sales as an exit strategy that is often assumed to be superior with respect to the realized returns on investment. Therefore, it could be argued that secondary buyouts have the potential for adding value that could arise from different sources like the reduction of agency costs, the functions of the financial investor etc. as introduced in the theoretical part of this paper. Secondary buyouts should thus not be seen as a second best alternative for recycling the PE investors’ capital in situations where alternative—and supposedly more attractive—exit channels are unavailable. This argumentation can be underpinned with the expected development of the market for secondary buyouts. The worldwide market for secondary buyout portfolio companies currently comprises a volume of about USD 10 bill. Experts estimate that this volume will increase to over 25 percent of all effected transactions worldwide in the coming years, and will thus play a highly important role in the financial markets. Additionally, completed transactions in secondary buyouts which have been highly successful, can be seen as prove that secondary buyouts are not merely a temporary solution.
REFERENCES
- Thies, A., “Steuerliche optimierung bei buy outs durch pe-gesellschaften,” in M&A Review, pp. 479–484, November 2003.
- Bance, A., “Special paper–why and how to invest in PE, an EVCA investor relations committee paper,” European PE & Venture Capital Association, 2002, http://www.evca.com.
- Bascha, A. and Walz, U., “Financing practices in the German venture capital industry: an empirical assessment,” Working Paper, University of Tübingen, February 2001, available on the Social Science Research Network (SSRN) Electronic Library at: http://ssrn.com/abstract=267572.
- Köhler, P., and SCHÖNAUER, F., “Bankfusionen lassen Angebot am Beteiligungsmarkt anschwellen, Überschneidungen in den Firmenportfolios—Kreditinstitute geben Private-Equity-Geschäft ab,” in Handelsblatt, No. 17, pp. 26, January 26, 2004.
- Sonter, D. and Fountain, K., “Alternative exits,” in Venture Economics, w/o y., available at: http://www.ventureeconomics.com.
- Black, B. S. and Gilson, R. J., “Venture capital and the structure of capital markets: Bank versus stock markets,” in Journal of Financial Economics, No. 47, pp. 243–277, 1997.
- Sormani, A., “Exits: The IPO alternative,” in EVJC, pp. 20–23, November 2002, http://www.evjc.com.
- Wright, M., Chiplin, B., Thompson, S., and Robbie, K., “Realisation of venture capital investments: The case of management buyouts in the UK,” in The Service Industries Journal, No. 10, 499–520, 1990.
- Cumming, D. J. and Fleming, G., “A law and finance analysis of venture capital exits in emerging markets,” Working Paper, University of Alberta and Australian National University, February 2003.
- Laine, M. and Torstila, S. “The exit rates of liquidated venture capital funds,” May 2003, available on the Social Science Research Network (SSRN) Electronic Library at: http://ssrn.com/abstract=417641.
- Timmreck, C., “Beteiligungsgeschäft in Deutschland,” in M&A Review, No. 5, pp. 225–229, 2003.
- Wang, C. K. and Sim, V. Y. L., “Exit strategies of venture capital-backed companies in Singapore,” in Venture Capital, No. 3, pp. 337–358, 2001.
- Sahlmann, W. A., “The structure and governance of venture-capital organizations,” in Journal of Financial Economics, No. 27, pp. 473–521, 1990.
- Hellmann, T., “IPOs, acquisitions and the use of convertible securities in venture capital,” Working Paper, Graduate School of Business, Stanford University, December 2000, available on the Social Science Research Network (SSRN) Electronic Library at: http://ssrn.com/abstract=257608.
- Houben, E., “Venture capital, double-sided adverse selection, and double-sided moral hazard,” December 2002, available on the Social Science Research Network (SSRN) Electronic Library at: http://ssrn.com/abstract=365841.
- Sapienza, H. J., ‘When do venture capitalists add value?” in Journal of Business Venturing, No. 7, pp. 9–27, 1992.
- Cumming, D., Franzke, S., and Walz, U., “Kann es eine Venture Capital-Industrie ohne Börsengänge geben? Notwendigkeit der Finanzierung von Innovationen—IPO ist attraktivste Exit-Lösung—Pool erfahrener VCs steht für den nächsten Aufschwung zur Verfügung,” in BörsenZeitung, No. 10, pp. 19, January 16, 2004,.
- Sapienza, H., Manigart, S., and Vermeir, W., “Venture capitalist governance and value-added in four countries,” in Journal of Business Venturing, No. 11, pp. 439–469, 1996.
- Schwienbacher, A., “An empirical analysis of venture capital exits in Europe and in the United States,” Berlin Meeting Discussion Paper, July 2002, available on the Social Science Research Network (SSRN) Electronic Library at: http://ssrn.com/abstract=302001.
- Prester, M., “Exit-strategien deutscher venture capital Gesellschaften,” Betriebswirtschaftliche Schriftenreihe Band 87, Münster, 2002.
- Smith, G. D., “Control over exit in venture capital relationships,” 2001, available on the Social Science Research Network (SSRN) Electronic Library at: http://ssrn.com/abstract=272231.
- Cumming, D. J. and Macintosh, J. G., “Venture capital exits in Canada and the United States,” in University of Toronto Law Journal, Vol. 53, pp. 101–200, 2003, available on the Social Science Research Network (SSRN) Electronic Library at: http://ssrn.com/abstract=321641.
- Wall, J. and Smith, J., “Better exits, results of a survey of the venture capital exit market and guidance on how venture capitalists can improve exit performance,” Price Waterhouse Corporate Finance, 1998.
- Achleitner, A., “Handbuch investment banking,” 2 Editon, Wiesbaden, 2000.
- Jensen, M. C., “Agency costs of free cash flow, corporate finance, and takeovers,” in American Economic Review, No. 76, pp. 323 – 329, 1986.
- Ross, S. A., Westerfield, R. W., and Jaffe, J. F., “Corporate finance,” 6 Editon, New York, 2002.
- Barney, J., Busenitz, L., Fiet, J., and Moesel, D., “The structure of venture capital governance: An organisational economic analysis of relations between venture capital firms and new ventures,” in Academy of Management Proceedings, pp. 64–68, 1989.
- Fried, V. H. and Hisrich, R. D., “Towards a model of venture capital investment decision making,” in Financial Management, pp. 28–37, Autumn 1994.
- Jensen, M. C., “Eclipse of the public corporation,” in Harvard Business Review, No. 67, pp. 5, 1989.
- Lehn, K. and Poulsen, A., “Free cash flow and stockholder gains in going private transactions,” in: The Journal of Finance, No. 44, pp. 771–787, 1989.
- Frankfurter, G. M. and Gunay, E., “Management buyouts: The sources and sharing of wealth between insiders and outside shareholders,” in Quarterly Review of Economics and Finance, No. 32, pp. 82–95, 1992.
- Liebeskind, J., Wiersema, M., and Hansen, G., “LBOs, corporate restructuring, and the incentive-intensity hypothesis,” in Financial Management, Vol. 21, No. 1, pp. 73–88, Spring 1992.
- Brous, P. A. and Kini, O., “The valuation effects of equity issues and the level of institutional ownership: Evidence from analysts’ earnings forecasts,” in Financial Management, pp. 33–46, Spring 1994.
- Chen, S. S., Ho, K. W., Lee, C. F., and Yeo, G. H. H., “Wealth effects of pe placements: Evidence from singapore,” in The Financial Review, No. 37, 2002, pp. 165– 184.
- Kieschnick, R. L., “Management buyouts of public corporations: An analysis of prior characteristics,” in AMIHUD, Yakov: Leveraged management buyouts—Causes and consequences, New York, pp. 35–67, 1989.
- Deangelo, H. and Deangelo, L., “Management buyouts of publicly traded corporations,” in Financial Analysts Journal, pp. 38–49, May–June 1987.
- Deangelo, H., Deangelo, L., and Rice, E. Y., “Going private: Minority freezeouts and stockholder wealth,” in Journal of Law & Economics, No. 27, pp. 367–402, 1984a.
- Admati, A. R. and Pfleiderer, P., “Robust financial contracting and the role of venture capitalists,” in: The Journal of Finance, No. 49, pp. 371–402, 1994.
- Barry, C. B., “New directions in research on venture capital finance,” in Financial Management, No. 23, pp. 3–15, 1994.
- Opler, T. and Titman, S., “The determinants of leveraged buyout activity: Free cash flow vs. financial distress costs,” in: The Journal of Finance, No. 48, 1985–1999.
- Martola, J. M., “Developing a framework for venture capitalists to increase the value of investments,” Working Paper, Helsinki University of Technology, February 2002.
- Gompers, P. A., “Optimal investment, monitoring, and the staging of venture capital,” in Journal of Finance, No. 50, pp. 1461–1489, 1995.
- Triantis, George G., “Financial contract design in the world of venture capital,” 2001, available on the Social Science Research Network (SSRN) Electronic Library at: http://papers.ssrn.com/paper.taf?abstract_id=258392.
- Dushnitsky, G. and Lenox, M. J., “When does corporate venture capital investment create firm value?” Working Paper, September 2003.
- Siemes, M., “Going private unter Beteiligung von Finanzinvestoren in Deutschland,” Dissertation European Business School Oestrich-Winkel, Auflage, Wiesbaden, 2003.
- Chan, Y., “On the positive role of financial intermediation in allocations of venture capital in a market with imperfect information,” in Journal of Finance, No. 38, pp. 1543–1561, 1983.
- Norton, E. and Tenenbaum, B. H., ”Specialization versus diversification as a venture capital investment strategy,” in Journal of Business Venturing, No. 8, pp. 431–442, 1993.
- Cumming, D. J. and Macintosh, J. G., “The extent of venture capital exits: Evidence from Canada and the United States,” University of Toronto Law and Economics Research Paper, No. 01–03, October 2000, available on the Social Science Research Network (SSRN) Electronic Library at: http://ssrn.com/abstract=250519.
- Cumming, D. J. and Macintosh, J. G., “A cross-country comparison of full and partial capital exits,” in University of Toronto Law and Economics Research Paper No. 01–04, May 2002, available on the Social Science Research Network (SSRN) Electronic Library at: http://ssrn. com/abstract=268557.
- w/o a, Deals: Result Summaries, available at: http://www. mergermarket.com/deals/dealSummary.asp?npid=500& contextid =4788927, date of retrieve: 26.01.2004.
- Cole, S., “Exits and entrances,” in CA Magazine, Vol. 130, No. 7, pp. 41–42, 1997.
- Damodaran, A., “Investment valuation—tools and techniques for determining the value of any asset,” New York, 1996.
- Mcclave, J. T., Benson, P. G., and Sincich, T., “Statistics for business and economics,” 8 Edition, New York, 2001.
NOTES
1PE investments usually have a duration of up to ten years.
2The argumentation for LBOs can be applied to secondary buyout companies, since both types are characterized by a limited number of outside investors.
3According to Kieschnick (1989), monitoring in the private secondary buyout company becomes even more effective due to the avoided free-rider problem in public corporations, where investments made in monitoring managerial actions benefit all shareholders so that any individual shareholders has too little incentive to invest in these monitoring activities.
4Multiples of PE backed IPOs could e.g. be influenced by reputation and signalling effects rather than performance per se.