Journal of Geographic Information System
Vol.6 No.1(2014), Article ID:43099,8 pages DOI:10.4236/jgis.2014.61008
Impact of Terrain and Cloud Cover on the Distribution of Incoming Direct Solar Radiation over Pakistan
1Institute of Space and Earth Information Science, Chinese University of Hong Kong, Hong Kong, China
2Shenzhen Research Institute, Chinese University of Hong Kong, Hong Kong, China
3Baluchistan University, Quetta, Pakistan
Email: shahzad@cuhk.edu.hk, renguang@cuhk.edu.hk, iftigeog@gmail.com
Copyright © 2014 Shahzad Sultan et al. This is an open access article distributed under the Creative Commons Attribution License, which permits unrestricted use, distribution, and reproduction in any medium, provided the original work is properly cited. In accordance of the Creative Commons Attribution License all Copyrights © 2014 are reserved for SCIRP and the owner of the intellectual property Shahzad Sultan et al. All Copyright © 2014 are guarded by law and by SCIRP as a guardian.
Received December 18, 2013; revised January 18, 2014; accepted January 25, 2014
KEYWORDS
Rugged Terrain; Solar Radiation; Distributed Model; Pakistan; GIS; DEM
ABSTRACT
This study investigates the spatial distribution of direct solar irradiation on rugged terrain over Pakistan. Digital elevation model (DEM), observational data of solar radiation from 6 meteorological observatories located in Pakistan and 5 meteorological observatories located in China were used in the present study. This conjunction is based on the same climatic conditions. MODIS Level-2 (L2) cloud fraction products and observational data of cloud cover from 21 meteorological observatories in Pakistan were incorporated to quantify the cloud cover influences on solar radiation amount and spatial distribution. The emerging field of remote sensing and GIS makes it possible to calculate solar radiation with finer spatial resolution and better understanding of terrain and cloud effects. ArcGIS with RS platform were used to simulate the model for direct solar radiation for the first time over Pakistan region. The results show clear quantitative influences of local topography and cloud cover on the DSR. Similarly, the area (east of Indus river) affected by monsoon receives less solar radiation during summer compared to the west of the Indus River.
1. Introduction
Distributing modeling is the emerging technique to analyze the spatial and temporal variability of solar radiation, particularly over the rugged terrain. The knowledge of the solar radiation distribution over time and space is becoming more and more vital due to the growing interest in solar energy utilization [1]. Incoming direct solar radiation (DSR) is the main contributor of incoming solar radiation to earth because it adds the most to the energy balance and also the other components depend on it [2]. The understanding of the DSR distribution both temporally and spatially is one of the imperative needs for understanding of thermodynamic or dynamic processes involved in energy exchange, which can be applicable in agricultural planning [3], architectural design [4], and engineering [5]. Solar radiation energy exchange also plays a key role in surface water circulation [6]. For these reasons, analysis of the incoming solar radiation distribution in Pakistan is important. As seasonal and latitudinal variations are well understood and described; only recent studies analyzed topographic variability in diurnal and seasonal radiation patterns over a region or locally [7].
Topography is one of the major factors determining the amount of incident solar energy radiation at a particular location [8]. The complexity of topography due to variations in altitude, slope, aspect and surface nature makes the radiation spatial distribution more complicated [9]. Pakistan’s north-south extension with complex and diversified terrain conditions and scarce network of observatories makes it difficult to measure the distribution of incoming solar radiation through an existing ground based network of observations.
So far, many domestic and international solar radiation estimation models based on flat surface observed data have been established [10]. There are many factors which make topographic solar radiation modeling more complex, such as complexity of physical based solar radiation formulation, insufficient observed data and lack of suitable modeling tools [8]. Since the late seventies of the last century, a series of distributed models for land surface have been developed rapidly, but the progress in the solar radiation estimation over the rugged terrain is not much significant [11-13]. Therefore, to explore new ways of estimating solar radiation over the undulating terrain and other space-time spatial and temporal distribution of volatile elements is of great theoretical significance and has wide application prospects. Till now, there is no published work on the distribution of DSR linked with terrain effect over Pakistan.
2. Study Area
Pakistan lies between latitudes 24˚N - 37˚N and longitudes 62˚E - 75˚E, covering a total land area of 796,096 km2 (www.gov.pk). The geography of Pakistan is a blend of landscapes varying from plains to deserts, forests, hills, and plateaus ranging from the coastal areas of the Arabian Sea in the south to the mountains of the HinduKush, Karakoram Himalaya range in the north. Pakistan is divided into three major geographic areas: the northern highlands; the Indus River plain, and the Baluchistan Plateau. The northern highlands of Pakistan contain the Karakoram, Hindu Kush and Pamir mountain ranges and some of the world’s highest peaks, including K2 (8611 m /28,251 ft) and Nanga Parbat (8126 m/26,660 ft). The Baluchistan Plateau lies to the west, and the Thar Desert in the east. An expanse of alluvial plains lies in Punjab and Sindh along the Indus River. The 1609 km (1000 mi) Indus River and its tributaries flow through the country from the Kashmir region to the Arabian Sea [14,15] Furthermore, 23.8% area of Pakistan is semi-arid, 56% is arid, 3.6% is mesodermal with dry winter and 16.1% is alpine [16] (Figure 1).
3. Data and Method
3.1. Meteorological Data
About 22 years data of daily global incoming solar radiation (1978-2000), 29 years data of monthly cloud cover and monthly sunshine duration (1979-2008) are provided by Pakistan Meteorological Department. The data for cloud cover and sunshine duration were processed for 21 stations, while for solar radiation, 6 meteorological observatories data from Pakistan (only Global Solar Radiation) and 5 meteorological stations from China (Direct and Global Solar Radiation) were processed. Data from Pakistan remain the pronounced concern of apprehension throughout the research period in terms of quality and availability. The continuity the data of solar radiation can be categorized into two groups, one from 1979 to 2000

Figure 1. Landform details for Pakistan.
and other from 2001 to 2008. The data in group one is used for simulation due to relatively better consistency in terms of availability, while the data from 2001 to 2008 is used to compare the results (only for Global Radiation).
3.2. Satellite and DEM Data
DEM over Pakistan is obtained from SRTM (Shuttle Radar Topography Mission at the website ftp://e0mss21u.ecs.nasa.gov/srtm. The data of 3 ArcSecond, which was obtained almost with 90m cell size, is employed in this paper. Moderate Resolution Imaging Spectroradiometer (MODIS) Level-2 cloud fraction product data were used to estimate cloud cover over Pakistan at a resolution of about ..
..
4. Methodology
To incorporate the cloud cover effect on DSR, MODIS cloud fraction data were processed and rectified using ground observed data of cloud cover on monthly mean basis using ArcGIS. Also, possible sunshine duration was corrected by DEM and used with rectified MODIS cloud fraction data to calculate the linear regression for obtaining fitted empirical coefficients for direct solar radiation.
According to the model given by [17] based on the theory of direct solar radiation over inclined surface [18], we have the following relation,
 (1)
(1)
where
 is the extraterrestrial solar radiation (ESR) quantity on slope,
  is incoming direct solar radiation (DSR) over rugged terrain,
  is ESR on flat surface and
  is direct incident solar radiation on flat surface. Given the values of
 ,
,  and
and , we get the distribution of direct solar radiation over rugged terrain.
Here,  is calculated by using the methodology given by [19], i.e.,
where
 is sun-earth distance correction factor,
  is solar declination,
  is solar hour angle at the beginning time of the possible sunshine duration (PSD),
  is solar hour angle at the ending time of the PSD,
  is ESR quantity falling on the slope from
  to
to , and T is the total time length of one day, i.e. 1440 min. The physical meaning of this equation is that ESR on a slope is determined by geographic, topographic and astronomic factors. Using PSD as the range of integration
 .
.
 is calculated by theoretical formulae [20], i.e.,
where
 is ESR amount on horizontal surface,
  is the time spac,
  is the solar constant and
  is calculated by meteorological data fitting statistical models [17], the detail of which is given below.
4.1. Horizontal Direct Incoming Radiation (Hb) Model
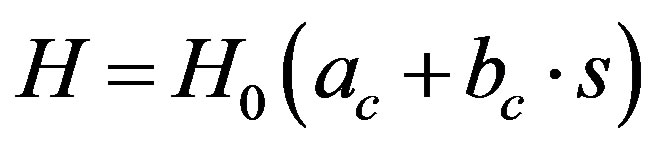
The model used for calculating direct solar radiation is given by [17].
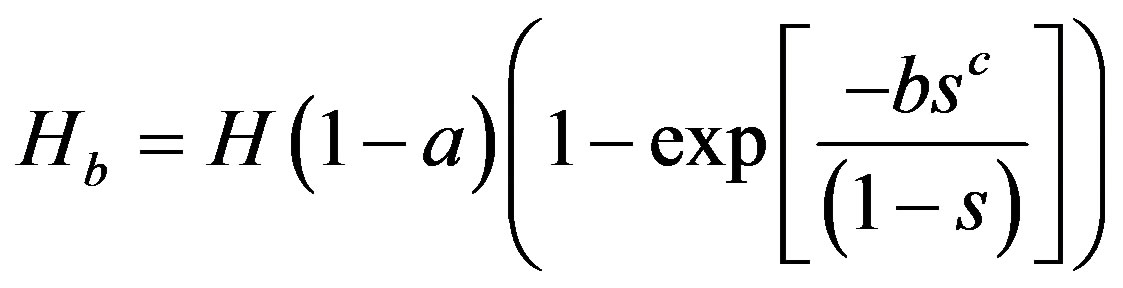 (2)
(2)
where  is global solar radiation quantity of flat surface,
  is relative sunshine duration,
  are empirical coefficients.
DSR observational data in Pakistan is not sufficient. Therefore, the compensatory method must be employed. Monthly DSRs of 5 stations of China were used for calculating DSR in Pakistan. Those 5 stations are located in China, having the semi-arid climatic conditions.
In Table 1, the statistical indices are square of correlation coefficient  and empirical coefficients a, b and c are given. During the study it has been found that monthly models (observational data of all stations of the same month are used) have higher accuracy and stability as compared to unified model (observational data of all stations are used to fit the model).
4.2. Average Global Horizontal Radiation (H) Model
Various studies show that global solar radiation  and relative sunshine duration
  are closely related [21,22] by using Angstrom-Prescott equation:
 (3)
(3)
where 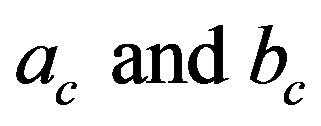 are empirical coefficients.
Using the close-fitting empirical coefficients of the 5 meteorological stations from China as given in Table 1, we get  (relative sunshine duration) of remote model and
  horizontal global solar radiation simulation.
By using Equations (2) and (3), we get the following relation.
 (4)
(4)
This equation only needs relative sunshine duration.
4.3. Statistics for Different Model for Global Solar Radiation
Table 2 shows the statistics of different models to get the
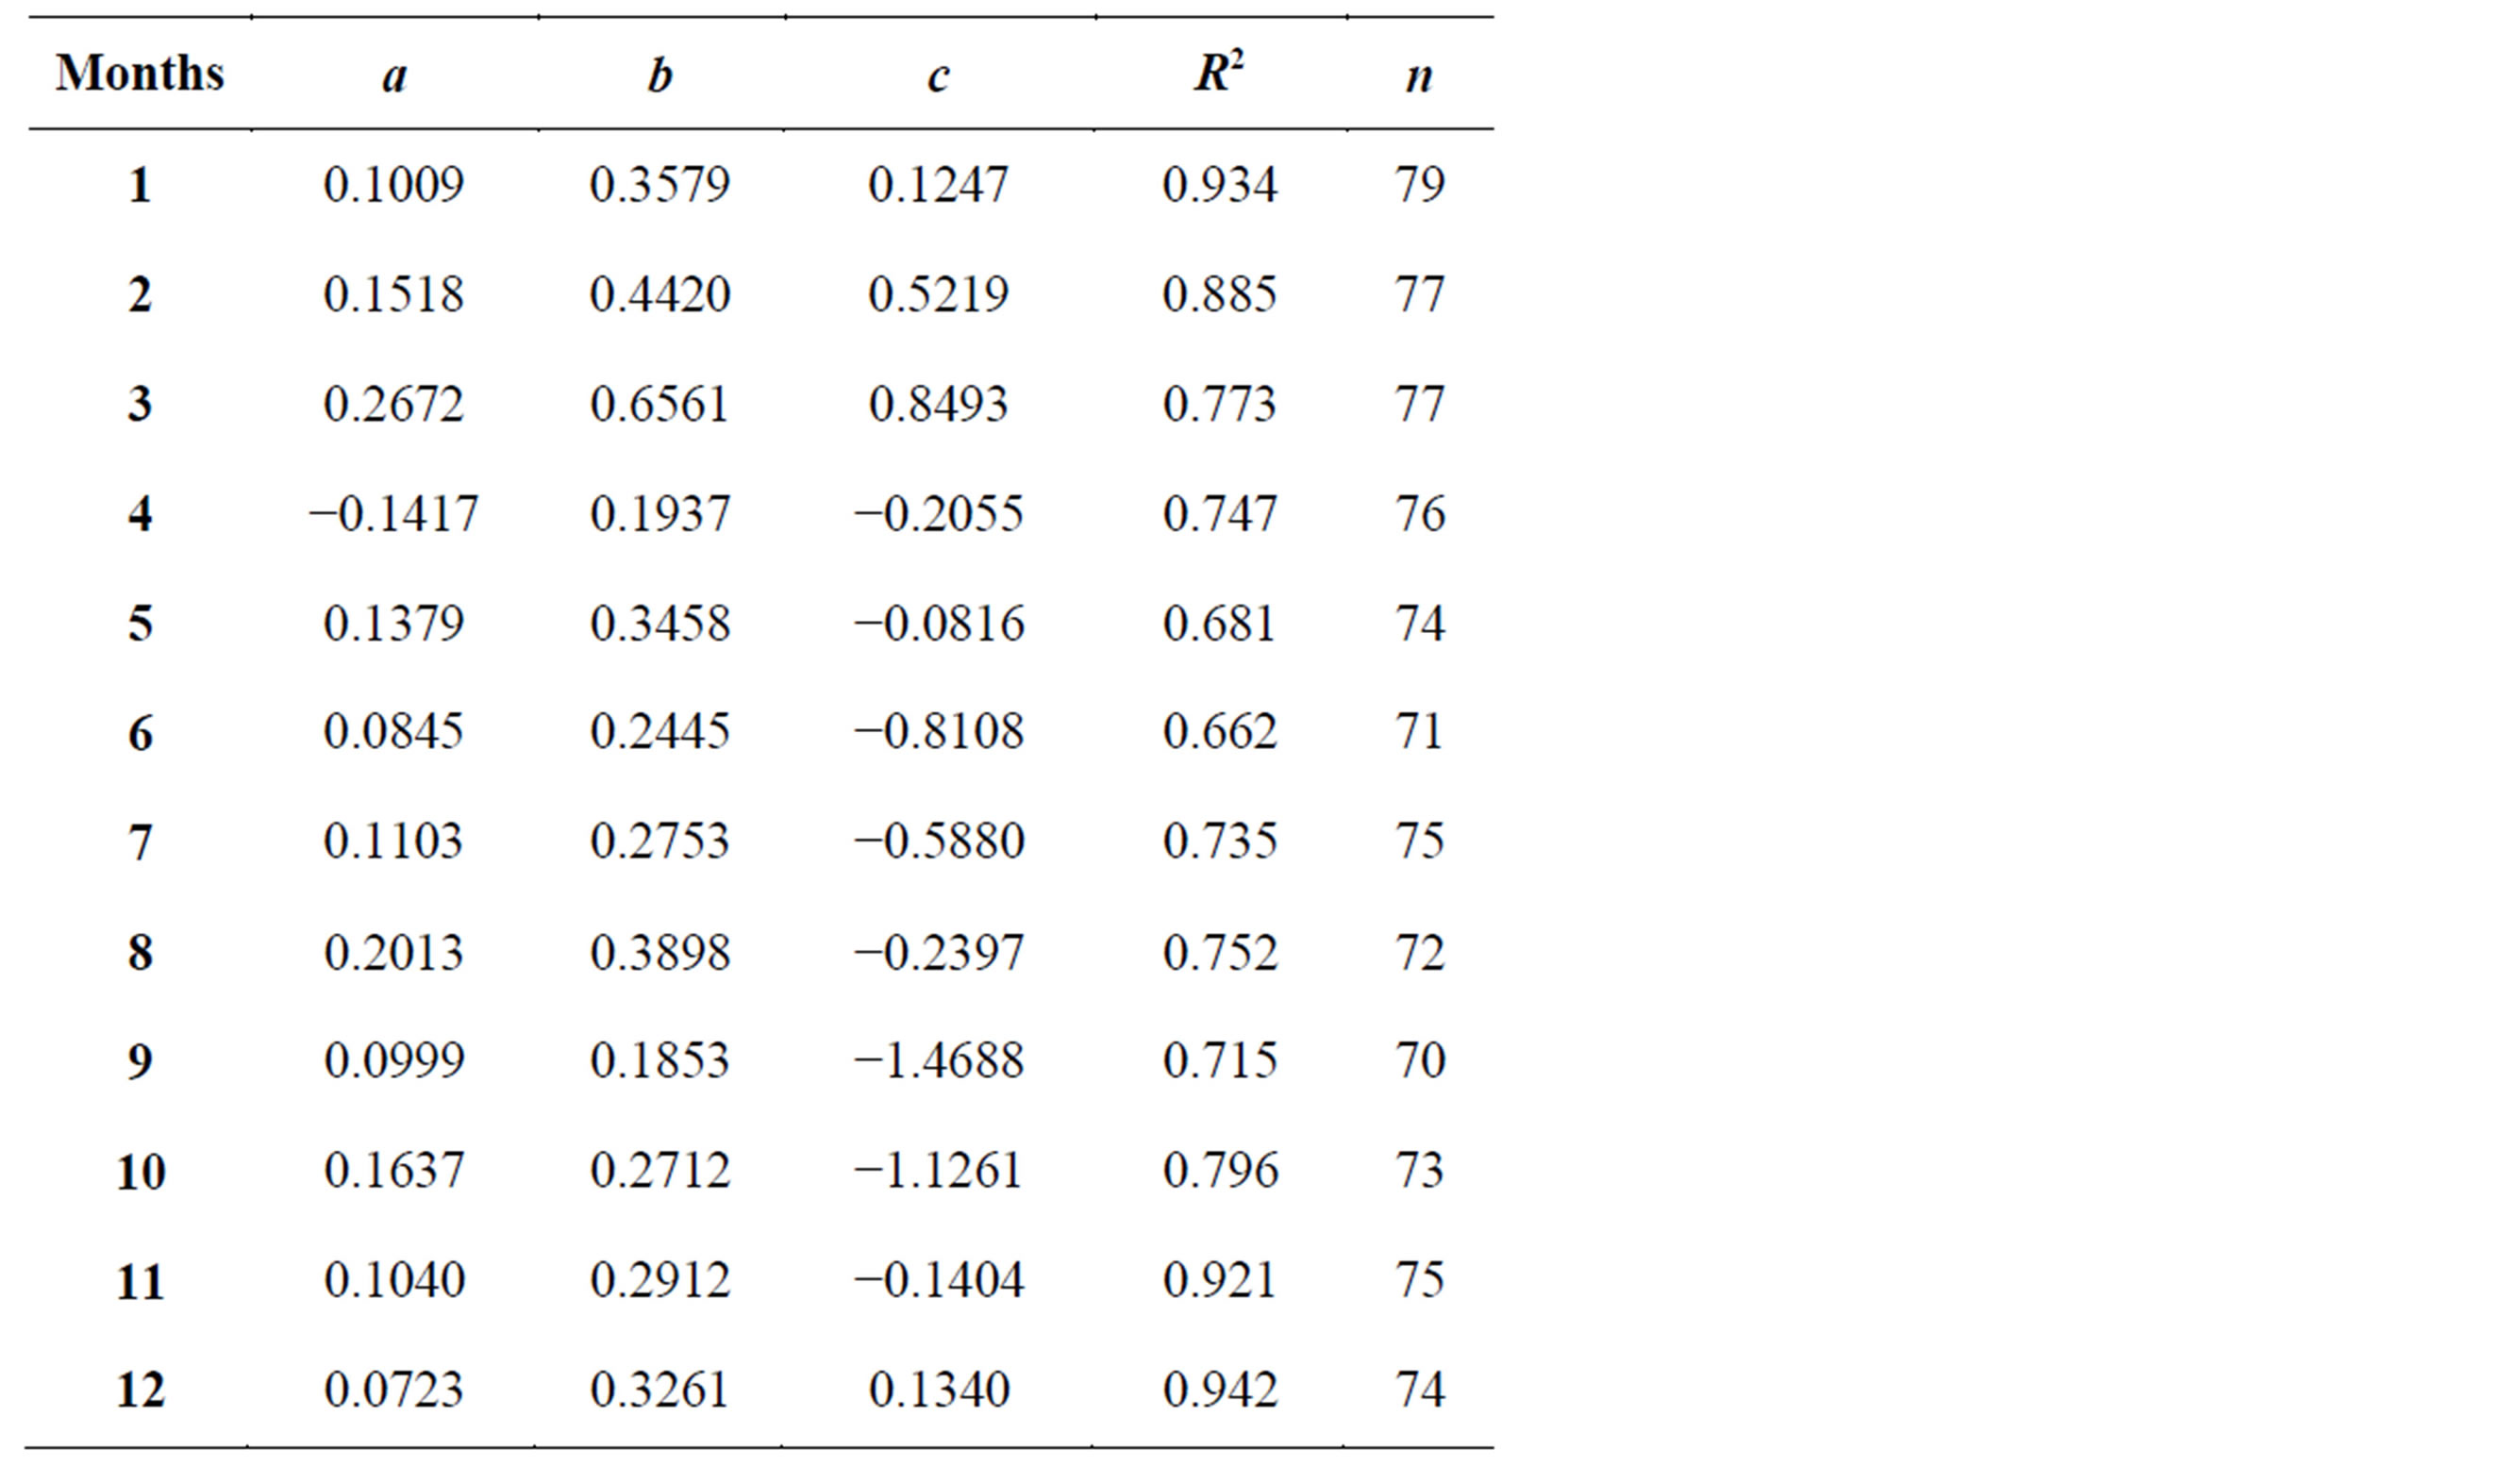
Table 1. Empirical coefficients of monthly models for horizontal direct solar radiation; here n is the sample length.


Table 2. Statistics for different model for global solar radiation.
optimized values for empirical coefficients a, and b to fit global radiation model (Equation (3)). Model-1 is the synthetic model considering 6 stations from Pakistan and 3 stations from China. Models 6-8 are offered by other scholars. Considering all these factors (e.g. fitting precision, sample amount, and relativity), Model-4 has the most optimal values as compared to others. Therefore, Model-4 values are considered to solve the average global horizontal radiation model (Equation (3)).
5. Results & Discussion
By using Equation (1), we get the DSR for the years 2006 & 2007 (mean monthly values are considered here) with resolution of  grid cell by incorporating DEM to analyze the terrain effect (Figure 2). The increasing trend from north to south, that is, latitudinal dependency is common in all resultsThe minimum annual values of DSR lies in Gilgit Baltistan and the surrounding areas, ranging from 727 to 1687 MJ×m‒2; while the maximum annual values are located in deserted areas of Baluchistan, Sindh and Punjab provinces, ranging from 5036 to 5720 MJ×m‒2
Figure 3 shows the distribution of DSR over the mountainous region of Pakistan in Indus upstream. There is a clear uneven distribution of DSR due to complex terrain, indicating the effect of local topography factors. The annual DSR quantity of sunny slope (or southern slope) of mountains is obviously larger than that of shady slope (or northern slope).
The observed data for DSR in Pakistan is only available for Quetta region. Therefore, results of simulation were being compared with high resolution solar maps produced by National Renewable Energy Laboratory [23] (Figure 4). The results with resolution of 4 km provided
Figure 2. Annual distribution of DSR (mean of 2006 & 2007) over rugged terrain of Pakistan.
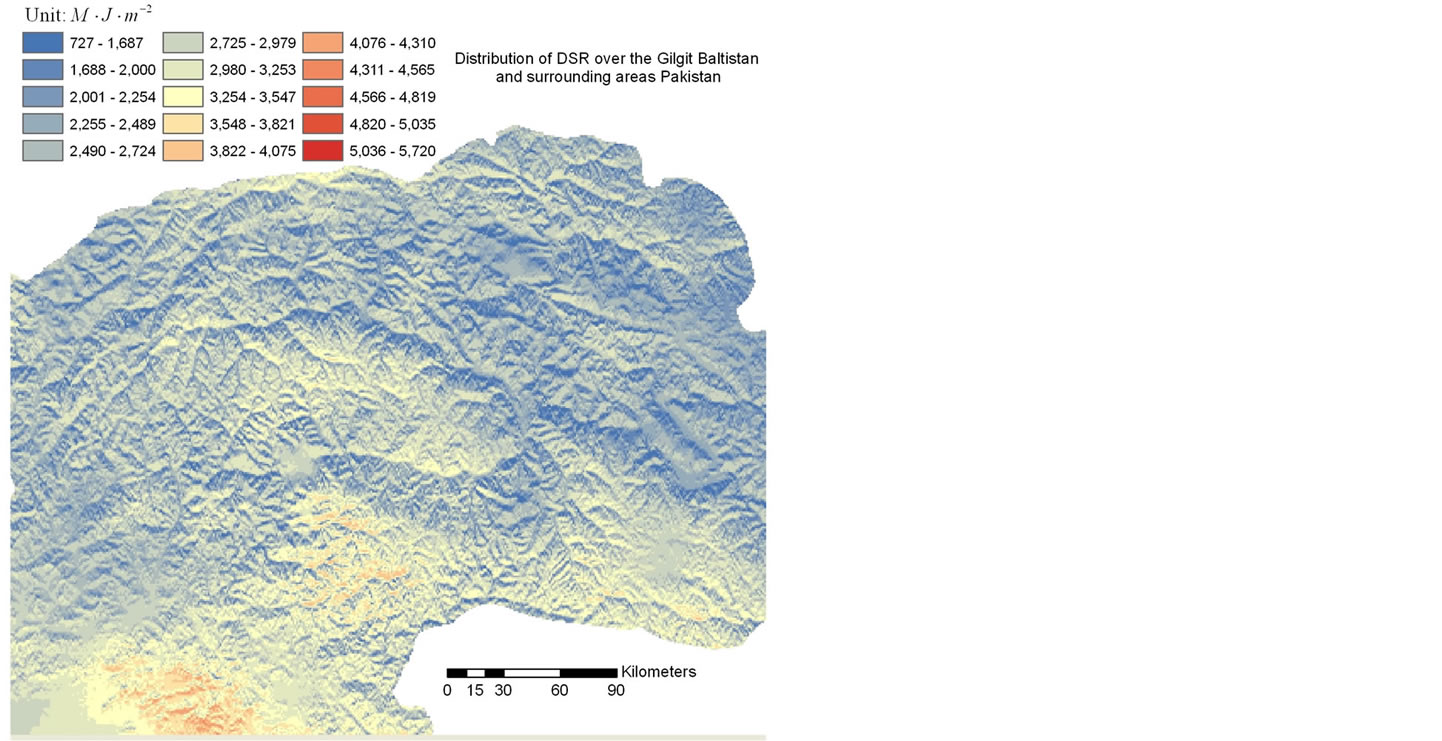
Figure 3. Distribution of direct solar radiation (mean of 2006 & 2007) over the mountainous region of Pakistan (Gilgit Baltistan).
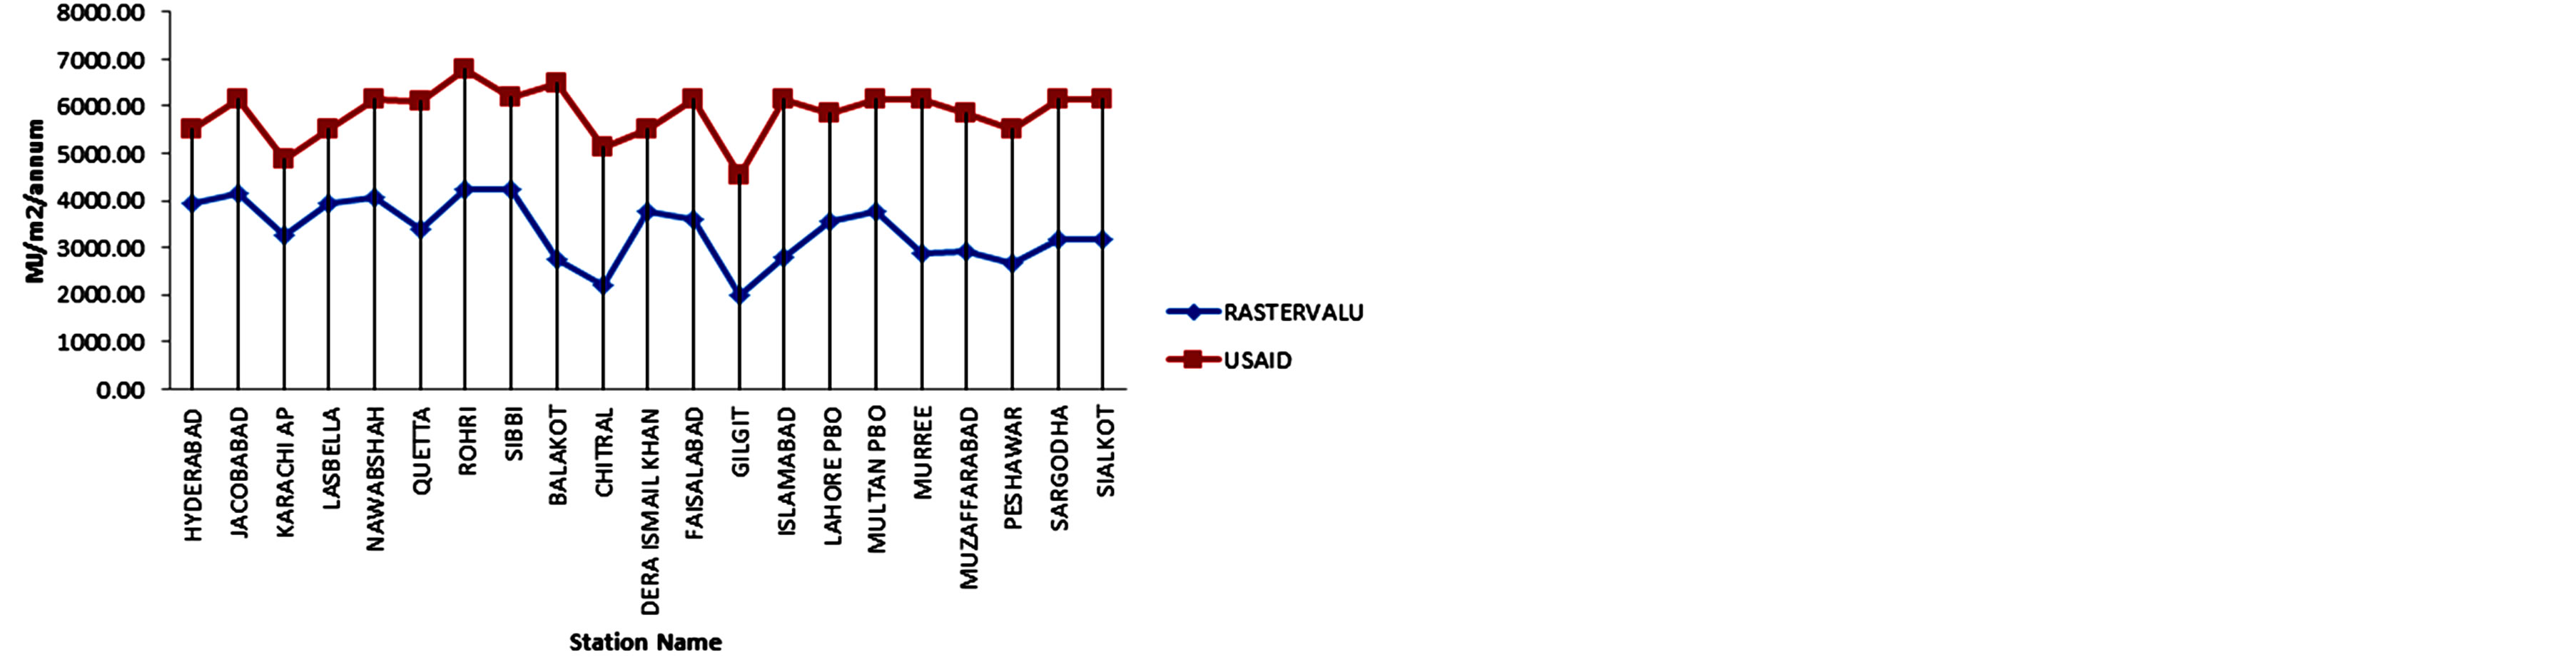
Figure 4. Comparison of simulated results of DSR using Equation (2) and USAID (NREL’s, 2010).
by NREL’s 2010 show a consistent variations except for Quetta region (North west of Pakistan) for annula DSR. The model based on equation 2 having resolution of 900 m by 900 m is relatively underestimating the DSR as compared to the NREL’s model. The possible reasons of less estimation of DSR are as follows. NREL’s simulation resolution is coarser, about 4 km; NREL’s simulation do not consider corrected cloud cover data; and NREL’s simulation also do not consider corrected data of possible sunshine duration based on topography. This is also revealed by a comparison of actual DSR data of Quetta region with NREL’s, which is overestimated by about 38%.
5.1. Seasonal Variations
Figure 5 depicts the mean seasonal variations of DSR for the year 2006 and 2007 over the rugged terrain of Pakistan. We compare the quantity of DSR during the monsoon and winter seasons. It is evident from the result that
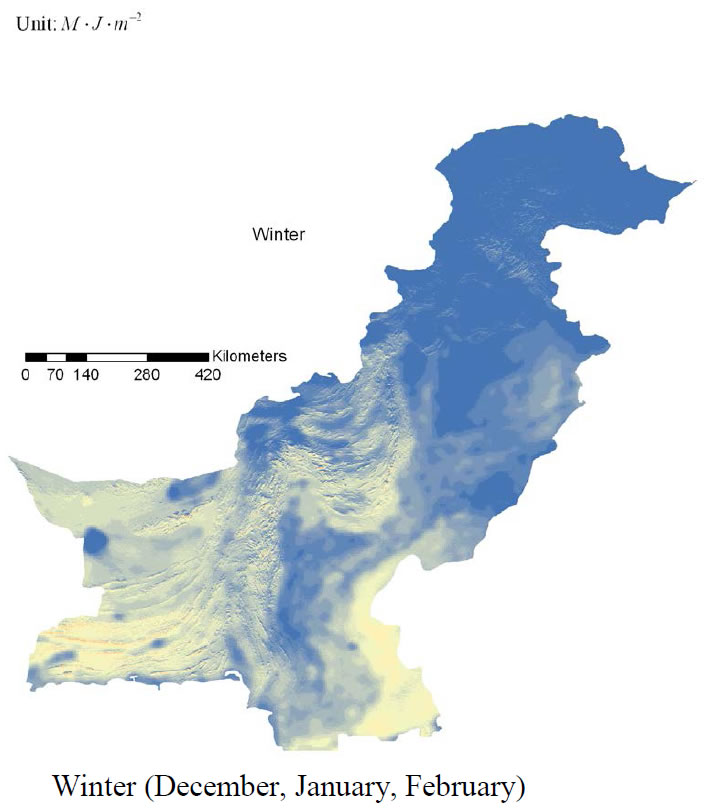


Figure 5. Mean seasonal variations of direct solar radiation for the year of 2006 & 2007.
the quantity of DSR during monsoon season is higher than that during winter season. The southwestern part of Pakistan is least influenced by the monsoon and has higher values of DSR as compared to eastern parts of Pakistan, ranging from 1733 to 1835 MJ×m‒2. It is also obvious that the southeastern Sindh of Pakistan has comparatively lower values of DSR during summer than its surrounding areas. One of the reasons is cloud cover due to monsoonal flows and the other reason might be aerosols and dust particles [24].
5.2. Topographic Influences on DSR over the Rugged Terrain of Pakistan
Figures 6 and 7 show the variations of DSR over different slopes (5, 10, 15 and 20 degree) and latitudes (26˚N, 30˚N and 34˚N) at different azimuth ( denotes east azimuth,
  south and
  west azimuth) for the months of January and July respectively. It has been observed that the variations during January represent the average trend for winter and those during July represent the average variation during summer. During January the effect of aspects over DSR leads to much larger fluctations as compared to July (Figures 6 and 7). Therefore, we can conclude that during winter southern slopes receive more DSR as compared to summer due to sun orientation. For eastern and western aspects, the variations of DSI are not so prompt, both in summer and winter, Therefore, eastern and western slopes receive almost the same amount of DSR throughout the year.
6. Conclusion
There is a significant impact of topography on the distribution of DSR over the northern areas of Pakistan, particularly in Gilgit Baltistan, Potwar plateau and Blochistan plateau. Overall, southern slopes receive more DSR as compared to horizontal surface during winter, and vice versa during summer. Topographic effects for eastern and western slopes are not significant and they receive almost the same solar irradiance due to the orientation of topography with respect to sun position and latitudnal consistency. During the monsoon season, DSR displays a tendencey of decrease from western side of the Indus River to eastern side of the Indus River due to distribution of cloud cover. Therefore, any estimation of solar energy or estimation of evapotranpiration in northern areas of Pakistan should also consider the topographic effects (slope, aspect, etc.).
Acknowledgements
RW acknowledges the support of Hong Kong Research Grants Council grant (CUHK403612) and National
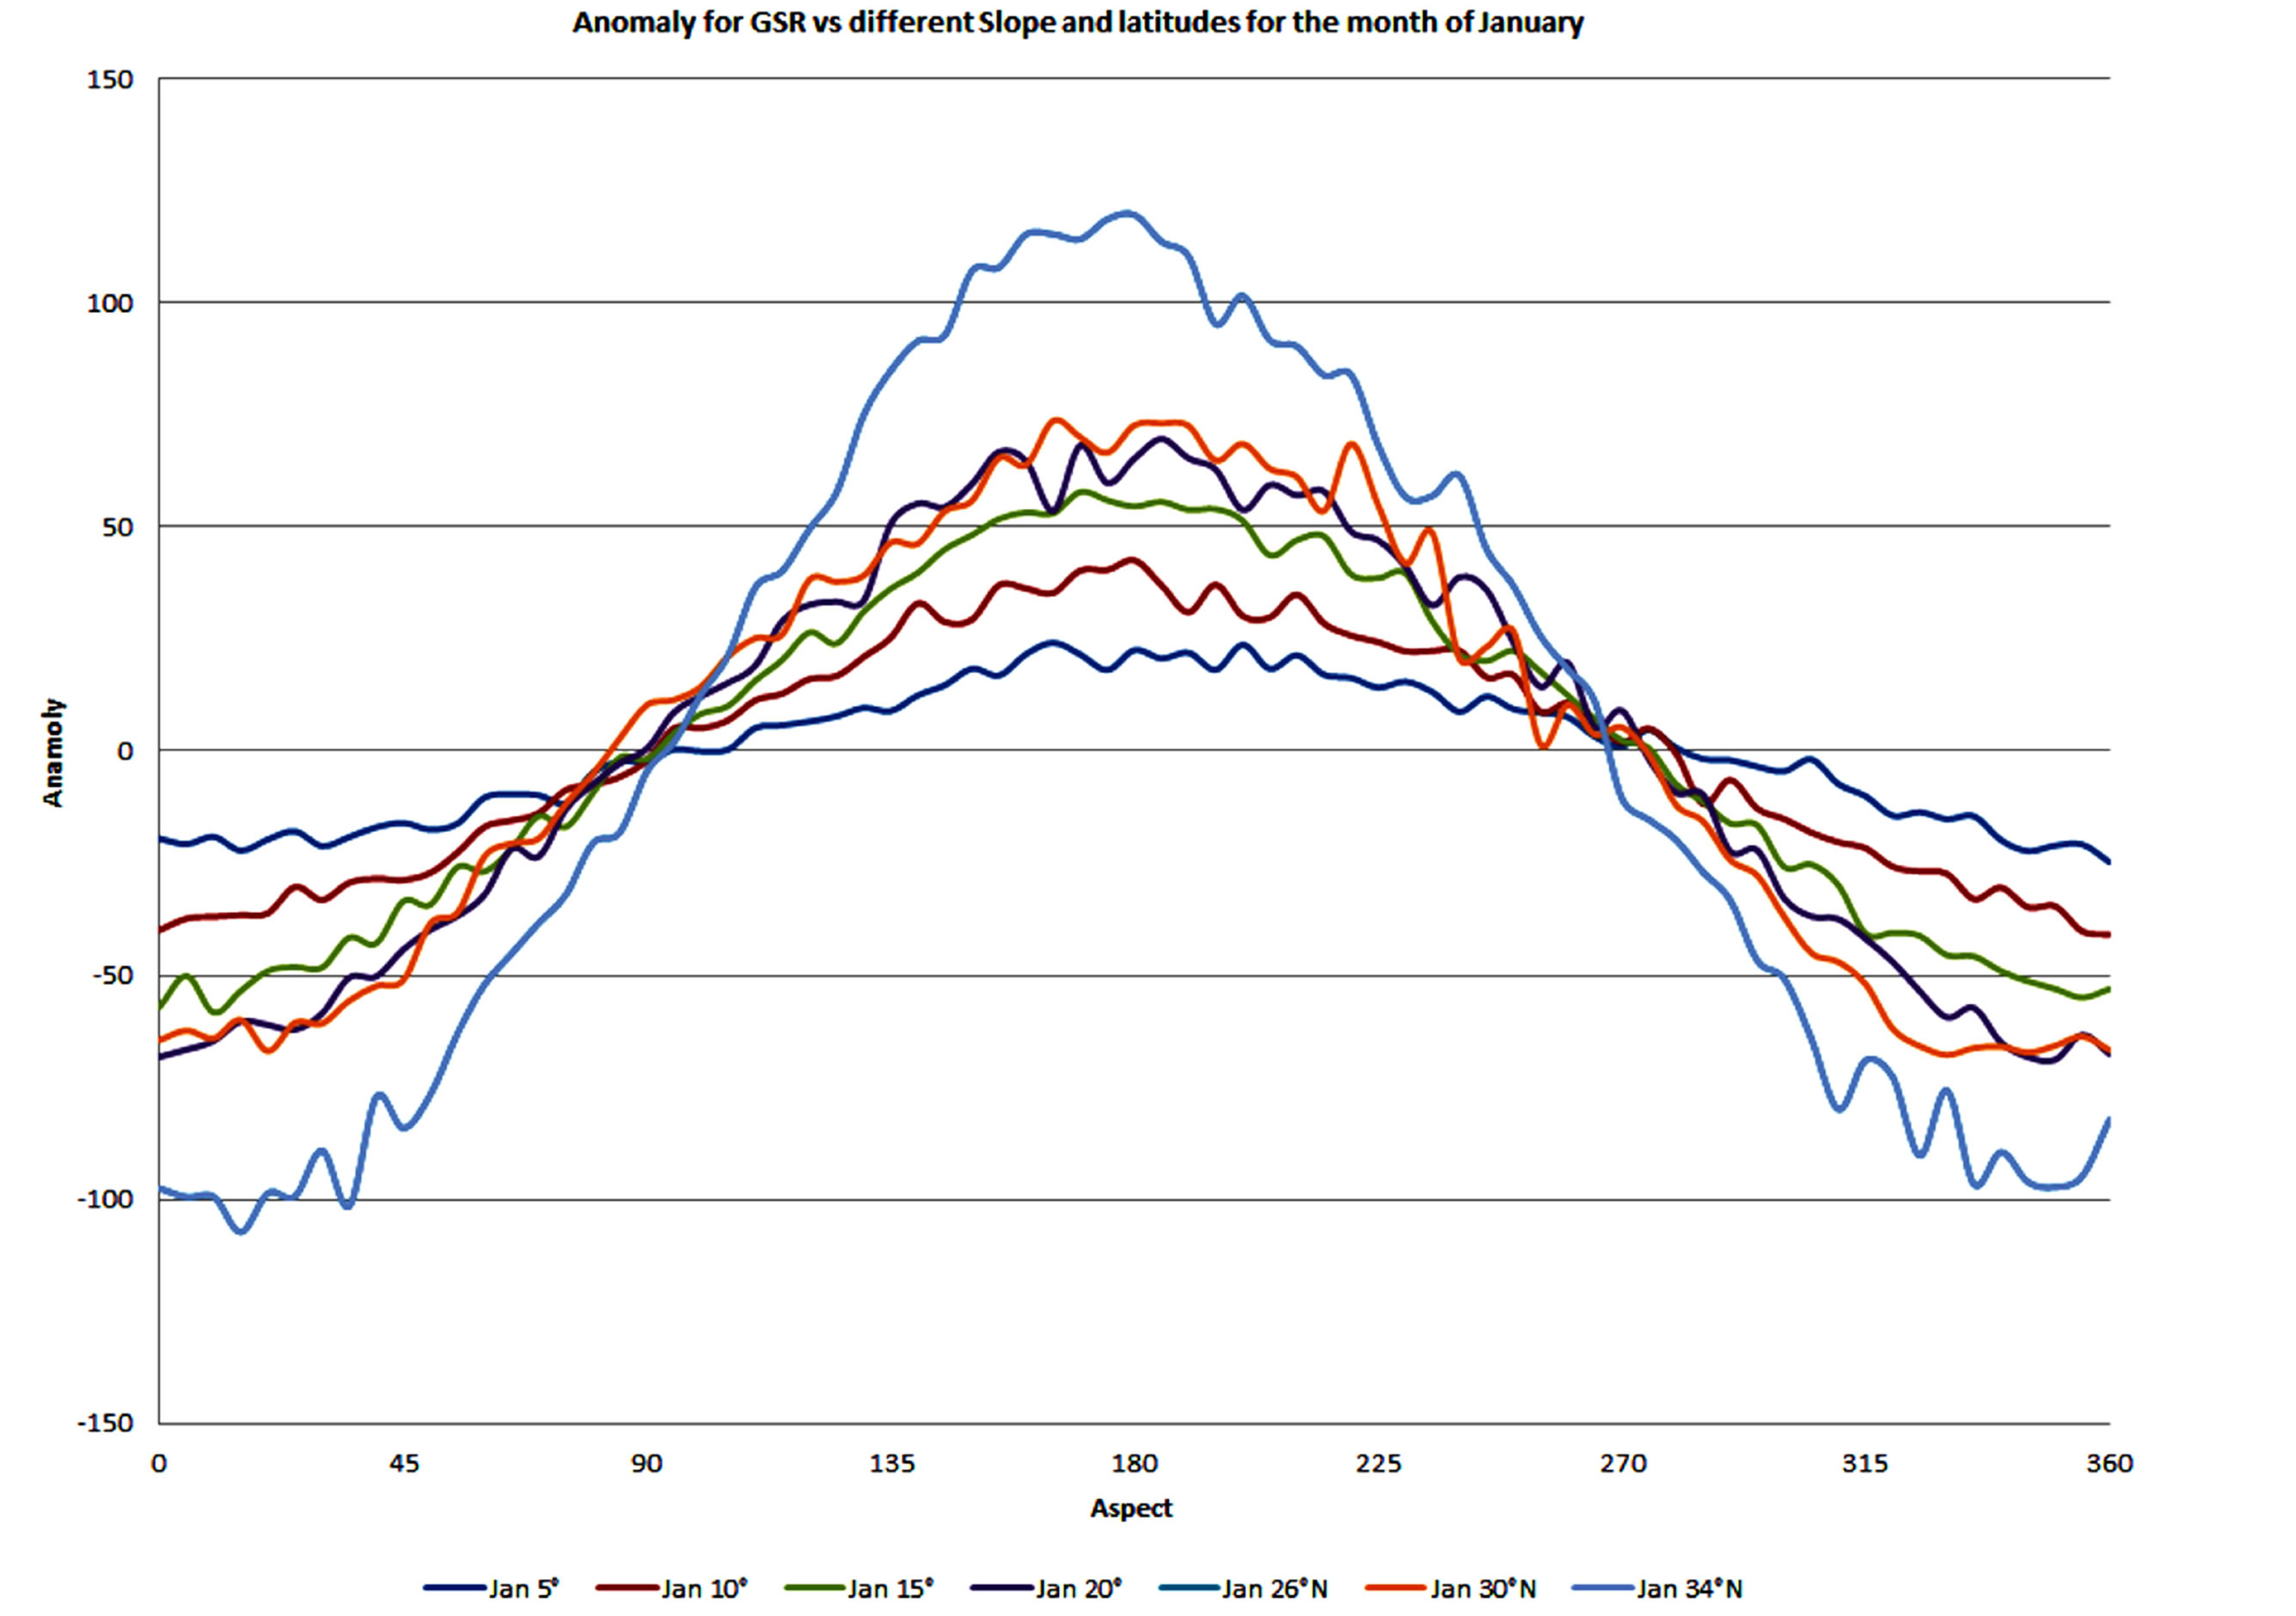
Figure 6. Topography effect over direct solar radiation at different slopes and latitudes for the month of January (anomaly is in MJ×m‒2).
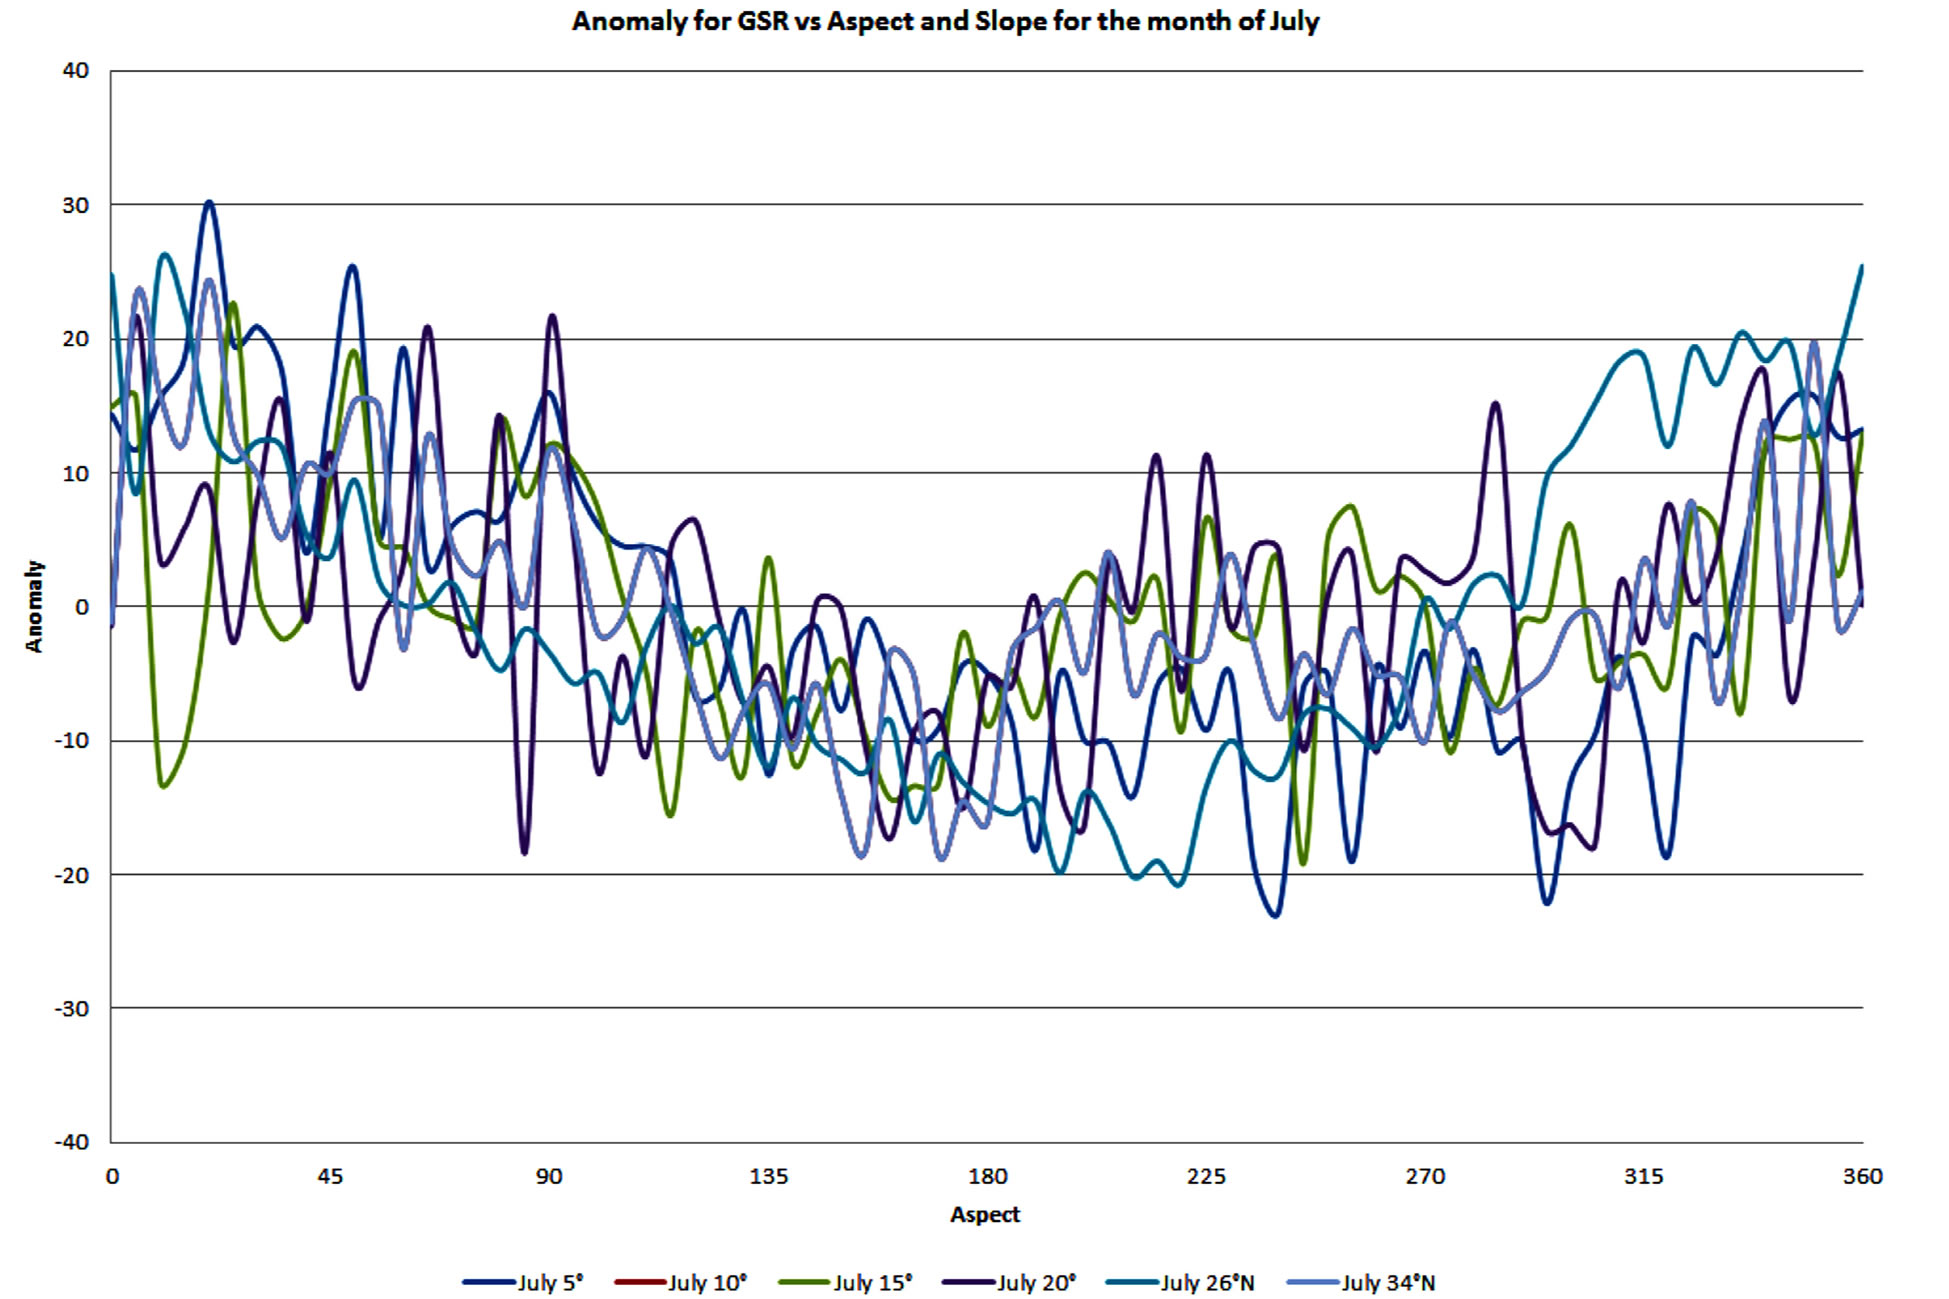
Figure 7. Topography effects over direct solar radiation on different slopes for the month of July (anomaly is in MJ×m‒2).
Natural Science Foundation of China grants (41228006 and 41275081).
REFERENCES
- R. Chant and D. Ruth, “Solar Heating in Canada, The Potential of Solar Energy for Canada,” Conference of the Solar Energy Society of Canada Inc, Ottawa, June 1975. http://www.cmos.ca/CB/cb100201.pdf
- L. Wang and X. Qiu, “Distributed Modeling of Direct Solar Radiation of Rugged Terrain Based on GIS,” The 1st International Conference on Information Science and Engineering (ICISE), Nanjing, 26-28 December 2009, 2042-2045.
- S. Changnon and D. Changnon, “Importance of Sky Conditions on the Record 2004 Midwestern Crop Yields,” Physical Geography, Vol. 26, No. 2, 2005, pp. 99-111.
- Z. X. L. Yang and Y. F. Hu, “Study on Solar Radiation and Energy Efficiency of Building Glass System,” Applied Thermal Engineering, Vol. 26, No. 8-9, 2006, pp. 956-961.
- E. Amer and M. Younes, “Estimating the Monthly Discharge of a Photovoltaic Water Pumping System: Model Verification,” Energy Conversion and Management, Vol. 47, No. 15-16, 2006, pp. 2092-2102.
- R. Ranzi and R. Rosso, “A Stokesian Model of Areal Clear-Sky Direct Radiation for Mountainous Terrain,” Geographical Research Letters, Vol. 20, No. 24, 1993, pp. 2893-2896. http://dx.doi.org/10.1029/93GL03307
- Q. S. I. Dozier, “An Approach toward Energy Balance Simulation over Rugged Terrain,” Geography, Vol. 11, No. 1, 1979, pp. 65-85.
- R. Dubayaha and P. M. Richb, “Topographic Solar Radiation Models for GIS,” International Journal of Geographical Information Science, Vol. 9, No. 4, 1995, pp. 405-419.
- D. L. Liu and B. J. Scott, “Estimation of Solar Radiation in Australia from Rainfall and Temperature Observations,” Agricultural and Forest Meteorology, Vol. 106, No. 1, 2001, pp. 41-59.
- H. Yoo, K. Lee, S. Park and K. H. Noh, “Calculation of Global Solar Radiation Based on Cloud Data for Major Cities of South Korea,” Global Warming, Green Energy and Technology, 2010, pp. 467-484.
- R. Dubayah, “Estimating Net Solar Radiation Using Landsat Thematic Mapper and Digital Elevation Data,” Water Resources Research, Vol. 28, No. 9, 1992, pp. 2469- 2484. http://dx.doi.org/10.1029/92WR00772
- R. Dubayah, J. Dozier and F. Davis, “The Distribution of Clear-Sky Radiation over Varying Terrain,” 12th Canadian Symposium on Remote Sensing (IGARSS’89), Vancouver, 10-14 July 1989, pp. 885-888.
- W. Panshou, “Mountain Climate Research Overview: On the Study of the Progress of the Mountain Climate, Mountain Climate Collected Works,” Beijing Meteorological Press, Beijing, 1984, pp. 1-7.
- P. Blood, “Pakistan: A Country Study,” Federal Research Division of the Library of Congress, 1994. http://countrystudies.us/pakistan/23.htm
- N. K. Amir, “Climate Change Adaptation and Disaster Risk Reduction in Pakistan,” In: J. M. P. J. J. P. Rajib Shaw, Ed., Climate Change Adaptation and Disaster Risk Reduction: An Asian Perspective, Vol. 5, Emerald Group Publishing Limited, 2010, pp. 197-215.
- climatemps.com, “Climate, Average Weather of Pakistan,” 2013. http://www.pakistan.climatemps.com/
- Y. Zeng, X. Qiu, C. Liu and A. Jiang, “Distributed Modeling of Direct Solar Radiation on Rugged Terrain of the Yellow River Basin,” Journal of Geographical Sciences, Vol. 15, No. 4, 2005, pp. 439-447. http://dx.doi.org/10.1007/BF02892151
- B. Liu and R. Jordan, “The Interrelationship and Characteristic Distribution of Direct, Diffuse and Total Solar Radiation,” Solar Energy, Vol. 4, No. 3, 1960, pp. 1-19. http://dx.doi.org/10.1016/0038-092X(60)90062-1
- X. Qiu, Y. Zeng and C. Liu, “Simulation of Astronomical Solar Radiation over Yellow River Basin Based on DEM,” Journal of Geographical Sciences, Vol. 14, No. 1, 2004, pp. 63-69. http://dx.doi.org/10.1007/BF02873092
- D. Zuo, Y. Zhou and Y. Xiang, “On Surface Radiations,” Science Press, Beijing, 1991. (in Chinese)
- L. T. Wong and W. Chow, “Solar Radiation Model,” Applied Energy, Vol. 69, No. 3, 2001, pp. 191-224. http://dx.doi.org/10.1016/S0306-2619(01)00012-5
- D. Weng, “Studies on Radiation Climate of China,” China Meteorological Press, Beijing, 1997. (in Chinese)
- NREL’s, “Pakistan Resource Maps and Toolkit,” 2010. http://www.nrel.gov/international/ra_pakistan.html?print
- M. Rashed and L. Shuanglin, “Response of Summer Rainfall in Pakistan to Dust Aerosols in an Atmospheric General Circulation Model,” Quarterly Journal of Hungarian Meteorological Science, Vol. 116, No. 4, 2012, pp. 323-333.