Journal of Geographic Information System
Vol. 4 No. 3 (2012) , Article ID: 19600 , 6 pages DOI:10.4236/jgis.2012.43031
Development of a Web Based GIS Application for Spatial Natural Resources Information System Using Effective Open Source Software and Standards
North Eastern Space Applications Centre, Department of Space, Govertment of India, Umiam, India
Email: {ss.puyam, d.chutia, s.sudhakar}@nesac.gov.in
Received November 14, 2011; revised March 9, 2012; accepted March 19, 2012
Keywords: GIS; Mapserver; ORDBMS; CWC2; HTML
ABSTRACT
There is growing needs for web based GIS for easy and fast dissemination, sharing, displaying and processing of spatial information which in turns helping in decision making for various natural resources based applications. In order to make a cost effective implementation, operation and maintenance of spatial information over the web, a cheaper yet feature rich alternative to commercial software is required which can be fulfilled by Open Source GIS software. This paper conveys an efficient approach to customize and integrate an open source web GIS system based on Mapserver as a web GIS server and PostgreSQL/PostGIS as an object oriented relational database management system (ORDBMS) for effective dissemination, sharing and management of spatial information over the internet. An open source web application tool built on top of MapScript using the PHP programming language has been used as for development of interactive user interface. The configurable Web Mapping Client Components (CWC2) tags have been added to HTML template pages in order to deploy the mapping contents to a web application. It is observed that the present system developed using open source software enables user to view, update, customized retrieval, query and analysis of natural resources information for specific needs.
1. Introduction
Geographical data services via internet require proper management of spatial and non-spatial data. Geographic Information System helps in effective analysis and management of spatial data. Spatial data attributes can be efficiently managed using open source [1,2] based Object Oriented Relational Database Management System (ORDBMS). The development of a Web-based system by integrating GIS and ORDBMS allow the user to operate the system without having to understand with the underlying intricacies of GIS and ORDBMS technologies. Moreover, it would allow sharing of spatial information and technical expertise among varied users. The following sections describes various steps and methodologies of WebGIS development as part of potential sites mapping for sericulture development in “Champhai” district of Mizoram, India. It is developed by integrating the Minnesota Mapserver [3] (UMN), PHP, Apache Web Server, Chameleon, PostGIS [4] and PostgreSQL [5] Object-Relational data-base by adopting a Web based client/server environment. The system described here aims at providing a web-based platform for collaboration and data sharing between specialists, planning agencies, citizens, and private entities. To access the spatial database by the user, a Web browser and access to the Internet only is needed.
2. Designs and Implementation
The development of WebGIS [6-8] can be categorized into fatclient and thin-client. In fat-client systems, a significant proportion of data processing happens at the client, whereas the server is primarily responsible for data storage. The thin-client system on the other hand strives to minimize processing on the client; except for presentation and user interaction, most of the data processing occurs at the server. Here, in our current implementation, the thin-client approach was adopted. Some of the criteria’s like software portability, optimization of user network traffic, scalability and ease of server administration have been considered before adopting and implementing the WebGIS.
2.1. Application Architecture
The MapServer [9], an Open Source platform for publishing spatial data and interactive mapping applications to the web have been used as spatial data server. It creates map images from spatial information stored in digital format. It can handle both vector and raster data. MapServer can render over 20 different vector data formats, including shapefiles, PostGIS and ArcSDE geometries, OPeNDAP, Arc/Info coverage files.
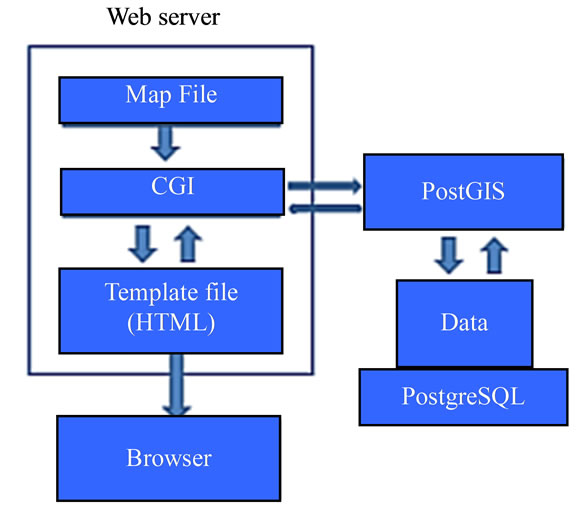
MapServer is template based. When first executed in response to a web request, it reads a configuration file (called the map file) that describes the layers and other components of the map. It then draws and saves the map. Next, it reads one or more HTML template files that are identified in the map file. Each template consists of conventional HTML markup tags and special MapServer substitution strings. These strings are used, for example, to specify the paths to the map image that MapServer has created, to identify which layers are to be rendered, and to specify zoom level and direction. MapServer substitutes current values for these strings and then sends the data stream to the web server, which then forwards it to the browser. When a requester changes any form elements on the page (by changing zoom direction or zoom value, for example) and clicks the submit button, MapServer receives a request from the web server with these new values. Then the cycle starts again. MapServer automatically performs several tasks when generating a map. It labels features and prevents collisions between neighbouring labels. It provides for the use of both bitmapped and TrueType fonts. Label sizes can be fixed or configured to scale with the scale of the map. The option to not print labels for specified map scale ranges is also provided. The Chameleon, a highly customizable and adaptable environment for deploying and managing Web mapping applications is used to design and Graphic User Interface of WebGIS.
2.1.1. The GIS Engine: Mapserver
MapServer 5.2 is an open source program created by University of Minnesota. It is the GIS engine of our WebGIS project: it acquires and processes requests coming from the user and returns him output results. MapServer consists of three different components: map file, template files and the CGI program. The map file needs to set cartographic parameters, cartographic objects, data loading, classification, displaying and querying and graphic elements definition and use. It is implemented using MapServer software’s built-in object oriented scripting language with which it is possible to design how to create and use the maps and their layers. In particular, in the map file Layer Objects the paths and connection types to data load are specified: there is a direct connection for shapefiles and raster files while more complex connections are necessary for other data file formats; among them, OGR connection (by OGR library) and PostGIS connection (by PostGIS program) are used for ESRI vector file and PostgreSQL tables. The template file is a common HTML page provided with MapServer specific parameters and variables. The template files are the files the user see by his browser, so they are implemented to present maps, cartographic objects, query and all other information which the web GIS designer want to offer to the user. The CGI program is the real engine of the web GIS: started up by the web server, it reads and processes both the map file settings and the template file user defined parameters or variables and returns the processed outputs as maps, cartographic objects, variables values and query results shown in the template files. Every CGI output is a temporary image or value updated at each CGI work session.
2.1.2. Interaction of MapServer with PostgreSQL
The original ESRI shapefiles were converted into All the spatial data are stored as PostgreSQL tables; in this way PostgreSQL becomes an indispensable system component from which the web GIS loads data to be displayed in the maps; these tables are called by MapServer using the map file PostGIS connection (Figure 1). Each PostgreSQL table has been previously provided with a Geometry Column, in which every record has its spatial description. In this way the tables become “spatial tables”. The Geometry Column provided spatial information has been done by PostGIS: using the special AddGeometry Column function for the spatial layer table and automatically with PostGIS Data Loader for paths and highlights tables. So, for loading spatial tables it is enough to specify in a map file Layer Object: 1) the PostGIS connection type; 2) the connection parameters, in particular the name of the database containing the spatial table to be loaded; 3) name of the spatial table and its
CONNECTIONTYPE postgis
CONNECTION “dbname = postgis host = localhost
port = 5432 user = postgres password = puyam”
DATA ‘the_geom from mulberryvill USING UNIQUE gid USING SRID = -1’
Figure 1. Connection of PostGIS layer in Mapserver.
Geometry Column; 4) loading filter with the syntax used for a SQL query WHERE clause.
In this way MapServer accesses PostGIS/PostgreSQL data like any other PostgreSQL client and it can display PostgreSQL table features using PostGIS as spatial enabling support. The use of a spatially aware DBMS is very much needed when comes to loading of GIS data that needs to be updated frequently in a web. The same is made possible using PostgreSQL coupled with PostGIS. Thus, coupling MapServer to PostGIS/PostgreSQL, a user which has the necessary database privilege can, for example, could add a newly data or manipulating the PostgreSQL spatial table and see the results of its operations by MapServer maps at once.
2.1.3. The Graphic User Interface
The CWC2 based Chameleon framework has been used in our development for building user interface web mapping. It consists of PHP scripts that provide access to mapping-related “widgets” and functions. Tags are added to HTML template pages. These tags are called CWC2 tags, short for “Configurable Web Mapping Client Components.” Using these tags provides a simplified method for adding mapping content to a web application.
3. The WebGIS Design Structures and Functions
The primary goal of this project is to implement a dynamic GIS map extraction and analysis mapping system and OGC [10] compliant. The user could then choose see spatial data attributes, query the data, analyse and print the map. To complete the application requirements it was decided that the project would be divided into two sections.
These sections were a Chameleon widget, which the user interacted with via the Chameleon mapping client, and a server side application which would be called by the Chameleon widget and given all the required information to return the final product. The main task in the whole portal [11] development was the choosing, testing, recoding and customizing of CWC2 based widgets.
3.1. Designing the CWC2 Widgets
The CWC2 [12] configurable widgets is an open-source web map client development toolkit and enables embedding of web map viewer in custom web applications. The Chameleon widget must allow the user the ability select layer(s) on the map. It would then gather this information and pass them to the server side module. The main sections of the information to be passed to the server side module are CGI variables and complete WMS GetCapabilities request. The design of the widget required the study of the actual currently implemented code. Although Chameleon has a good support system in place, it did not have the required level of detail that was desired for this project. Currently, Chameleon has released several fully functional widgets. The widgets that were deemed relevant to the project were analysed so that their implementation and design may be better understood. The widgets that were deemed to be the most appropriate were the ZoomIn, ZoomOut, ZoomtoFullExtent, panning, Measure, Print, QuickZoom, WMSBrowser, AutoIdentify widget, BoundingBoxPopup widget and the Query widget etc. These widgets provided the base of the understanding of how widgets interacted with the Chameleon mapping client. However, due to the design of Chameleon and its compartmentalisation of it code, the analysis of these codes was not enough to understand how to properly implement the required widget. Since Chameleon is designed in a hierarchical structure, where the widget is the final leaf node, it was required to trace the roots of the tree back to the source to understand all the method calls and consequent overriding methods. It was determined that three main classes where the most relevant to the implementation of the widget. These classes were the Widget class, the Popup class and the NavTool class. The Widget class is the main class for the creation and implementation of widgets. It is the superclass for all the widgets and provides the core functionality for them. The Popup class can be considered more of an extension of the widget class, rather than an independent class of its own. It is the Popup class that provides the functionality for popups to be used in widgets. Since this widget revolves mainly on the ability to create popups for choice selection it is a key class and finally, the NavTool class. This class is the one that controls all the widgets placed in the navigation bar. This is important, because it is the navigation bar that allows the user to select which widget that they would like to use.
After analysing a greater proportion of the Chameleon code, the tasks of implementing a widget were easier. The design of the widget design would be straightforward. The widget would need to be placed in the navigation bar.
Figure 2 shows the potential suitability areas for Silkworm food plants in the Champhai district of Mizoram, India. The legend shows the different suitability classes. The map is supported by detail statistics giving blockwise suitability areas and lists of villages falling under each suitability classes.
3.2. WebGIS Components
The major components of the whole portal are categorized into Navigation Tools, Legend Tools, Search Tools and other tools such as WMS Layer adding tool, Layer Manager.
Top frame on the picture above shows various naviga-
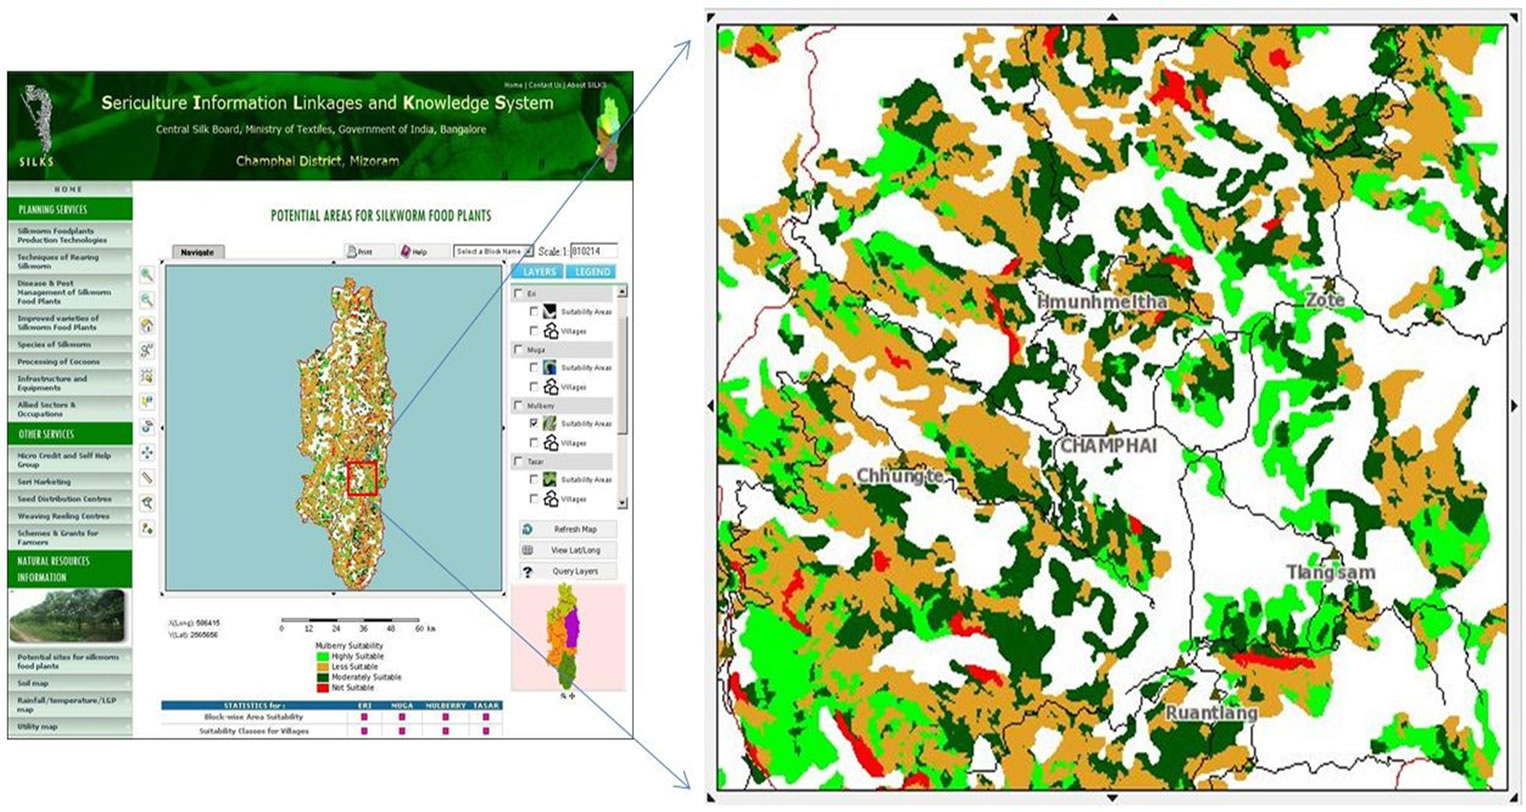
Figure 2. CWC2 based web mapping client Interface.
tion tools: zoom in, zoom out, zoom to full extent, selective zoom, re-center tool, pan, distance measuring and print map tools. Featues on the map can be identify using Map Identify tool. Distance measuring tool of map also have been included as part of spatial map analysis tool. Results of map query or area of interest can be printed out along with detail legend using Print tool. The size, font type and map output can be customize using this tool. The map can be produce in various file formats such as PNG, JPEG, GIF or PDF. Region specific zoom is made possible using QuickZoom tool.
Searching of non-spatial attributes could also be performed by the users. To do this, user first selects a layer and then a filed from its listed fields/columns. An attribute to be search is entered in the textbox. Clicking the “Search by Value” will create a pop-up window listing the attribute table matching the search criteria and subsequent zooming in the map and highlighted. Figures 3(b), (c) show the widget to perform this.
The automatic identification of map on mouse cursor moves is made possible using “Auto Identify” widget. The user selects a layer and its corresponding attribute(s), once applied; the user sees the attributes corresponding to the map location when mouse cursor moves. Figure 3(d) depicts this tool.
The addition of WMS [13] layers is also possible on this WebGIS [14] portal. First we host the layers having similar projection through the Geoserver. The Figures 3(e), (f) show this tool.
4. WebGIS Implementation and Testing
Implementation of the webGIS following the design specifications has been planned and carried out judiciously selecting a testing environment. Testing was required for each component of WebGIS framework that was implemented both in the database and application coding levels. Say for example in case of Chameleon, testing is needed because of the way that the Chameleon web mapping development was designed requires that all parts of widgets implemented be working correctly. If not, the entire application may not function as expected.
A quick survey on various database management systems available was carried out. PostgreSQL 8.3 has been chosen in our current implementation. PostgresSQL is an object-relational database management system (ORDBMS). It is released under an MIT-style license and is thus free and open source software. It has powerful indexing mecghanism and supports various data types and user defined objects. The pgAdmin, a graphical front-end administration tool for PostgreSQL has made overall management of the database easier. PostGIS 1.5 has been used as a back-end spatial database for GIS to PostgreSQL. It adds support for geographic objects to the PostgreSQL object-relational database. In other words, PostGIS “spatially enables” the PostgreSQL server.
To start implementing the Chameleon widgets, first we installed the Chameleon program on a local test server. This would allow for the easy testing and implementation, as well as the removal of the need to depend on outside
 (a)
(a) (b)
(b)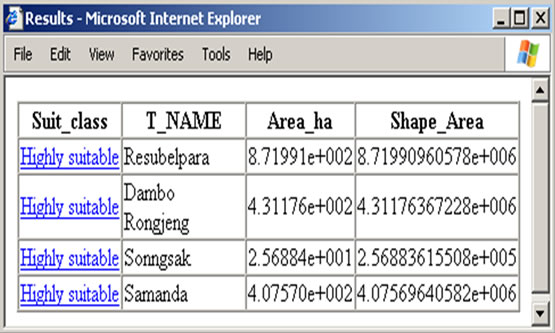 (c)
(c) (d)
(d) (e)
(e) (f)
(f)
Figure 3. (a) Navigation tools; (b) Search by value; (c) Search by value (contd.); (d) Setting of auto identify tool; (e) Adding WMS layer; (f) Adding WMS layer (contd.).
resources. This way, if the map zoom in widget was implemented correctly on the local server, in theory all that would be required was to transfer the widget files over to the live local server. The Chameleon 2.5 web mapping software was installed on a local server. The framework was then integrated into the local server.
5. Results and Discussion
The developed WebGIS portal consists of various useful GIS tools for spatial data visualization, analysis, querying and finally production of maps in the form of map prints. The use of an effective database management system allows for effective storage, management and retrieval of spatial data. The adopted approach and its implementation using PostgreSQL, PostGIS, PHP, Apache and UMN MapServer to develop a Web Based GIS applications provides public users data sharing and mapping services. It shares the information and geospatial datasets allowing users with limited GIS knowledge to access the information customized for specific applications that will reduce operation costs management and assists people in their decision-making process. The GIS and various web technologies can be efficiently combined as a mechanism to share spatial information freely, openly and easily.
REFERENCES
- X. F. Song, Y. Kono and M. Shibayama, “The Development of Web Mapping Application Using Open Source GIS Solution,” International Symposium on Geoinformatics for Spatial Infrastructure Development in Earth and Allied Sciences, 2004.
- M. Spanaki, B. Antoniou and L. Tsoulos, “Web Mapping and XML Technologies, a Close Relationship,” 7th AGILE International Conference on Geographic Information Science, Greece, 2004.
- Mapserver. http://mapserver.org/
- PostGIS. http://postgis.refractions.net/
- PostgreSQL. www.postgresql.org/
- T. De Filippis, L. Rocchi, E. Fiorillo and L. Genesio, “A WebGIS Application for Precision Viticulture: From Research to Operative Practices,” WebMGS 2010, ISPRS Conference, XXXVIII/4-W13.
- F. Yin and M. Feng, “A WebGIS Framework for Vector Geospatial Data Sharing Based on Open Source Projects,” Proceedings of the 2009 International Symposium on Web Information Systems and Applications (WISA’09), Nanchang, 22-24 May 2009, pp. 124-127.
- E. Nash, P. Korduan, S. Abele and G. Hobona, “Design Requirements for an AJAX and Web-Service Based Generic Internet GIS Client,” 11th AGILE International Conference on Geographic Information Science, University of Girona, Spain, 2008.
- M. A. Brovelli and D. Magni, “An Archaeological Web GIS Application Based on Mapserver and PostGIS,” The International Archives of the Photogrammetry, Remote Sensing and Spatial Information Sciences, Vol. XXXIV, Part 5/W12.
- G. Millin and K. Kitmitto, “Developing OGC Compliant Web Mapping for the UK Satellite Image Data Service,” AutoCarto 2006 Research Symposium in Vancouver, WA, June 2006.
- T. Zhang and G. Clarke, “The GIS Web Portal: Beyond Data Services,” AutoCarto 2006 Research Symposium in Vancouver, WA, June 2006.
- CWC2, http://geoservices.cgdi.ca/cwc2
- M. N. Kamel and K. Honda, “Web GIS in Practice IV: Publishing Your Health Maps and Connecting to Remote WMS Sources Using the Open Source UMN Mapserver and DM Solutions Maplab,” International Journal of Health Geographics, January 2006.
- Geoserver, http://geoserver.org