Health
Vol.06 No.18(2014), Article ID:50531,7 pages
10.4236/health.2014.618279
Analysis of Nosocomial Infections in Selected Teaching Hospitals, Qazvin, Iran
Fereshteh Farzianpour1*, Ahad Bakhtiari2*, Mohsen Mohammadi3, Omid Khosravizadeh4, Hoda Mossavi5, Mohammad Mohseni4, Mohammad Mahboubi6
1Health Care Management, Department of Health Management & Economic, School of Public Health, Tehran University of Medical Sciences, Tehran, Iran
2Healthcare Management, School of Public Health, Tehran University of Medical Sciences, Tehran, Iran
3Healthcare Management, Kermanshah University of Medical Sciences, Kermanshah, Iran
4Healthcare Management, Health Management and Economics Research Center, Iran University of Medical Sciences, Tehran, Iran
5Healthcare Management, Ahvaz Jundishapur University of Medical Sciences, Ahvaz, Iran
6Abadan School of Medical Sciences, Abadan, Iran
Email: *farzianp@sina.tums.ac.ir, *ah.bakhtyari@gmail.com
Copyright © 2014 by authors and Scientific Research Publishing Inc.
This work is licensed under the Creative Commons Attribution International License (CC BY).
http://creativecommons.org/licenses/by/4.0/


Received 30 July 2014; revised 10 September 2014; accepted 1 October 2014
ABSTRACT
Introduction: Hospital infections prolong patient hospitalization, necessitate additional treatment, increase mortality rate, raise hospital expenses, and even reduce the level of health in the society. The purpose of this research was to study hospital infections in selected hospitals of Qazvin. Methods and Materials: This was an analytic-cross-sectional study. The research population consisted of 25,628 hospitalized patients in the first eight months of 2012 in three selected hospitals of the Qazvin Province. The algorithm of reporting hospital infections, the National Program of Controlling Hospital Infections, and 223 patient files hospitalized due to hospital-acquired infections were used to collect information. The collected information was analyzed using the SPSS V. 17 software; the descriptive statistics was used to analyze the qualitative variables; and the descriptive statistics together with chi-square and t-test were employed for the quantitative variables. Results: The ICU units had the most cases of hospital infections. Respiratory pneumonia and urinary infections topped the list of hospital infections. The most invasive treatments carried out on patients with hospital infections were surgery, urinary catheter, and venous catheter, respectively. More than 50 percent of patients with hospital infections were hospitalized for 2 to 21 days. Results and Conclusions: Because of the high rate of hospital infections, especially in the ICU ward, authorities must give top priority in their plans to designing suitable educational programs to inform hospital staff and patients of hospital infections and to provide suitable resources for dealing with this problem.
Keywords:
Nosocomial Infections, Teaching Hospitals

1. Introduction
Hospital infections are one of the major medical, social, and economic problems of developed and developing countries and have been known for centuries as a severe problem influencing quality of healthcare and as the main reason for the undesirable side effects of healthcare. Hospital infections are infections caused from 48 to 72 hours after hospitalization or, at the maximum, six weeks after discharge from hospitals. These infections are not latent in patients but rather develop in them for the first time [1] [2] . Hospital infections prolong patient hospitalization, raise patient mortality rate, and, as a result, increase hospital expenses [2] . Infections of the urinary system and of the respiratory system, septicemia, and surgical site infections are the most common hospital infections [3] . Bacteria most reported as causing hospital infections include Acinetobacter, Pseudomonas aeruginosa, and Escherichia coli [4] . Hospital infections prolong patient hospitalization, necessitate additional treatment, raise patient mortality rate, and afflict healthy people and lower the level of heath in the society. These infections spread not only to patients but also to anybody in contact with them such as hospital staff, visitors, and others. There is also the danger of their being spread in the society. In fact, we can say that hospital infections are multidimensional. The possibility of their transmission from one patient to another, or from a patient to hospital staff, gives these infections their social dimension. In a study conducted by the World Health Organization in 55 hospitals situated in 14 countries of the four regions of Europe, East Mediterranean, Southeast Asia, and Western Pacific, it was found that, on the average, 8.7 percent of hospitalized patients were afflicted with hospital-acquired infections. This study also reveals that more than 4.1 million people in the world suffer from hospital infections [5] . Therefore, it is necessary that hospital infections be studied, especially in Iran and other developed countries because being informed of the situation regarding hospital infections allows us to organize suitable plans to improve the status quo [6] [7] . This research was conducted to study hospital infections in selected hospitals affiliated with Qazvin Medical Sciences University.
2. Materials and Methods
This was an analytic cross-sectional study. The research environment included the selected hospitals A, B, and C in the Qazvin Province. These hospitals were teaching hospitals two hospitals were for adult and a hospital was for children. The research population were 25,628 patients hospitalized in the first eight months of 2012 in these three hospitals. The patients were studied to determine the spread of hospital infections in all of the wards and to identify microorganisms causing hospital infections. Out of the 25,628 patients, 242 were afflicted with hospital infections. All of the tests, the symptoms, and the initial and final diagnoses of these hospital infections were recorded in patient files and in the hospital information system (HIS) and had been confirmed by the doctor in charge of controlling infections. All of these 242 were entered into the study and analyzed. Those who had fever 48 hours before the start of the study, and those who had died, were omitted from the study. The algorithm of reporting hospital infections, the National Hospital Infections Control Program, and the files of the 223 patients who were hospitalized with hospital-acquired infections were used to collect information. The collected information was analyzed using the SPSS V. 17 software, and the chi-square test and the t-test together with descriptive statistics were employed for analysis.
This study has been approved by the ethical committee Qazvin University of Medical Sciences.
3. Results
During the first eight months of 2012, 25,851 patients were hospitalized in the three hospitals. On the average, 8500 patients were admitted at each hospital and, in all, 242 cases of hospital infections were recorded at the three hospitals. The total cases of hospital infections recorded at the three hospitals during the eight months were, on the average, 112 (1.27 percent) for Hospital A, 93 (0.95 percent) for Hospital C, and 37 (0.4 percent) for Hospital B, which was a children’s hospital. Out of the 242 patients with hospital infections, 112 patients (50.22 percent) were men and 111 (49.77 percent) were women. The average age of the women was 57.73 years (minimum of 15 and maximum of 90 years), and that of the men was 53.83 years (minimum of ≤12 and maximum of 90 years). At Hospital B, all patients with hospital infections were one-year old children and were omitted from this part of the research.
The percentages of hospital infections in the various wards of each of the three hospitals were determined. At Hospital A, the ICU ward ranked first with 13.7 percent (50 of the 363 hospitalized during the eight months had hospital infections) and the PICU ward came in second with 7.5 percent (nine of the 119 hospitalized in this ward developed hospital infections). The nerve surgery with 1.4 percent (10 of the 707 hospitalized), and the burn ward with 1.1 percent (three of the 269 hospitalized) ranked third and fourth, respectively. The surgery ward with 0.7 percent (22 of the 3085 hospitalized), and the other wards with 0.53 percent (four of the 747 hospitalized) came in fifth and sixth, respectively. The orthopedic ward with 0.38 percent (13 of the 3404 hospitalized) ranked last. During these eight months, 114 patients died at Hospital A, 30 of whom had developed hospital infections. In all, 111 cases of hospital infections were detected in the different wards of Hospital A (Table 1, Figure 1).
At Hospital C, as in Hospital A, the ICU wards ranked first with the average percentage of 12.5 percent (14 of the 112 hospitalized patients had hospital infections) and the surgery ICU ward came in second with 10.6 percent (15 of the 141 hospitalized patients developed hospital infections). The neurosurgery ward with 1.97 percent (21 of the 1066 hospitalized), the internal medicine ward number 2 with 1.06 percent (8 of the 751 hospitalized), and the internal medicine ward number 1 with 1.03 percent (eight of the 770 hospitalized) ranked third to fifth, respectively. The infection ward with 1 percent (9 of the 895 hospitalized), the CCU number 1 with 0.92 percent (four of the 434 hospitalized), and the women’s CCU with 0.71 percent (nine of the 1262 hospitalized) came in sixth to eighth, respectively. The internal medicine ward number 2 with 0.2 percent (two of the 940 hospitalized), the CCU number 2 with 0.14 percent (one of the 695 hospitalized), and the internal ward number 4 with 0.12 percent (one of the 827 hospitalized) ranked ninth to eleventh, respectively. The men’s CCU came in last with 0.07 percent (one of the 1382 patients) ranked last. During the eight months, 202 patients died at this hospital, 19 of whom had developed hospital infections. In all, 75 cases of hospital infections were detected in all of the wards of Hospital C (Table 2, Figure 2).

Table 1. The total number of cases of hospital infections at Hospital A during the first eight months of 2012.
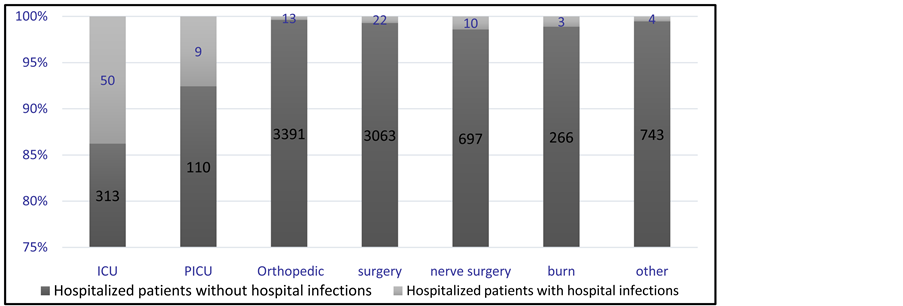
Figure 1. The total number of cases of hospital infections at Hospital A during the first eight months of 2012.
Table 2. The total number of cases of hospital infections at Hospital C during the first eight months of 2012.
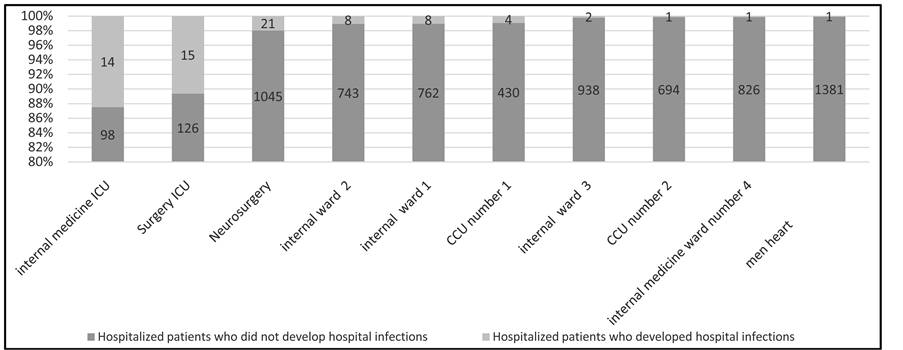
Figure 2. The total number of cases of hospital infections in Hospital C during the first eight months of 2012.
The same trend was found in Hospital B. The NIVU with 20 percent (19 of the 94 hospitalized patients had hospital infections) and the PICU with 3.24 percent (five of the 154 hospitalized patients developed hospital infections) had the largest percentages of hospital infections. The newborn ward with 0.54 percent (six of the 1106 hospitalized), the infection ward with 0.38 percent (six of the 1546 hospitalized), the internal medicine ward with 0.06 percent (one of the 1445 hospitalized), and the ENT ward with zero percent ranked third to last, respectively. During the eight months, two of the total 30 patients who died at Hospital B had developed hospital infections (Table 3, Figure 3).
The common types of hospital infections observed at the three hospitals were as follows. At Hospital A, pneumonia with 40 percent ranked as the most common hospital infection and skin- and soft tissue-infections with 11 percent came in second. Symptomatic urinary tract infections with 8.9 percent, deep surgical site infections (ssi-st) with eight percent, eye, ear, nose, throat, upper respiratory system (eent-ur) with 6.2 percent, the superficial surgical site infections (ssi-skin) with 4.4 percent, and other causes of infections with 1 - 2 cases during the eight months ranked second to last, respectively.
At Hospital C, symptomatic urinary tract infections (uti-suti) with 59 percent of the total cases were the most common hospital infection, while pneumonia with 30 percent and bsi-lcbi (that is, lab certified blood infections) with 10 percent ranked second and third, respectively.
At Hospital B, pneumonia with 21.6 percent, bsi-lcbi (that is, lab certified blood infections) with 21 percent, lower respiratory system infections (lri-lung) with 16.2 percent, clinical space blood infections (bsi-csep) with 16 percent, and infections caused by other agents with 1 - 2 cases during the eight months ranked first to last as the most common hospital infections, respectively.
Table 3. The total number of cases of hospital infections at Hospital B during the first eight months of 2012.
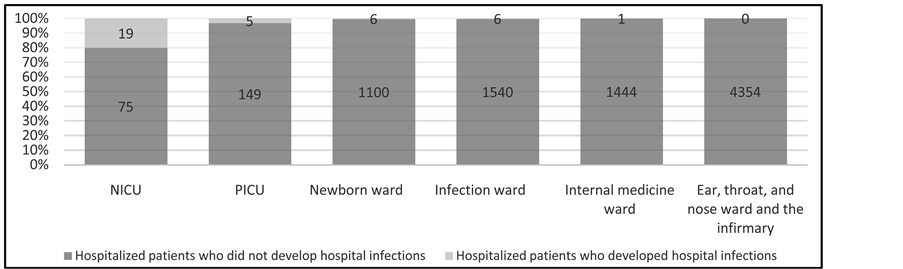
Figure 3. The total number of cases of hospital infections at Hospital B during the first eight months of 2012.
Furthermore, in surgical operations at these three hospitals, the most invasive operations performed on patients suffering from hospital infections included surgical operations, urinary catheters, venous catheters, tracheal tube, suction, ventilator, and venous feeding.
The hospitalization periods of patients afflicted with hospital infections varied from two to 117 days, with the most frequents periods being from two to 21 days and the second most frequent period from 22 to 41 days.
The chi-square test was employed to study the relationship between the hospitalization periods and the wards were the patients were hospitalized. Since the conditions for conducting this test were not satisfied, the method of combining columns and rows was used. Based on this test, there was a statistically significant relationship between hospitalization periods and the wards in which the patients were hospitalized (P < 0.05).
Concerning the hospitalization periods of the patients in the related wards, it was observed that the average periods for men and women were about 23 and 22 days, respectively. The independent two-sample t-test was used to study the statistical significance of this difference. First, the Levene statistical test was used to investigate equality of variance between the two groups of women and men patients. Results indicated that the two groups had statistically identical variances (at P < 0.05), and therefore, the independent two-sample t-test was used with the assumption of equality of variances. This test showed that there were no statistically significant differences between the hospitalization periods of the two groups at the error level of five percent (P > 0.05).
4. Discussion
In this research, 242 of 25,851 patients (that is, 0.09 percent of all the patients) hospitalized at the three hospitals during the first eight months of the year 2012 developed hospital infections. This is a higher percentage than the 0.04 percent found in the study conducted by Akbari et al. Ding et al. carried out a study during 2003 to 2007 and noted that 26.8 percent of the 1980 patients admitted at different times to the hospitals developed hospital infections [8] . It is noteworthy that, according to international standards, the acceptable levels of hospital infections vary from five to 20 percent [9] . The average eight-month rates of hospital infections in our research were lower than the corresponding rates in the United States (5 - 10 percent), in the European countries (7.7 percent), and in the East Mediterranean countries (11.8 percent). This, very probably, is due to faults in hospital infection detection and in reporting. However, the average rates of hospital infections at the ICUs in the three hospitals in our research were similar to those of the hospitals in the Middle East.
The average hospitalization period for men and women patients at the wards were about 23 and 22 days, respectively, which does not show any statistical differences at the error level of five percent (P > 0.05). However, in the study conducted by Farzianpour et al. it was found that there were significant relationships between the variables of gender, age, marital status, place of residence, occupation, referral types, type of insurance, reasons for hospitalization, and the conditions of the patients discharged from hospitals with their hospitalization periods [1] [2] .
Our findings indicate that the highest percentage of hospital infections take place at the ICUs. These results are in conformity with those found in the research conducted by Salimi et al. [10] - [12] and by Akbari et al. [7] . In the study carried out by Hawkins, the ICU, with 20.6 percent, was the ward with a high rate of hospital infections and the associated risk factors were mechanical ventilation, using invasive treatments, and the threats to immunity [13] . High rates of hospital infection at the ICU could be due to causes such as patient susceptibility, periods of hospitalization, and too many diagnostic tests performed on patients. However, in most of the other wards the rates of hospital infections were lower due to lack of susceptibility of hospitalized patients, the large numbers of patients admitted to these wards, and their earlier discharge from the wards compared to patients hospitalized at the ICU. However, Salimi has reported the low quality of nursing care at the ICUs as one of the main reasons for the higher than the acceptable level of spread of UTI and VAP infections at ICUs [12] . Akbari et al. have also stated that one of the reasons for the high percentage of hospital infections at the ICUs compared to other wards is the transfer of patients (on whom invasive treatments such as bladder catheterization or tracheal tube operations may have been performed) from other wards to the ICUs [7] . In studying the situation of structural factors (physical systems and equipment) at the ICUs, it was found that these units, despite enjoying suitable equipment and tools, suffered from faults in the physical space. This while in engineering and structural designs of the ICUs sufficient space must be provided for the staff to look after the patients and provisions must be made for the prevention of cross-transmission of infections to patients [14] . Because the three hospitals in our study are old, and since they lack suitable architectural designs, personnel education at these hospitals alone cannot bring down the rates of hospital infections to the levels considered in the long-term plans of the hospitals.
Urinary tract infections were highest at Hospital C and Hospital A ranking second in this respect, while no cases of urinary tract infections were reported from Hospital B. This is in agreement with studies conducted bu CDC during 1991 to 2002 in which it was reported that urinary infections and pneumonia were the most common hospital infections [15] [16] . This was also confirmed in a study carried out by Vafaei who reported that the most common hospital infections were urinary infections and pneumonia, and that the most invasive operations were the use of urinary and venous catheters in patients suffering from urinary infections and pneumonia [17] . It was also confirmed in research conducted by Ghorbani Birgani that the highest percentages of infections were those of the urinary and respiratory infections [18] . In research carried out in the United States it was shown that more than 40 percent of annual hospital infections were urinary infections most of which were caused by using urinary catheters [19] . According to the study conducted by Richards et al. concerning hospital infections in the ICUs of hospitals in the United States, urinary tract infections, at 31 percent, were the most common [20] . These results are compatible with those we found in our study.
Lab-certified blood infections (bsi-lcbi) at the children’s Hospital B ranked second. This is in agreement with conducted research in which it was found that blood infections are one of the most important reasons for being afflicted with hospital infections in children’s hospitals [21] [22] . Blood infections ranked second at Hospital C. In the study carried out by Jeyan et al., it was found that the most common hospital infections were blood infections and surgical site infections in the children’s ward, and that the use of invasive equipment was the most important causal factor of these infections [23] .
In all, E. coli and Pseudomonas were the most common agents causing infections at the three hospitals with Staphylococcus being the third most common cause. This is in agreement with conducted studies in which it has been found that Enterococci, Acetinobacter, Pseudomonas, Staphylococcus, and Escherichia coli are the most common and effective bacteria causing hospital infections [4] [24] -[26] . In the research carried out by Maasoomi at a children’s medical center, it was found that Pseudomonas aeruginosa was the most common cause of hospital infections and Staphylococcus aurous ranked second and Salmonella came in third [27] . In another study conducted by Jeyan on PICU patients, Staphylococci were the most common cause of hospital infections and Enterobacter [23] . In the research carried out by Jean Louise et al. on the spread and result of infections at ICU, it was found that resistant types of Staphylococci, Acetinobacter, and Pseudomonas candida [28] caused these hospital infections. In a study conducted in Isfahan, Staphylococcus aureus ranked first and Escherichia coli came in second as the most common causes of hospital infections [29] .
In all, the most invasive procedures performed on patients afflicted with hospital infections were surgical operations, urinary catheters, venous catheters, tracheal tube, suction, ventilator, and venous feeding, respectively. Hospital infections can be substantially reduced through education. In the study conducted by Barrack, the type of hospital, use of suction, and surgical operations had significant relationships with hospital infections [30] . However, in research carried out by Mariano et al. on the comparison of patients with regard to being afflicted with pneumonia at ICU, it was found that patients who used ventilators were more at the risk of developing pneumonia [31] . In research conducted by Ken, ICU at 20.6 percent was found as the ward with high rates of hospital infections and the risk factors related to these infections were mechanical ventilation and the use of invasive procedures endangering the immunity of patients [13] . In another study, the rate of mortality directly resulting from infections was reported to be 26 percent, with blood infections at 40 percent the leading infection at ICU, especially when venous catheters were used [32] .
In our research, there were a total of 111 cases of infection in the wards of Hospital A which does not match the total of 112 cases of infections at this hospital. Moreover, in Hospital C the total number of infection cases in the wards was 75, while the total cases of infection at this hospital was 93. The reason for this discrepancy could be circulation of patients and the changing of the wards at which they were hospitalized.
The average rates of hospital infections at the three hospitals were lower than the corresponding rates of hospitals in the Unites States and of European and East Mediterranean countries. This, very probably, could be due to faults in the system of detecting patients and in reporting. Therefore, results of our research lead us to a more careful study of reports of hospital infections announced by hospitals, to standardization of reports handed in, and to solving existing problems. Moreover, because of the high rates of hospital infections especially at ICU, authorities must give top priority to designing educational plans for informing staff and patients and for providing suitable facilities in these wards.
5. Conclusion
Hospital A showed more fluctuations than the other two hospitals regarding the rate of monthly hospital infections and had more cases of pneumonia compared to them. Hospital C ranked second in cases of pneumonia. Therefore, it can be concluded that respiratory system infections are the most common infections and authorities must design suitable educational programs and inform staff and patients of this situation and in their plans give top priority to the provisioning of necessary facilities.
References
- Farzianpour, F., Bakhtiari, A., Mosavee, H. and Akbarzadeh, A. (2014) The Most Important Species of Nosocomial Infection and the Most Important Wards Susceptible to Nosocomial Infection. Iranian Journal of Public Health, 43, 1016-1017. http://ijph.tums.ac.ir
- Farzianpour, F., Gery, S., Foroushani, A.R., Arab, M. and Hosseini, S. (2013) Evaluating the Average Access to Care and Continuity of Care Patients in Tehran Teaching Hospitals. Health, 5, 2110-2115. http://dx.doi.org/10.4236/health.2013.512288
- Gouya, M., Masoumi, H., Afhami, S.H., Nikfar, Sh. and Rahbar, M. (2006) National Directory of Hospital Infection Surveillance System. Ministry of Health Care and Medical Education, Management of Hospitals.
- Hashemian, D.A., Faal, H. and Fasihi, E. (2009) Survey of Nosocomial Infection and Accompanied Factors in Neonatal Intensive Care Unit. Journal of Guilan University of Medical Sciences, 19, 37-45.
- Kampf, G., Gastmeier, P., Wischnewski, N., et al. (1997) Analysis of Risk Factors for Nosocomial Infections―Results from the First National Prevalence Survey in Germany (NIDEP Study, Part 1). Journal of Hospital Infection, 37, 103- 112. http://dx.doi.org/10.1016/S0195-6701(97)90180-8
- Samiee, S. (2005) Prevention of Nosocomial Infections. Salemi Press, Tehran, 10-12.
- Abadi, A.S.H. (2008) Epidemiology of Nosocomial Infections. Shiraz University of Medical Sciences, 11-17.
- Akbari, M., Nejad, R., Azimpour, A., Barnousi, E. and Ghahremanlou, H. (2013) Prevalence of Nosocomial Infections in the ICU Ward of Imam Reza Hospital in Urmia City and Provide Appropriate Solutions Based on International Standards for the Prevention. Urmia Medical Journal, 23, 591-596.
- Ding, J.G., Sun, Q.F., Li, K.C., Zheng, M.H., Miao, X.H., Ni, W., et al. (2009) Retrospective Analysis of Nosocomial Infections in the Intensive Care Unit of a Tertiary Hospital in China during 2003 and 2007. BMC Infectious Diseases, 9, 115. http://dx.doi.org/10.1186/1471-2334-9-115
- Iranian Committee for the Control of Nosocomial Infections (2006) Nosocomial Infections Care System Guidelines. Ministery of Health, Tehran, 7-12.
- Kasper, D.L., Braunwald, E., Fauci, A., Hauser, S., Longo, D. and Jameson, J. (2008) Harrison’s Principles of Internal Medicine. 17th Edition, McGraw-Hill, New York, 119-127.
- Salimi, S., Demir, N., Anami, E., Noruznia, S. and Rastad, M.A. (2009) Evaluation Standards of Nursing Care on the Incidence of Nosocomial Infections in the MICU. Urmia Medical Journal, 19, 310-315.
- Ken, I., Alison, P. and Jayshree, D. (2005) Nosocomial Infection. Oxford Journals, 5, 14-17.
- Nowruizi, J. (1994) Nosocomial Infection. Published Esharat, Tehran, 6.
- Gaynes, R.P. and Horan, T. (1999) Surveillance of Nosocomial Infections. In: Mayhall, C.G., Ed., Hospital Epidemiology and Infection Control, 2nd Edition, Lippincott Williams & Wilkins, Philadelphiai, 1285-1317.
- National Nosocomial Infections Surveillance System (2002) National Nosocomial Infections Surveillance (NNIS) Sys- tem Report, Data Summary from January 1992 to June 2002. American Journal of Infection Control, 30, 458-475. http://dx.doi.org/10.1067/mic.2002.130032
- Vafaei, K., Razaviyan, F. and Sheikholeslami, N. (2013) The Epidemiologic Study of One Year Nosocomial Infections in Kamkar Hospital (Qom) 2008: (A Short Report). Journal of Rafsanjan University of Medical Sciences, 12, 319-324.
- Birgani, A.G. and Asadpoor, S. (2011) Nosocomial Infections in Intensive Care Unit of Ahvaz Arya Hospital (2008- 2009). Modern Care Journal, 8, 86-93.
- Mandell, G.L., Bennett, G.E. and Dolin, R. (2010) Principles and Practice of Infectious Diseases. 7th Edition, Elsevier Press, Philadelphia, 3669-3717.
- Richards, M.J., Edwards, J.R., Culver, D.H. and Gaynes, R.P. (1999) Nosocomial Infections in Medical Intensive Care Units in the United States. Critical Care Medicine, 27, 887-892. http://dx.doi.org/10.1097/00003246-199905000-00020
- Stoll, B. (2004) Infection of the Neonatal Infant. In: Behrman, R.E., Kligman, R.M. and Jenson, H.B., Eds., Nelson Textbook of Pediatrics, 17th Edition, Saunders, Philadelphia, 623-640.
- Farzinasgharisana and Sanamgheybi, S. (2011) Determine the Role of Prevalent Bacterial Agents at Neonatal Blood Infection, Shahidarefian Hospital of Ormia. Journal of New in Biotechnology, 2, 1.
- Jeyan, S.Y., Alexis, M.E. and Victoria, J.F. (2002) Rate, Risk Factors, and Outcomes of Nose(omina) Primary Blood Stream Infection in Pediatric Intensive Care Unit Patients. Am Acad J Pediactric, 110, 481-485.
- Lewis, K.L. and Thompson, J.M. (2009) Health Care Professionals’ Perceptions and Knowledge of Infection Control Practices in a Community Hospital. Health Care Manager, 28, 230-238. http://dx.doi.org/10.1097/HCM.0b013e3181b3ea8b
- Black, J.G. (1996) Microbiology, Principles and Applications. 3rd Edition, Prentice Hall College Div., Upper Saddle River, 436-443.
- Zamanzad, B., Shirzad, H.A. and Naseri, F. (2006) Comparison of the Causative Bacteria and Antibacterial Susceptibi- lity Pattern of Nosocomial and Community: Acquired Urinary Tract Pathogens in 13-35 Years Old Women, Shahrekord, 2004. Journal of Arak University of Medical Sciences (Rahavard-E Danesh), 8, 23-30.
- Asl, H.M. (2007) Guidline for Hospital Infection Care. Ministry of Health, CDC, 6-7.
- Jean, L. (2003) Vincent Nosocomial Infection in Adult Intensive-Care Units. The Lancet, 361, 2068-2077.
- Sodari (1999) Prevalence of Microbial Contamination. Esfahan Pediatric Hospital J Med, 3, 267-271.
- Barak, M., Mamishi, S., Siadati, A., Salamati, P., Khotaii, G.H. and Mirzarahimi, M. (2011) Risk Factors and Bacterial Etiologies of Nosocomial Infections in NICU and PICU Wards of Children’s Medical Center and Bahrami Hospitals during 2008-2009. Journal of Ardabil University of Medical Sciences, 11, 113-120.
- Brindha, Sunit, S. and Neelam, T. (2010) Study of Nosocomial Urinary Tract Infections in a Pediatric Intensive Care Unit. Journal of Tropical Pediatrics, 5, 367-369.
- Elizabeth, C. (2009) Sepsis Can Strike, Kill Shockingly Fast. HIS, 139-146.
Abbreviations
HI: Hospital infection;
ME: Medical Education;
ENI: Etiologies of Nosocomial Infections.
NOTES

*Corresponding authors.