Engineering
Vol.07 No.07(2015), Article ID:58061,11 pages
10.4236/eng.2015.77039
Effect of Velocity of Impact on Mechanical Properties and Microstructure of Medium Carbon Steel during Quenching Operations
Joseph Babalola Agboola*, Oladiran Abubakre Kamardeen, Edeki Mudiare, Michael Bolaji Adeyemi
Department of Mechanical Engineering, Federal University of Technology, Minna, Nigeria
Email: *joeagboola@gmail.com
Copyright © 2015 by authors and Scientific Research Publishing Inc.
This work is licensed under the Creative Commons Attribution International License (CC BY).
http://creativecommons.org/licenses/by/4.0/


Received 4 February 2015; accepted 14 July 2015; published 17 July 2015
ABSTRACT
Theoretical analysis of the effects of velocity of impact using suitable heat transfer equations expressed in forms of finite difference method was developed and used to determine their effects on the characteristic cooling parameters during quenching process. Various velocities of impact obtained by varying the heights of specimen drops were also used to experimentally determine their effects on characteristic cooling parameters and mechanical properties of medium carbon steel using water as the quenching medium. At height of drop of 0.5 m, 1.0 m, 1.5 m, and 2.0 m, the tensile strength of the material is 410.4, 496.12, 530.56, and 560.40 N/mm2 respectively. The corresponding hardness values are 42.4, 45.2, 46.2, 50.5 HRC respectively. It is found that as the velocity of impact increases, maximum cooling rate increases. Hardness and ultimate tensile strength also increase. There are good agreements between theoretical and experimentally determined values of critical cooling parameters of water during quenching operations.
Keywords:
Quenching, Modeling, Velocity, Impact, Mechanical Properties, Steel

1. Introduction
Quenching of steel involves heating a part above upper critical temperature to austenitizing temperature and holding at this temperature for a specified soaking time followed by intense cooling in a suitable quenching medium to transform it into the hard structure―martensite. This is generally achieved by cooling at a sufficiently fast rate to avoid the formation of soft constituent (ferrite and pearlite) in the steel [1] .
Quenching occurs in three stages. The first stage of cooling is characterized by the formation of a vapour film around the component. This is a period of relatively slow cooling during which heat transfer occurs by radiation and conduction through the vapor blanket. Upon further cooling, the nucleate boiling stage begins during which the vapour film collapses and cool quenchant comes into contact with the hot metal surface resulting in violent boiling and high extraction rates. Maximum part distortion also occurs during this stage due to difference in heat extraction from the part surfaces. As cooling continues, the surface temperature is below the boiling point of the quenching fluid and the metal surface is completely wetted by the fluid. At this point, the cooling rate is low and determined by the rate of convection and the viscosity of the quenching fluid. Heat transfer rates in this region are affected by various process variables, such as agitation, quenchant viscosity and bath temperature. The duration of the vapour phase and the temperature at which the maximum cooling rate occurs have a critical influence on the ability of the steel to harden fully [2] .
Quench hardening is a vital part of production based on steel; it is also one of the major causes of rejected components and production losses due to cracks and distortion in the material. Therefore the technical challenge of quenching is to select the quenching medium and process that will minimize the various stresses that develop within the part to reduce cracking and distortion, while at the same time providing heat transfer rates sufficient to yield the desired as-quenched properties [3] .
Achieving desired mechanical properties and minimizing the possibility of occurrence of quenching cracks are the key indicators of successful hardening process. Apart from the hardenability of the alloy, the geometry of the part, and the quenchant used, the effectiveness of quenching depends on a number of other external factors such as temperature, agitation and volume of the quenchant [4] .
Agitation or forced circulation of the quenchant during quenching generally enhances heat transfer at all stages of cooling [5] . Without agitation, heat flow through the film boundary at the surface of the part is reduced. Obtaining a forced convention fluid regime reduces the resistance to heat flow at the fluid film boundary layer [6] . This can be achieved by mechanically moving the parts through the bath, pumping to recirculate the quenchant or mechanically inducing agitation circulation of the fluid [7] . Agitation affects the hardness and depth of hardening during quenching because of early breakdown of the vapour blanket which results into the nucleate boiling [8] . This process results into a time reduction of the slow cooling stage thus resulting in rapid heat transfer.
Modeling and simulation of quenching process help to establish a predictive theory that enables us to predict the final properties and structure (shape) of the component caused by the manufacturing process. It is also a way to reduce cost and time in product development [9] . Although there are many published works on the modeling of quenching operations, there is no published theoretical and experimental work yet on the effect of velocity of impact (i.e. determined by specimen’s height of drop) on the characteristic cooling parameters of quenchant.
In the present research work, the effects of velocity of impact on the theoretical and experimentally determined cooling parameters of carbon steel using water as a quenchant are presented and compared. Effects of specimen’s velocity of impact on the mechanical properties such as hardness and ultimate tensile strength of medium carbon steel specimens are also given.
2. Theoretical Analysis of Quenching Operations
2.1. Assumptions
To formulate the governing equations for the heat transfer during quenching process, some assumptions are necessary. The following assumptions are made.
1) The material is homogenous and isotropic.
2) Velocity of impact is considered to coincide with the velocity of specimen length mid-center.
3) Velocity is assumed to be terminal velocity in the liquid and taken to be constant throughout the fall in the liquid.
4) Because of the small size of the specimen compared to the large volume of the liquid, the heat transfer between the liquid and the container is small and neglected.
5) Heat losses through convection to the atmosphere from the container are very small and also neglected.
Heat Transfer Equations within the Zones during Quenching Process
For symmetrical specimen (e.g. rods and pipes), the heat transfer equation for one dimensional analysis where there is no internal heat generation and where the length l, of the specimen is much greater than the radius r (i.e. ) is given by:
 (1)
(1)
where  is velocity of impact and
  is thermal diffusivity.
Figure 1 shows a cylindrical steel specimen initially at a temperature of 850˚C dropped from a height inside the liquid. Three major zones are identified:
1) Zone 1: Heat transfer in the air;
2) Zone 2: Heat transfer in the quenchant; and
3) Zone 3: Heat transfer at the point of sudden stop of fall in the quenchant.
Based on Equation (1), the governing partial differential equations [6] , during quenching process of different sections or zones and their respective boundary condition within the zones are formulated as follows:
1) Heat transfer in the air
Using Equation (1) for symmetrical objects as in cylindrical specimens, we have:
 (2)
(2)
For quenching operation, where effect of velocity of drop  is included Equation (2) is applicable within the region defined by the following conditions:

Energy balance between the specimen and ambient air.
Heat convected from the surface of the specimen into the atmosphere
 (3)
(3)
2) Heat transfer in the quenchant
Conduction heat transfer equation within the quenchant
 (4)
(4)
where Vt = terminal velocity in the quenchant

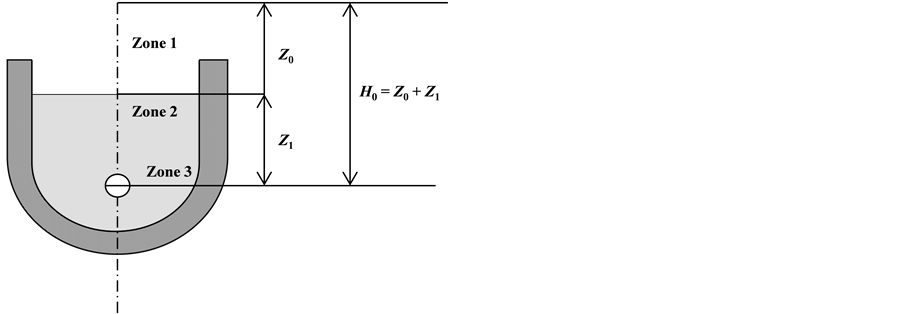
Figure 1. Schematic representation of quenching zones.
At the center of the specimen i.e. r = 0, 
Energy balance between the specimen and the quenchant
 (5)
(5)
3) Heat transfer at the point of sudden stop in the quenchant, Vs = 0, i.e. z = H0
Equation (2) reduces to
 (6)
(6)
Energy balance between the specimen and the liquid:
 (7)
(7)
2.2. Methods of Solution
The solution to the governing equations and energy balances (1)-(7) expressed in finite difference forms are as given below.
Finite Difference Forms of Equation Representing Temperature Distribution in Each Zone
1) Heat transfer equation in the air:
 (8)
(8)
 (9)
(9)
 (10)
(10)
Substituting Equations (8)-(10) into Equation (2) we have:
 (11)
(11)
Multiply through by 
 (12)
(12)
Equation (12) can be rearranged to give:
 (13)
(13)
Using 
 (14)
(14)
 (15)
(15)
For stability criterion, the coefficient of 
 (16)
(16)

Similarly, equation representing the energy balances between the material and ambient air, using Equation (7) is given by:
 (17)
(17)
For stability 
 . (18)
2) Heat transfer in the quenchant:
Finite difference discretization of the governing energy equation in this zone we have for each term;
 (19)
(19)
 (20)
(20)
 (21)
(21)
Substituting Equations (19)-(21) into Equation (4) we have:
 (22)
(22)
 (23)
(23)
 (24)
(24)
For stability criterion, the coefficient of 
 (25)
(25)
Similarly, equation representing the energy balances between the material and the quenchant using Equation (7) i.e.


Substituting, we have:
 (26)
(26)
 (27)
(27)
For stability 
 .
.
3) Heat transfer at the point of sudden stop, Vs = 0, i.e. z = H0
 (28)
(28)
 (29)
(29)
For stability, 
 . (30)
The energy balance between the specimen and quenchant:
 (30)
(30)
For stability 
 . (31)
Matlab approach was used to obtain the theoretical data used to obtain temp versus time curves for various heights of drop.
3. Experimental Methods
3.1. Cooling Curve Determination Procedure
The experimental investigation was conducted using a standard probe made of a cylindrical medium carbon steel specimen of 12.5 mm diameter × 60 mm long. The composition of the carbon steel used is shown in Table 1. A type K thermocouple was inserted in a hole of 3 mm diameter drilled through the specimen centre and care was taken for the thermocouple to be rigidly fitted to make good contact with the bottom of the specimen’s drilled hole. The test specimen probe was heated in an electric furnace at a heating rate of 25˚C/sec to a temperature of 850˚C and then allowed to soak at this temperature for about 10 min. The heated test specimens were manually and quickly dropped from various heights of 1.0, 1.5, and 2.0 m, so as to vary their velocities at impact in a container containing water as a quenchant. The temperature and cooling time of each height of drop was recorded using a card data logger Model RD 8900 connected through a cold junction, maintained at a temperature of 0˚C in order to establish a cooling temperature versus time curve. Critical cooling parameters [10] were determined from both the experimental and theoretical cooling temperature versus time curves.

Table 1. Chemical composition (wt%) of the medium carbon steel used.
3.2. Mechanical and Microstructural Property Tests
The hardness values determinations were carried out on test-pieces cut from the middle portion of the quenched specimens. The hardness impressions were taken transversely in two perpendicular directions along the cross- section of the quenched specimens by Rockwell hardness testing machine (Leco LM 700 AT) under applied load of 490.3 MN and dwell time of 10 sec. using a’ C’ scale (HRC). Hardness values were taken at different points to obtain an average value. Multiple repeat tests were performed on each specimen and the average taken as a measure of the hardness of the specimen.
The tensile tests were conducted on a computerized Instron Universal Testing machine (Model 3369) by using machined cylindrical tensile test specimens of 5.0 mm in diameter and gauge length of 20 mm. The maximum strength, percentage reduction in area and percentage elongation were determined from the Load-extension curves. The impact test was carried out to measure the toughness of the quenched specimens according to ASTM D256.
Optical micrographs of quenched specimens were carried out on sectioned surface using laboratory microscope, grinded with silicon carbide papers of different sizes. They were subsequently polished using a cloth impregnated with alumina until a mirror surface was obtained. Grinded surface were cleaned with water and ethanol. Etching with 2% Nital was done and microstructures observed using a high powered optical microscope.
4. Results
Figure 2 and Figure 3 show the time versus temperature curves (experimental and theoretical values respectively) carbon steel sample dropped from different heights of 1 m, 1.5 m and 2.0 m into the quenching medium.
Figure 4 and Figure 5 show the cooling rates versus temperature curves (experimental and theoretical values respectively) carbon steel sample dropped from different heights of 1 m, 1.5 m and 2.0 m into the quenching medium. Figure 4 and Figure 5 were obtained by taking the slope at each temperature to get the cooling rate from the time versus temperature curves in Figure 2 and Figure 3 respectively.
Figure 6 shows the comparisons between the experimental and numerical cooling rate curves of medium carbon steel probe dropped from heights of 1 m, 1.5 m and 2.0 m into the quenching medium. The experimental and theoretical characteristic cooling parameters obtained from Figure 6 are summarized in Table 2.
Figure 7 shows hardness measurements across sectional surfaces of specimens dropped from heights of 1 m, 1.5 m and 2.0 m into the quenching medium.
Table 3 shows the mechanical properties and microstructures of medium carbon steel dropped from heights of 1 m, 1.5 m and 2.0 m into the quenching medium.
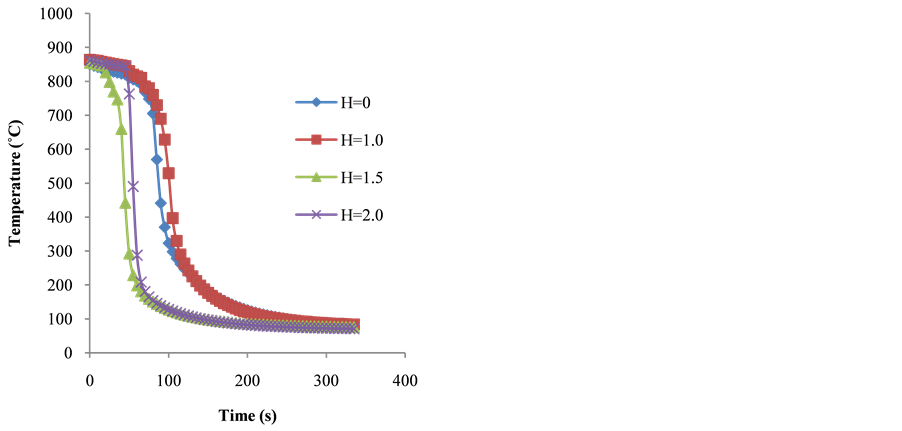
Figure 2. Experimental time/temperature cooling curves of water as quenchant.
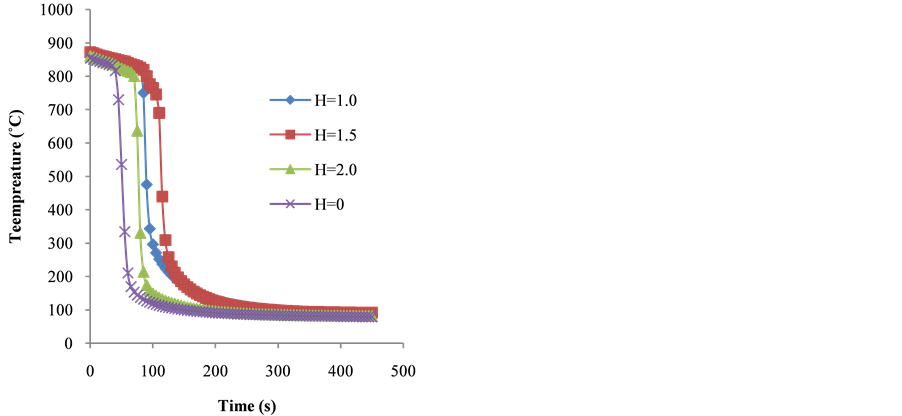
Figure 3. Theoretical time/temperature cooling curves of water as quenchant.
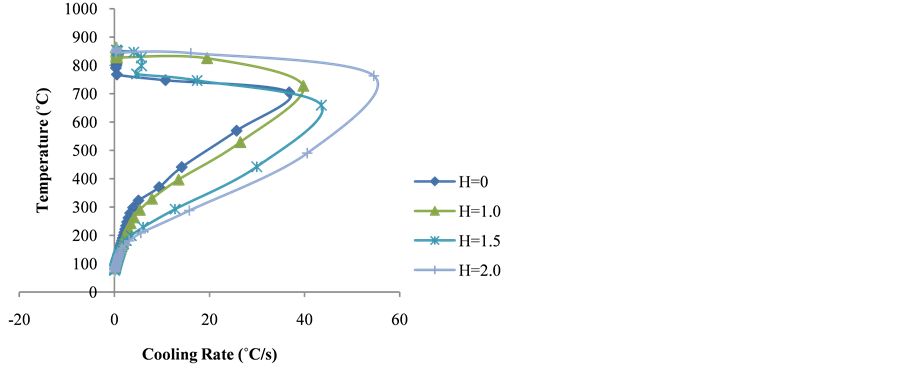
Figure 4. Experimental cooling rate versus temperature curves.
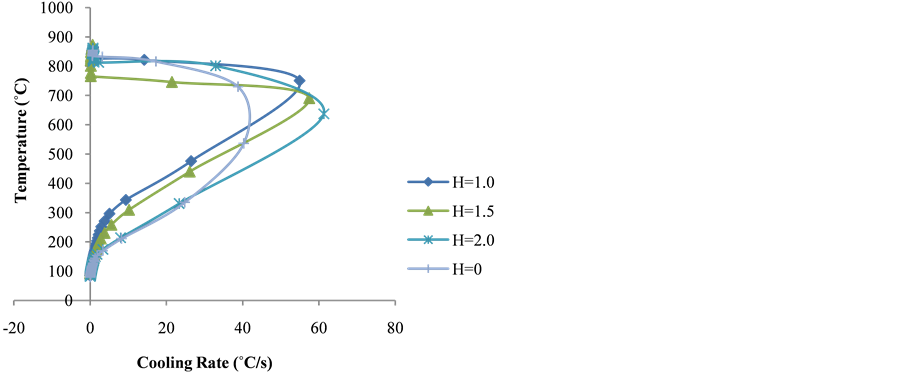
Figure 5. Theoretical cooling rate curves versus temperature.
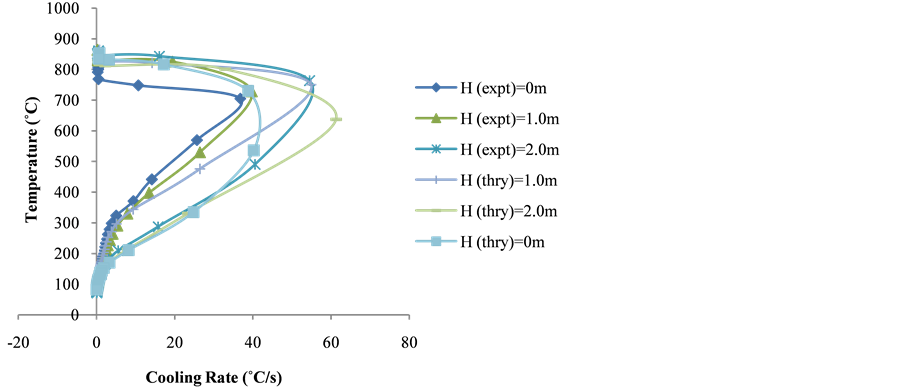
Figure 6. Comparison of experimental and theoretical cooling rates versus temperature curves for heights of drops of 0, 1.0 and 2.0 m.
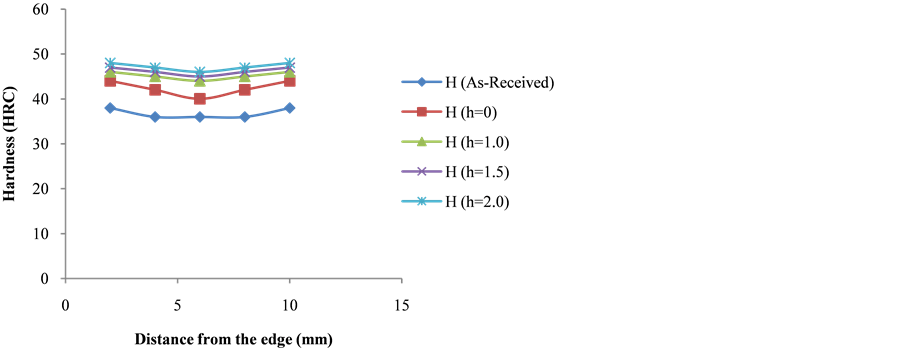
Figure 7. Hardness measurements across sectional surfaces of specimens dropped at various heights.
Table 2. Comparison of experimental and theoretical cooling parameters.
5. Discussion of Results
Cooling curves of steel samples dropped from different heights show the three stages of quenching mechanism. However, with increasing height of drop, the film boiling stage time reduces. Maximum cooling rates of, 40, 44, 56 m/s with corresponding height of drop of 1 m, 1.5 m, and 2 m was obtained (Figure 4). Thus cooling rates increase with height of drop. This was attributed to rapid destruction of the film boiling stage due to fast movement of work piece through the quenching medium.
Table 3 shows the mechanical properties for the steel samples when dropped from heights of 1, 1.5, and 2 m into the quenching medium. The hardness values, maximum tensile strength and Izod impact energy values of the quenched specimens are found to be influenced by the velocity of impact as a result of varying the heights of drop. The sample dropped from 2.0 m height has the highest hardness and tensile strength.
In contrast to the ductile behavior of the as-received carbon steel samples, specimens dropped from various heights into the quenching medium exhibited brittle fracture, as indicated by the negligible percentage elongation and reduction. Higher Izod impact energy values of 10.5 J was obtained for samples dropped from 1.0 m height than sample dropped from 2.0 m height. The decrease in impact energy value as the hardness increase is in agreement with earlier research of [8] .
Table 3. Effect of velocity of impact on mechanical properties.

 (a) (b)
 (c) (d)
Figure 8. (a) Microstructure of as-received material; (b) Microstructure of sample dropped from 1.0 m; (c) Microstructure of sample dropped from 1.5 m; (d) Microstructure of dropped from 2 m.
The variation in grain structures obtained for the steel specimens dropped from different heights is found to be more pronounced at the quenched specimen edges than at the centre, as evidenced by higher hardness values at the edges than at the centre (see Figure 7), which is due to the different cooling rates obtained during quenching across the specimens surface.
The microstructure of the as-received sample is composed of mixture of ferrite (white) and pearlite (dark) (see Figure 8(a)). The microstructure of the specimen dropped from height of 2 m show predominantly martensitic structure (see Figure 8(d)), while the specimen dropped from 0.5 m revealed a mixture of bainite and pearlite structures. The different microstructures obtained are as a result of the different rates of cooling which resulted from different heights of drop as shown in Table 2.
6. Conclusions
From the results obtained, it can be concluded that:
1) It has been established that cooling rates exhibited significant dependence on velocity of impact with the general trend showing increased cooling as velocity of impact increased.
2) It is found that as the velocity of impact increases, maximum cooling rate increases and the hardness and ultimate tensile strength also increase.
3) The microstructure of the specimen dropped from height of 2 m showed predominantly martensitic structure while the specimen dropped from 0.5 m revealed a mixture of bainite and pearlite structures.
4) Experimental and theoretical values are different, especially during nucleate boiling stage; however, the level of agreement is reasonable as they follow the same pattern. Both investigations revealed that increasing the velocity of impact increased CRmax, CR700 and CR300.
5) The proposed model can be used to simulate the quenching process of steel materials by using the material properties as the input data.
Cite this paper
Joseph BabalolaAgboola,Oladiran AbubakreKamardeen,EdekiMudiare,Michael BolajiAdeyemi, (2015) Effect of Velocity of Impact on Mechanical Properties and Microstructure of Medium Carbon Steel during Quenching Operations. Engineering,07,434-445. doi: 10.4236/eng.2015.77039
References
- 1. Agboola, J.B. (2014) Performance Assessment of Selected Nigerian Vegetable Oils as Quenching Media during Heat Treatment of Medium Carbon Steel. PhD Thesis, Federal University of Technology, Minna.
- 2. Adeyemi, M.B. and Adedayo, S.M. (2009) Vegetable Oils as Quenchants for Hardening Medium Carbon Steel. Journal of Applied Science and Technology, 14, 74-78.
http://dx.doi.org/10.4314/jast.v14i1-2.44333 - 3. Hassan S.B., Agboola, J.B., Aigbodion, V.S. and Williams, E.J. (2010) Hardening Characteristics of Plain Carbon Steel and Ductile Cast Iron Using Neem Oil as Quenchant. Journal of Minerals and Materials Characterization and Engineering, 5, 31-36.
- 4. Totten, G.E., Bates, C.E. and Clinton, N.A. (1993) Handbook of Quenchants and Quenching Technology. ASM International, 62, 140-144.
- 5. Fernandes, P. and Prabhu, K.N. (2007) Effect of Section Size and Agitation on Heat Transfer during Quenching of AISI 1040 Steel. Journal of Materials processing Technology, 183, 1-5.
- 6. Fadare, D.A., Fadara, T.G. and Akanbi, O.Y. (2011). Effect of Heat Treatment on Mechanical Properties and Microstructure of NST37-2 Steel. Journal of Minerals and Materials Characterization and Engineering, 10, 299-308.
http://dx.doi.org/10.4236/jmmce.2011.103020 - 7. Mohammed, M. (2010) The Effect of Agitation and Quenchant Temperature on the Heat Transfer Coefficients for 6061 Aluminum Alloy Quenched in Distilled Water. Journal of ASTM International, 7, 189-194.
- 8. Alberg, H. (2003) Material Modelling for Simulation of Heat Treatment. Unpublished Master of Science Thesis, Lulea University of Technology, Lulea.
- 9. Bohumil, T., Steven, D. and Spanielka, J.S. (2012) Effect of Agitation Work on Heat Transfer during Cooling in Oil Isorapid 277HM. Journal of Mechanical Engineering, 58, 102-106.
http://dx.doi.org/10.5545/sv-jme.2011.064 - 10. Fontecchio, M., Maniruzzaman, M. and Sisson Jr., R.D. (2002) The Effect of Bath Temperature and Agitation Rate on the Quench Severity of 6061 Aluminum in Distilled Water. Proceedings of the 21st Heat Treating Society Conference, Ndianapolis, 2002, 131-142.
Nomenclature
 = surface area of the solid
 = specific heat capacity
 = convective heat transfer coefficient
 = average heat transfer coefficient from the entire surface
 = thermal conductivity
 = characteristic length
 = length of probe
 = time
 = density
 = volume of the solid
 = speed or velocity of impact
 = thermal heat capacity
 = time derivative of temperature with respect to a moving coordinate
 = distance interval or spatial step size in the radial direction
 = time interval
 = Fourier number
 = thermal diffusivity
 = maximum cooling rate
 = cooling rate at 700˚C
 = cooling rate at 300˚C
NOTES

*Corresponding author.