Engineering
Vol. 4 No. 4 (2012) , Article ID: 18837 , 6 pages DOI:10.4236/eng.2012.44030
Mathematical Modeling and Software Application of Blood Flow for Therapeutic Management of Stroke
1Department of Chemical Engineering, University of Maiduguri, Borno, Nigeria
2Department of Chemical Engineering, University of Lagos, Lagos, Nigeria
3College of Medicine, University of Lagos, Lagos, Nigeria
Email: alfredasusu22@hotmail.com, babaganagutti@yahoo.com, ofasanmade@unilag.edu.ng
Received January 31, 2012; revised March 20, 2012; accepted March 28, 2012
Keywords: Stroke, Mathematical Model; Therapy; Software
ABSTRACT
People in the rural areas do not have access to specialist medical care, and when they have complications of stroke, they do not have specialists to look at them and they cannot afford to travel to the cities. The primary health care centers are not equipped with sophisticated equipments. Medicine is about medication, treatment and management. In rural areas treatment is not available either because of accessibility or affordability. Even the few doctors that are available are not in primary health care centres. Well conserved one-dimensional non-linear equations of blood flow describing blood flow in distensible blood vessels were used to develop software. This model could describe discontinuities and disruption in blood flow. The computer software can be used for detecting artherosclerosis, stenosis and differentiation of haemorrhagic and ischaemic strokes for stroke management from simple measurements. The software developed is capable of computing the Siriraj and the Allen clinical scores. These scores have been proposed to help clinicians in making decisions while waiting for results of computerized tomography, hence clinicians can start anti-thrombotic treatment while waiting for the scan results. It is capable of simulating stenosis at different position and depth of flow along the arterial length, and can be used for diagnosis. The medical emphasis is on avoiding possible occurrence, every individual can know his status by inputting the required data such as flow and geometry of their arteries into the developed interface and such measurements can be obtained from simple Doppler measurements.
1. Introduction
The definition of stroke used for epidemiological studies is based on clinical presentations of WHO [1], Harrison [2], Anderson and Stewart-Wynne [3] and Bamford [4]. Since the advent of computed tomography (CT) Scan and Magnetic Resonance Imaging (MRI), greater attention has been focused on changes in the occurrence and casefatality of the different pathological types of stroke. Although the criteria for the definition of stroke are relatively accurate for determining the presence or absence of stroke, the differentiation of pathological types requires brain imaging [5-7]. Experience from population-based studies has shown that up to a quarter of all stroke events are treated at home or in community-based long-term care institutions, making the differentiation of stroke type’s very difficult [8-10]. Nevertheless, the ability to classify stroke into hemorrhagic and ischemic types in epidemiological research would improve understanding of the nature of stroke and provide clues to its etiology and potential interventions in the acute stage [11].
To achieve this goal in the absence of diagnostic investigations, clinical scoring protocols have been produced by Allen [12] and Poungvarin et al. [13]. These two scoring protocols are the only ones currently available that have been validated against both postmortem and CT scan results. They are designed to give an objective score based on clinical variables shown to be significantly different for hemorrhagic and ischemic strokes. Hawkins et al. [11] have tested these two clinical scores in a subset of patients from a large population-based stroke study to examine the feasibility of applying one of the scores to the whole data set to allow differentiation between hemorrhagic and ischemic stroke. These scores were the most likely to succeed in settings where resources are scarce.
Haemorrhagic and ischaemic stroke cannot be distinguished clinically with a simple clinical evaluation, and it is virtually impossible for all stroke patients to have a computed tomography scan immediately after admission. Thus, in small district hospitals as well as in large university centres, the weighted clinical score may offer some advantages to physicians who are involved in stroke management and need to distinguish between haemorrhage and ischaemia for the purpose of treatment. The Siriraj score is much easier to determine, and can be used immediately after the stroke. Stroke is the most common neurological disorder causing death or disability among adults in industrialized nations. Ischemic events account for approximately 85% of all strokes, and hemorrhages account for approximately 15% [14]. The management of the two disorders differs substantially, and therefore the differentiation of cerebral infarction (CI) and cerebral hemorrhage (CH) and the identification of stroke complications are important in acute stroke. A reliable differentiation is not possible on the basis of clinical examination alone.
Depending on local conditions, ready access to CT facilities on admission may not be available everywhere. Large population-based studies revealed that approximately one third of the patients with acute stroke had no CT before treatment was started, and this applied even to centers experienced with stroke management [14]. But just like CT scan equipments, these are equipments not generally available in a lot of hospitals, because of its cost implications.
CT scanning is important to identify stroke pathology and exclude mimics. Its poor availability in our environment makes the search for simple, reliable clinical-score imperative. A study which aims at validating the SSS and determine the discriminant values of its parameters in the black population of African-Nigerians was carried out by Kolapo et al. [15]. In their study, the SSS diagnosis correlates significantly with CT diagnosis. Also Nyandaiti and Bwala [16] had carried out the validation of SSS in the North-Eastern Nigeria. The sensitivity and the predictive value of the SSS were 76.2% and 93% for infarction and 94.4% and 85% for hemorrhagic stroke respectively with overall accuracy of 84.6%. They concluded that SSS score is recommended to be used in this community especially where CT scan is not available or affordable and the physician wishes to start thrombolytic and/or anticoagulation therapy.
One-dimensional fluid dynamical model predicting blood flow and pressure in the systemic arteries at any position along the blood vessels can be used to study the profile of flow and pressure waves as they propagate along the arteries. Such models of vascular blood flow have previously been developed to model flow through relatively simple geomertries by Pedly [17], Stergiopulos and Rogge [18], Olufsen [19], and Smith and Hunter [20]. Disruption of blood flow is the major cause of failure of organs in the human system. Stroke is caused by disruption of flow of blood in the human system. The disruption of flow of blood in the blood vessels is caused by the collapse of the blood carrying vessels. With the collapse, the blood will cease to flow beyond the point of collapsethereby causing a pressure build-up. At this point of pressure build-up, the patient experiences severe stroke if the blood vessel involved is a major blood vessel to the brain (the carotid artery). More pressure build-up will lead to the rupture of this blood carrying vessel, leading to bleeding, which will lead to death if the situation is not arrested. In addition, if the blood vessel involved is a major vessel carrying blood to any organ of the body, then the collapse of the vessel will lead to the failure of the organ.
The demand for efficient and accurate software that can deal with the problems faced by hydraulic engineers led to numerous commercial packages. In the past, some of the more sophisticated software available required the use of powerful computers and long run times, as a result of the level of complexity involved. In addition several other areas can be identified where numerical techniques encounter difficulties when applied to blood flow. Firstly, the pulsating flow can lead to problems in producing a computational grid to represent the structure. The occurrence of mixed regions of flow, for example at blockages, leads to problems for some numerical methods resulting in either poor results or failure to produce a solution. All numerical methods are subject to stability constraints which restrict the values allowed for the time step for a given grid. For explicit schemes, this can result in the need to use small time steps which can be computationally expensive. Implicit schemes overcome this difficulty but at the expense of more complex algorithms. To improve this situation, Babagana et al., [21] developed numerical schemes which base their solution on solving a series of Riemann problems and was used to solve the blood flow equations. Such methods have a number of desirable properties, most noticeably the ability to predict discontinuities in the solution due to the presence of flow transitions, good conservation and shock capturing capabilities. The model was then applied to flow in stenosed artery. In this work the model was adapted to the Siriraj and Allen scoring protocols. Once a patient is diagnosed using any of the protocols, physiological measurements from CT scan can be simulated and matched with the diagnosis for future analysis and diagnosis of same or similar patient, without further scan.
2. Model Development
Predicting blood flow and pressure in a compliant vessel requires three equations. Two equations ensure conservation of volume and momentum, and an equation of state that relates the fluid influence on the vessel wall to its compliant properties.
The Saint-Venant equations of continuity and motion are used to develop the equation of blood flow and pressure, which govern Newtonian fluid flow as follows:
2.1. Momentum Equation
The momentum equation is given by
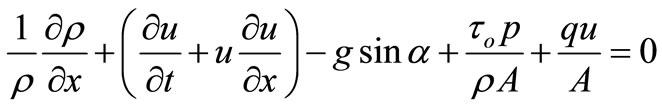 (1)
(1)
2.2. Continuity Equation
The continuity equation is given by
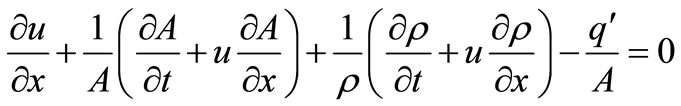 (2)
(2)
2.3. State Equation
The large arteries contain smooth muscle, elastic and collagen. The presence of elastin in the arteries makes them distensible. Arteries exhibit viscoelastic behaviour. However, to keep the model simple, the state equation was derived from the linear theory of elasticity. It is presented as follows;
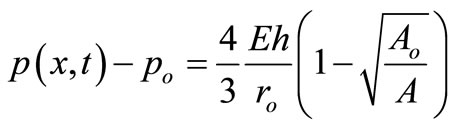 (3)
(3)
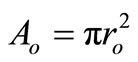 is the cross-sectional area when
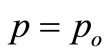 .
.
3. Applications to Blood Flow Equations
The method used by Babagana et al. [21] is described as follows; recalling the blood flow Equations, Equation (1) (the momentum Equation), Equation (2) (the Continuity Equation) and Equation (3) (the Equation of state);
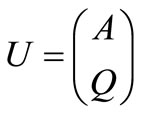
Let  and
and 
where 
following the Roe and Pike approach [22] and using the definitions
 and
and 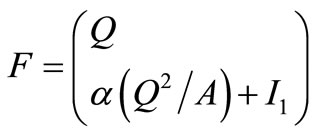 (4)
(4)
the exact Jacobian,  , for the homogeneous Blood flow equation is defined as
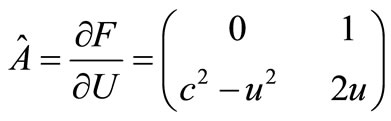 (5)
(5)
From this, the approximate Jacobian  is deemed to have eigenvalues and eigenvector of the form
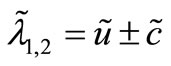 and
and 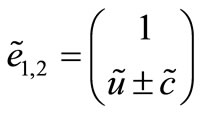 (6)
(6)
The construction is then based on determining the approximate quantities (eigenvalues and eigenvectors) which satisfy all of the constraints. In addition, expression for flow, Q and Area A, must be found. A matrix for the Euler equation that would satisfy Property U is constructed.
Having generated the approximated quantities the flux at the cell interface can be defined as
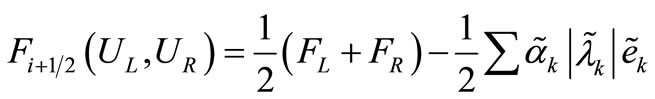 (7)
(7)
An equation representation of the Lax and Wendroff [23] flux written in terms of the Roe scheme is then given by:
 (8)
(8)
3.1. Steady State Analytic Solution
A steady state analytic solution of the blood flow is given in Equation (9)
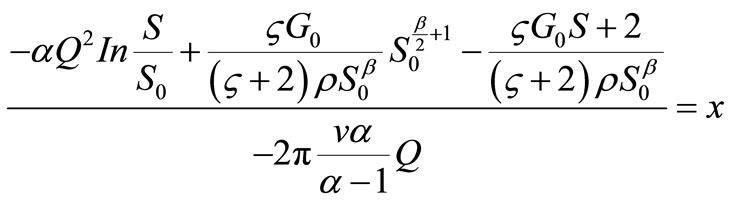 (9)
(9)
where the constant G is calculated using the boundary condition of vessel area at the entry point S, where x = O.
3.2. Stenosis Geometry
The axisymmetric stenosis had the following cosine shape [24]:
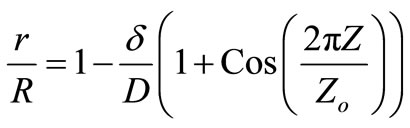 (10)
(10)
where r = r(z) is the radius of the artery at location z in the stenosed region, R is the radius of the non-stenosed part of the artery,  is the maximum radius reduction at the throat of the stenosis, and Zo is the length of the stenosis. This resulted in a smooth, eccentric stenosis with a healthy wall and a diseased wall in each case.
4. Results and Discussion
Previous modelling works on blood flow in human system suffer drawbacks. Smith et al. [20] have developed an anatomically based model of transient coronary blood flow in the heart. Although the result of the numerical analysis conducted matches closely with measured data, the well-posedness problem of the system of partial differential equations, that is, the existence, uniqueness and the continuous dependence on initial and boundary data of the solution, has not been established. The model of Babagana et al., [21] could reproduce the essential characteristics of the arterial pulse both qualitatively and quantitatively by comparing the model with data measured using magnetic resonance techniques and could be applied to diseased situation.
Most previous computational studies examining the relationship between hemodynamics and atherosclerosis have focused on early-stage disease in normal arterial geometries. The local fluid dynamics is highly related to specifics of geometry and flow wave form and approximations necessary in a study such as this, and for example imaging accuracy and conversion to a numerical grid can greatly affect accuracy in the final computational fluid dynamics results. The authors are aware of these problems hence the decision to look at stenosis in a steady state flow and the inherent problems associated with it. Global flow patterns and also the detailed distribution of hemodynamic parameters were found to be grossly distorted by the changes in vessel geometry brought about by the disease process. Downstream of a stenosis, pressure recovery and the wall curvature associated with the increase in cross-sectional area gives rise to flow separation. All these were considered in the development of software, using the developed equations and visual basic application tools.
The developed software can be installed from a Compact Disc (CD). Once you insert the CD into your computer, it will take you through the installation and will deposit a shortcut icon on the desktop. Once you click on the icon, Figure 1 will appear, it is the home page which shows the Siriraj scoring interface. It allows the input of physical and measured information data from a patient. Information like the level of consciousness (stupor or drowsy), vomiting or not, headache within the last two
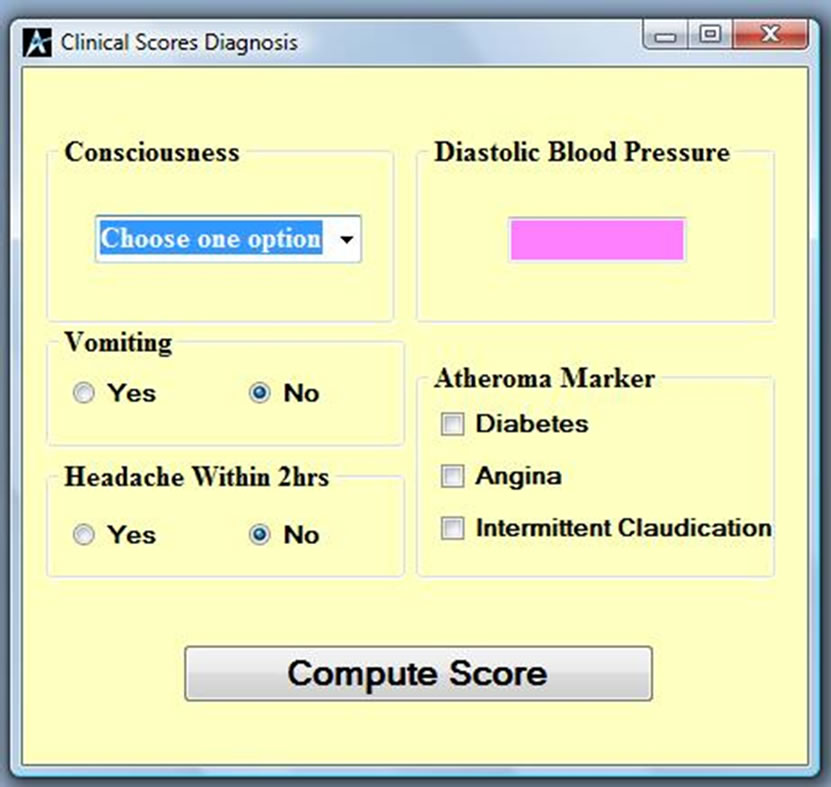
Figure 1. Siriraj analysis page.
hours, blood pressure and atheroma markers like diabetes, angina and intermittent claudication will compute a score to differentiate whether the patient is suffering from ischaemia or haemorrhage. If the computed value is less than one as shown in Figure 2, then the patient is suffering from Ischemia and if it is more than one as shown in Figure 3, then the patient is suggested to be suffering from haemorrhage. If the value falls between –1 and 1, then the condition is undefined as shown in Figure 4,
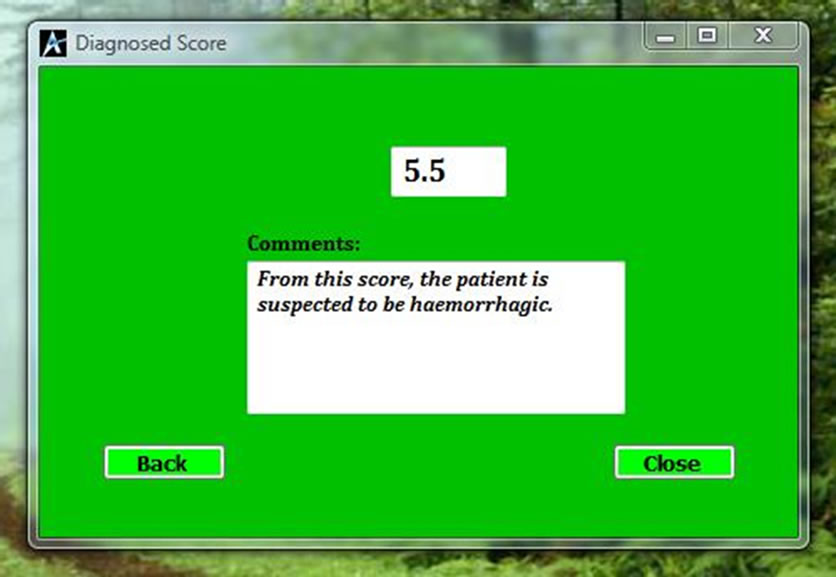
Figure 2. Diagnosed score for haemorrhagic.
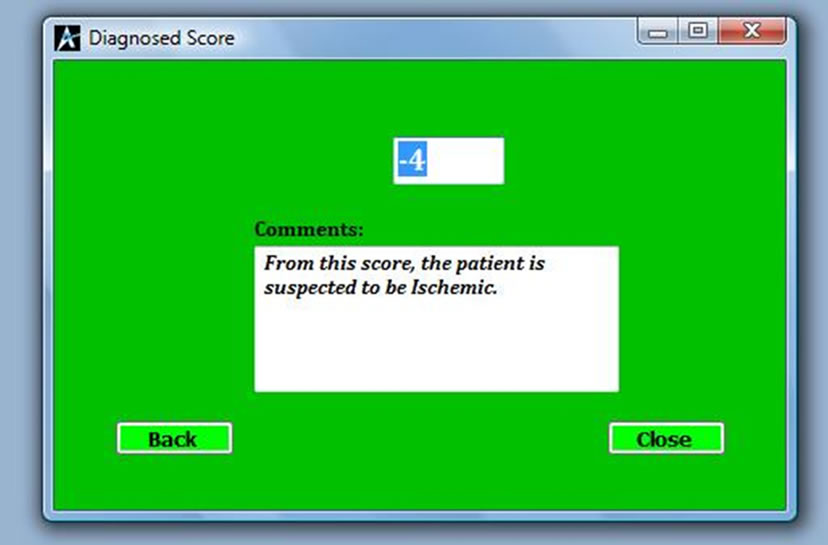
Figure 3. Diagnosed score for ischaemic.

Figure 4. Diagnosed score for unidentified situation.
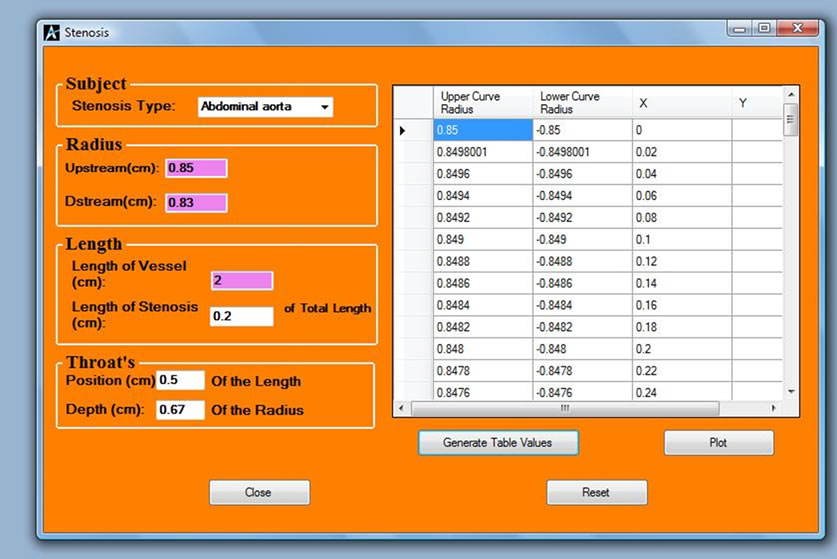
Figure 5. Stenosis analysis interface.
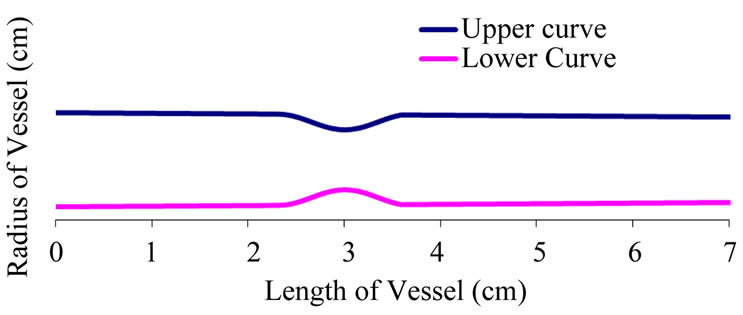
Figure 6. A diseased artery with stenosis at both sides of the vessel.
hence scanning is necessary, before medication. Figure 5 shows the stenosis simulation interface for every patient that is diagnosed for ischemia or haemorrhage, the information and the profile of the patient is simulated and stored against the parameters for a possible reference for later diagnosis. Figure 6 shows a profile of a patient with stenosis at both sides of the artery. From the shape of the profile the physician can now give medication.
5. Conclusion
In conclusion, software was developed using one-dimensional non-linear equations of blood flow which was solved using the Riemann based methods constructed within the finite volume framework. Interfaces were developed to read in some measured parameters and information form a subject and the program analyses the information and gives a feed back on the situation of the subject to the medical personal, which in turn takes decision on treatment. The software package can assist clinicians in early screening of patients at risk and physician can rely on the result to start thrombolytic and/or anticoagulation therapy.
REFERENCES
- WHO, “The World Health Organization MONICA Project (Monitoring Trends and Determinants in Cardiovascular Disease): A Major International Collaboration,” Journal of Clinical Epidemiology, Vol. 41, 1988, pp. 171-184.
- M. J. G. Harrison, “Clinical Distinction of Cerebral Hemorrhage and Cerebral Infarction,” Postgraduate Medical Journal, Vol. 56, 1980, pp. 629-632. doi:10.1136/pgmj.56.659.629
- C. Anderson and T. Stewart-Wynne, “Stroke: Clinical Presentations of Stroke—The Classic and the Less Obvious,” Australian Family Physician, Vol. 20, 1991, pp. 1565-1573.
- J. Bamford, “Clinical Examination in Diagnosis and Subclassification of Stroke,” Lancet, Vol. 339, No. 8790, 1992, pp. 400-402. doi:10.1016/0140-6736(92)90085-H
- A. M. Von, M. Britton, U. deFaire, C. Helmers, K. Miah and V. Murray, “Accuracy of Bedside Diagnosis of Stroke,” Stroke, Vol. 12, 1981, pp. 288-293. doi:10.1161/01.STR.12.3.288
- D. Shinar, C. R. Gross, J. P. Mohr, L. R. Caplan, T. R. Price, P. A. Wolf, D. B. Hier, C. S. Kase, I. G. Fishman, C. L. Wolf and S. C. Kunitz, “Interobserver Variability in the Assessment of Neurologic History and Examination in the Stroke Data Bank,” Archive of Neurology, Vol. 42, No. 6, 1985, pp. 557-565. doi:10.1001/archneur.1985.04060060059010
- C, R. Gross, D. Shinar, J. P. Mohr, D. B. Hier, L. R. Caplan, T. R. Price, P. A. Wolf, C. S. Case, I. G. Fishman, S. Calingo and S. C. Kunitz, “Interobserver Agreement in the Diagnosis of Stroke Type,” Archive of Neurology, Vol. 43, No. 9, 1986, pp. 893-898. doi:10.1001/archneur.1986.00520090031012
- R. Bonita, R. Beaglehole and J. D. K. North, “Event, Incidence and Case Fatality Rates of Cerebrovascular Disease in Auckland, New Zealand,” American Journal of Epidemiology, Vol. 120, 1994, pp. 236-243.
- C. S. Anderson, K. D. Jamrozik, P. W. Burvill, T. M. H. Chakera, G. Johnson and E. G. Stewart-Wynn, “Ascertaining the True Incidence of Stroke: Experience from the Perth Community Stroke Study,” Medical Journal of Australia, Vol. 158, No. 2, 1993, pp. 80-84.
- K. Asplund, R. Bonita, K. Kuulasmaa, A. M. Rajakangas, V. Feigin, H. Schaedlich, K. Suzuki, P. Thorvaldsen and J. Tuomilehto, “For the WHO MONICA Project on Multinational Comparisons of Stroke Epidemiology: Evaluation of Case Ascertainment in the WHO MONICA Stroke Study,” Stroke, Vol. 26, 1995, pp. 355-360. doi:10.1161/01.STR.26.3.355
- G. C. Hawkins, R. Bonita, J. B. Broad and N. E. Anderson, “Inadequacy of Clinical Scoring Systems to Differentiate Stroke Subtypes in Population-Based Studies,” Stroke, Vol. 26, 1995, pp. 1338-1342. doi:10.1161/01.STR.26.8.1338
- C. Allen, “Clinical Diagnosis of Acute Stroke Syndrome,” QJM: An International Journal of Medicine, Vol. 52, No. 4, 1983, pp. 515-523.
- N. Poungvarin, A. Viriyavejakul and C. Komontri, “Siriraj Stroke Score and Validation Study to Distinguish Supratentorial Intracerebral Hemorrhage from Infarction,” British Medical Journal, Vol. 302, 1991, pp. 1565- 1567. doi:10.1136/bmj.302.6792.1565
- J. Bamford, P. Sandercock, M. Dennis, J. Burn and C. Warlow, “A Prospective Study of Acute Cerebrovascular Disease in the Community: The Oxfordshire Community Stroke Project - 1981-86.2. Incidence, Case Fatality Rates and Overall Outcome at One Year of Cerebral Infarction, Primary Intracerebral and Subarachnoid Haemorrhage,” Journal of Neurology, Neurosurgery & Psychiatry, Vol. 53, No. 1, 1990, pp. 16-22. doi:10.1136/jnnp.53.1.16
- O. K. Kolapo, A. S. Ogun, M. A. Danesi, B. S. Osalusi and K. A. Odusote, “Validation Study of the Siriraj Stroke Score in African Nigerians and Evaluation of the Discriminant Values of Its Parameters: A Preliminary Prospective CT Scan Study,” Stroke, Vol. 37, 2006, pp. 1997-2000. doi:10.1161/01.STR.0000229893.02732.02
- Y. W. Nyandaiti and S. A. Bwala, “Validation Study of the Siriraj Stroke Score in North-East Nigeria,” Nigerian Journal of Clinical Practice, Vol. 11, No. 3, 2008, pp. 176-180.
- T. J. Pedley, “The Fluid Mechanics of Large Blood Vessels,” Cambridge University Press, Cambridge, 1980. doi:10.1017/CBO9780511896996
- N. Stergiopulos, D. F. Young and T. R. Rogge, “Computer Simulation of Arterial Flow with Applications to Arterial and Aortic Stenosis,” Journal of Biomechanics, Vol. 25, No. 12, 1992, pp. 1477-1488. doi:10.1016/0021-9290(92)90060-E
- M. S. Olufsen, “Structured Tree Outflow Condition for Blood Flow in Larger Systemic Arteries,” American Journal of Physiology, Vol. 276, 1999, pp. H257-H268.
- N. P. Smith, A. J. Pullan and P. J. Hunter, “An Anatomically Based Model of Transient Coronary Blood Flow in the Heart,” SIAM Journal on Applied Mathematics, Vol. 62, No. 3, 2002, pp. 990-1018. doi:10.1137/S0036139999355199
- G. Babagana, A. A. Susu and O. O. Fasanmade, “Mathematical Modeling of Stenosed Distensible Blood Vessels,” Global Journal of Engineering and Technology, Vol. 3, No. 3, 2010, pp. 503-511.
- P. Roe and J. Pike, “Efficient Conservation and Utilisation of Approximate Riemann Solution,” Computing Methods in Applied Science and Engineering, Vol. 6, 1984, pp. 499-558.
- P. D. Lax and B. Wendroff, “Systems of Conservation Laws,” Communications on Pure and Applied Mathematics, Vol. 13, No. 2, 1960, pp. 217-237. doi:10.1002/cpa.3160130205
- M. R. Kaazempur-Mofrad, S. Wada, J. G. Myers and C. R. Ethier, “Mass Transport and Fluid Flow in Stenotic Arteries: Axisymmetric and Asymmetric Models,” International Journal of Heat and Mass Transfer, Vol. 48, No. 21-22, 2005, pp. 4510-4517.