Engineering
Vol. 3 No. 11 (2011) , Article ID: 8663 , 9 pages DOI:10.4236/eng.2011.311139
Fatigue Performance of Precast FRP-Concrete Composite Deck with Long Span
Structural System Research Division, Korea Institute of Construction Technology, Goyang-Si, Republic of Korea
E-mail: kcho@kict.re.kr
Received August 23, 2011; revised September 15, 2011; accepted September 22, 2011
Keywords: FRP, concrete, composite deck, long span, fatigue performance
ABSTRACT
The fatigue performance of precast FRP-concrete composite (PFC) deck is evaluated. This type of deck enables a reduction of the weight by 30% compared to conventional reinforced concrete decks owing to the composition of a hollow FRP panel with concrete. Therefore, the application of such deck in cable-stayed bridge will reduce effectively the weight of the superstructure leading also to substantial savings in the materials required for the superstructure and substructure and, therefore, achieve significant improvement of the economic efficiency. Static, pulsating fatigue and rolling fatigue tests were carried out on 4 m × 4 m precast FRP-concrete composite decks. All the specimens did not fail even after 2 million fatigue cycles, and the subsequent static tests conducted on these specimens verified that all the design criteria were satisfied. These experimental results demonstrated that the PFC deck developed in this research secures sufficient performa-nces for future applications for cable-stayed bridges.
1. Introduction
The FRP-concrete composite deck combines FRP and concrete by placing concrete over a permanent FRP form. This deck has been developed and applied in various forms [1-4]. Such deck is dedicated to short and medium spans of which constructability and economic efficiency are improved owing to the lightweight, high strength and remarkable durability and resistance to corrosion of FRP. Especially, the FRP-concrete composite deck developed by Cho et al. [2] is lighter than other types of decks by adopting a hollow FRP panel at the bottom of the section. Such lightweight constitutes a strong advantage for bridges of which economic efficiency is sensitive to the weight like cable-stayed bridges [5].
However, differently from short to medium span decks, the deck of long-span bridges like cable-stayed bridges is disposed on cross-beams, which makes the direction of the strong axis of the deck coincide with that of the bridge’s longitudinal axis. Moreover, short spacing between the cross-beams results in loss of constructability and economic efficiency since this spacing corresponds to the span length of the deck. This explains the choice for longer deck span. Accordingly, in order to apply the deck developed by Cho et al. [2] to long-span bridges, need is not only to lengthen the span length of the deck but also to analyze the design in the case where the strong axis of the deck coincides with the longitudinal axis of the bridge. In addition, precasting of the deck is also required to improve the constructability and economic efficiency by reducing the construction period.
To that goal, a solution consisting of wrapping the whole FRP-concrete composite deck by concrete was conceived as shown in Figure 1. Such solution presents the advantage to lengthen the deck span length by reducing the shortening of the effective length caused by the haunch. Furthermore, another advantage is the possibility to apply the conventional deck connection methods used in previous precast decks like loop connection.
This study intends to investigate the fatigue performance of such precast FRP-concrete composite deck (PFC deck) for long span bridges purpose. The main factor influencing directly the fatigue performance of the PFC deck is the connection performance between FRP and concrete. Here, composition is realized by coarse sand coating and FRP connector. Coarse sand coating achieves performance near to perfect composition in the tangential (shear) direction [6], but offers practically no resistance in the normal (vertical) direction [7]. Therefore, FRP connector is adopted to compensate the verti-

Figure 1. Basic shape of precast FRP-concrete deck.
cal resistance. Both pulsating fatigue test and rolling fatigue test are carried out as fatigue test methods. The rolling fatigue test is more conservative than the pulsating fatigue test and provides fatigue patterns similar to those observed in real decks [8].
2. Experimental Program
2.1. Specimen Details
The specimen pool includes 1 specimen for the evaluation of the static performance (DCS), 1 specimen for the evaluation of the pulsating fatigue performance (DCFP), and 1 specimen for the evaluation of the rolling fatigue performance (DCFR) as listed in Table 1. Specimen DCS is considered as the reference specimen to evaluate the behavior and performance before fatigue and is considered to allow future comparison with the fatigue specimens. The difference in the fatigue loads between the two fatigue specimens is due to the will to reflect the difference in the installation conditions of these specimens. Detailed explanation is given in Subsection 2.2.
The span length of the specimens is set to 4 m to correspond with real span lengths. The width is also set to 4 m in order to enable the deck to exhibit sufficiently bidirectional behavior. Figure 3 illustrates the cross-sectional shape of the specimens and Figure 2 shows the sectional shape at the center of the specimens. Loop connection is introduced in the precast decks for the connection of contiguous decks above the cross-beam. The FRP module is constituted by 2 cells and each cell has dimensions of about 200 mm (width) 150 mm (height). In addition, the FRP connectors are fabricated
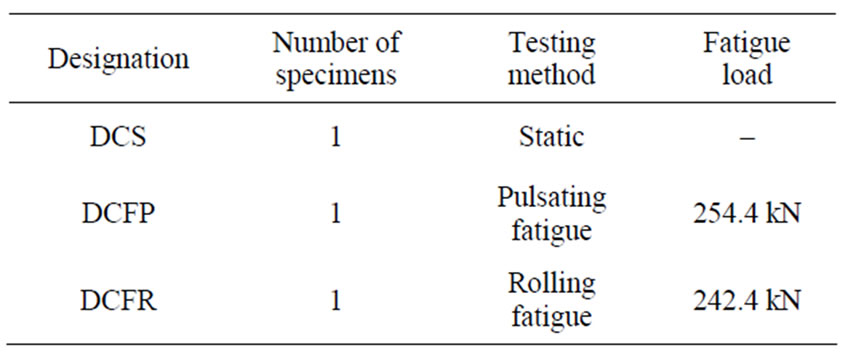
Table 1. Types of specimen.
monolithically with the FRP module. In the case where the FRP connectors are fabricated separately and bonded afterward, the fabrication becomes troublesome and the bonded interface may create week points prone to damage. Table 2 arranges the mechanical properties of the FRP module fabricated by pultrusion.
The FRP panel was fabricated at first by epoxybonding 10 FRP modules per specimen. Then, coarse sand coating was applied over the panel as shown in Figure 4. According to the work of Cho et al. (2010) [9], coarse sand coating was bonded using epoxy to achieve a distribution of 4 kg/m2 of the aggregates with grain size of 4 - 7 mm so as to develop optimal performance.
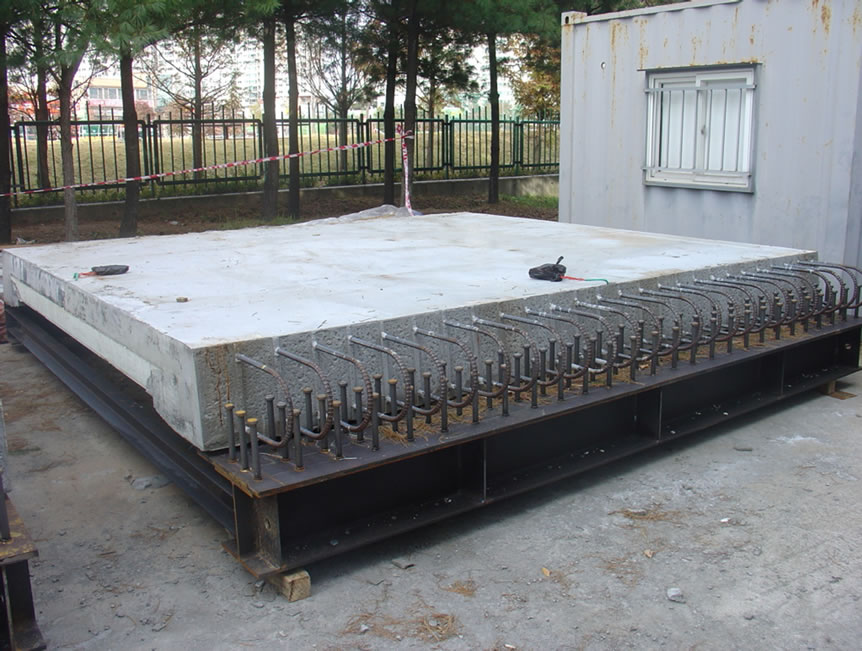
Figure 5 presents the fabrication process of the specimens: 1) assembling of rebar over the coarse sand coated FRP panel; 2) completion of the precast deck segment by placing concrete; 3) installation of the completed deck on a H-beam equipped with studs representing the crossbeam; 4) placing of non-shrinkage mortar up to the bottom of the deck; step 5) shows the connection after chipping of the interface and before placing of concrete; and, 6) completion of deck segment by placing connection concrete. The compressive strength of concrete in the
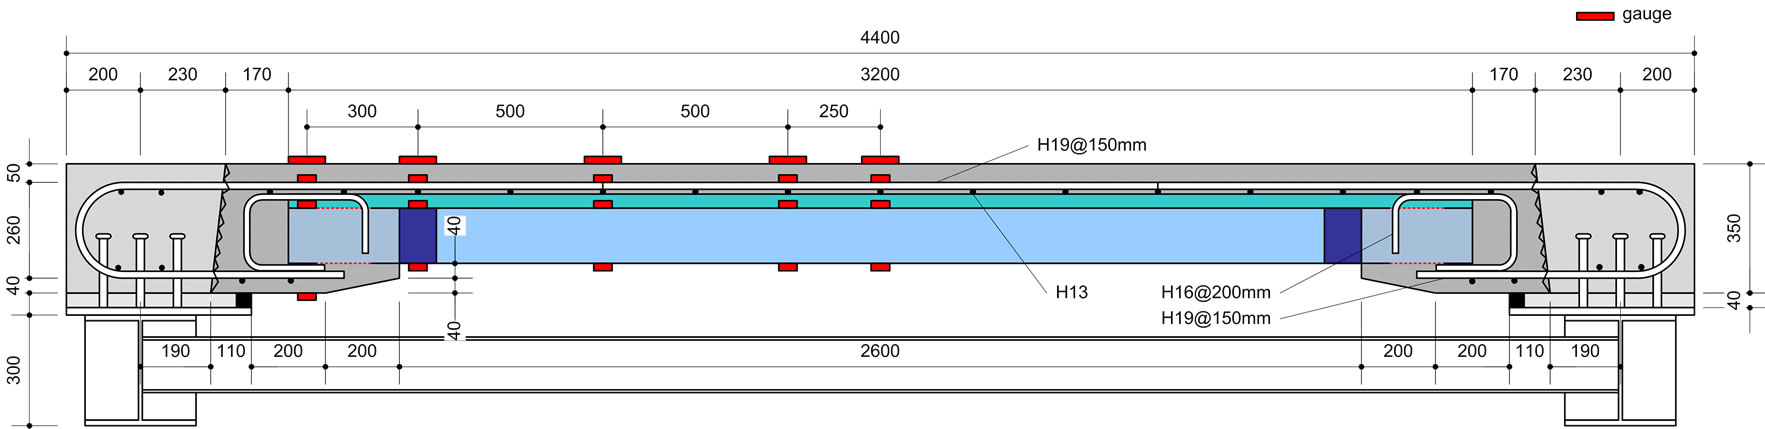
Figure 2. Longitudinal section of specimen.
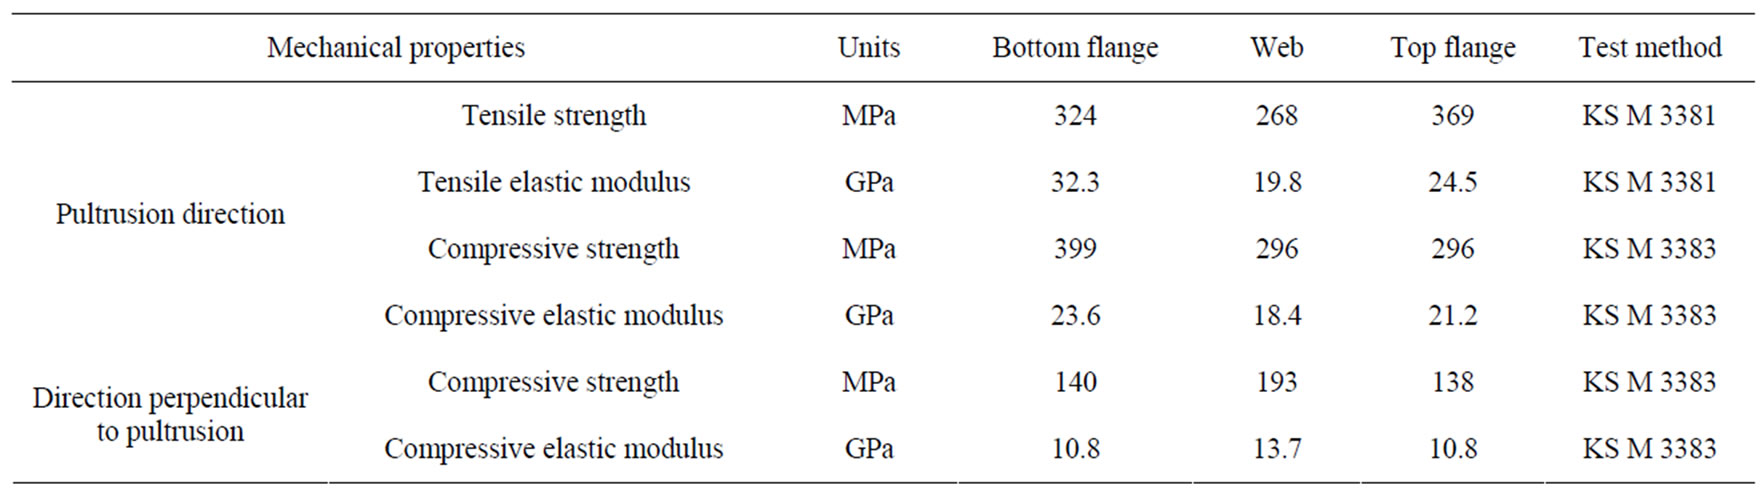
Table 2. Mechanical properties of FRP module.
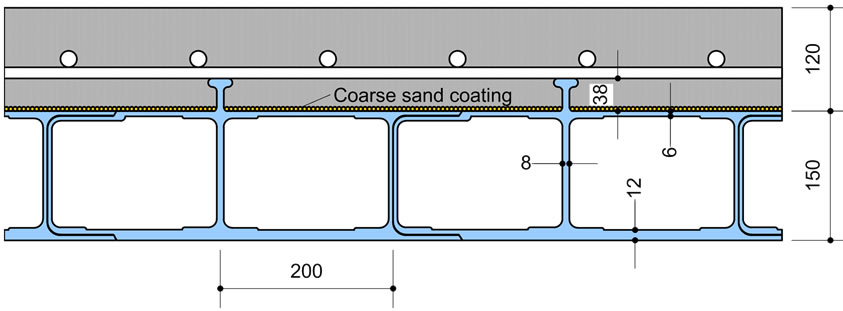
Figure 3. Cross-sectional shape of specimen.
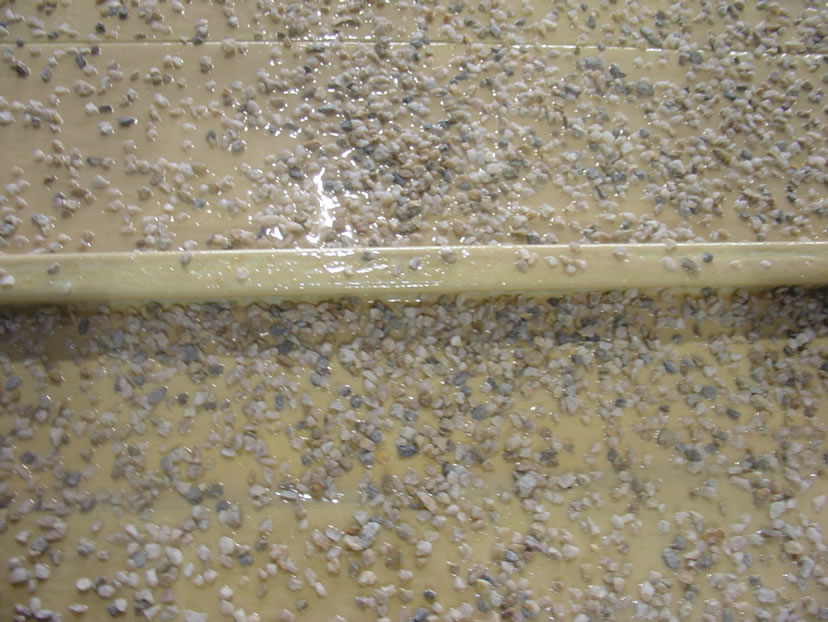
Figure 4. Coarse sand coated FRP panel.
firstly placed precast deck portion averaged 42.3 MPa, and that of the second placement in the connection reached 40.1 MPa.
2.2. Determination of the Fatigue Load
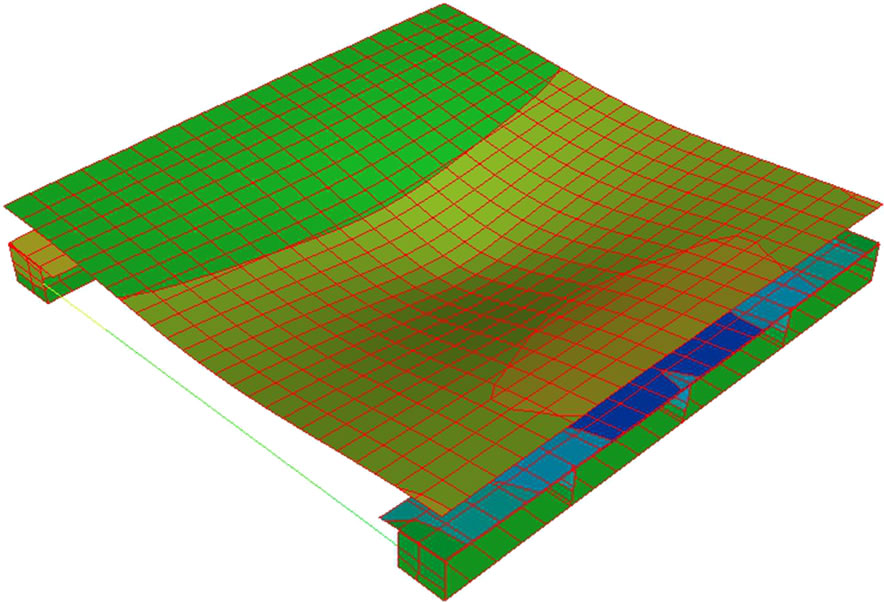
The fatigue load for the specimens was determined with reference to the design live load moment. The design live load moment acting on the PFC deck reaches 47.7 kN× m/m, which corresponds to the loading of two vehicles. Analysis was performed to obtain the load generating such live load moment on the specimen. In the analysis, all the diverse members used for the installation of the specimen were also modeled to achieve the actual boundary conditions of the specimen. In the pulsating fatigue test, the H-beam representing the cross-beam is directly fixed on the support blocks, while an additional H-beam is adopted in the rolling fatigue test (Figure 6).
For the DCFP specimen (pulsating fatigue specimen), a moment of 21.6 kN×m/m develops under application of the live load of 96 kN. Converting this load with respect to the design live load moment, this load becomes 212 kN. Considering a safety factor of 20%, the fatigue load is computed to as 254.4 kN. Besides, the moment developed in the DCFR specimen (rolling fatigue specimen) under application of the live load of 96 kN is 22.6 kN×m/m. The corresponding fatigue load obtained through conversion with respect to the design live load moment is 202 kN, which becomes 242.4 kN considering an additional safety factor of 20%.
 (a)
(a) (b)
(b)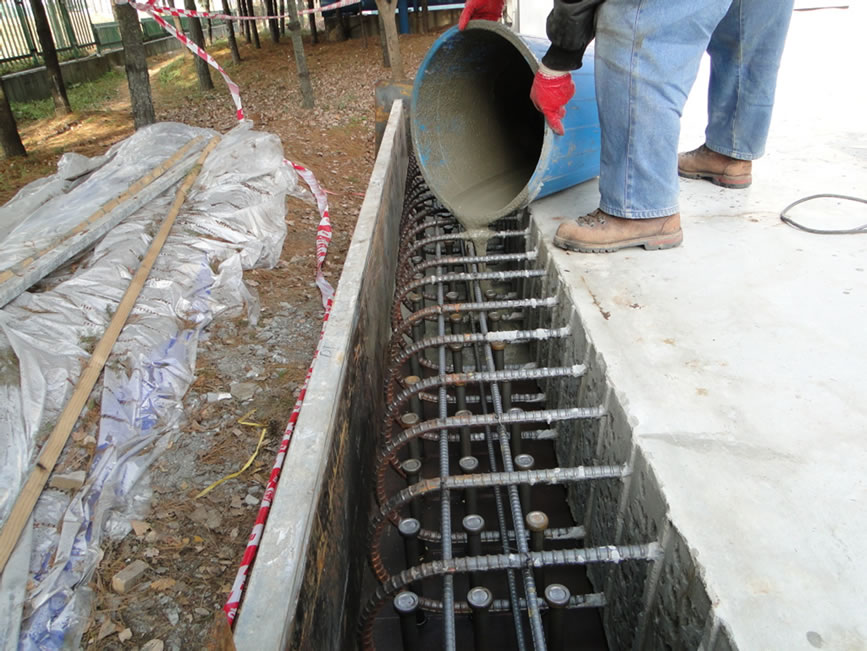 (c)
(c)
 (d)
(d)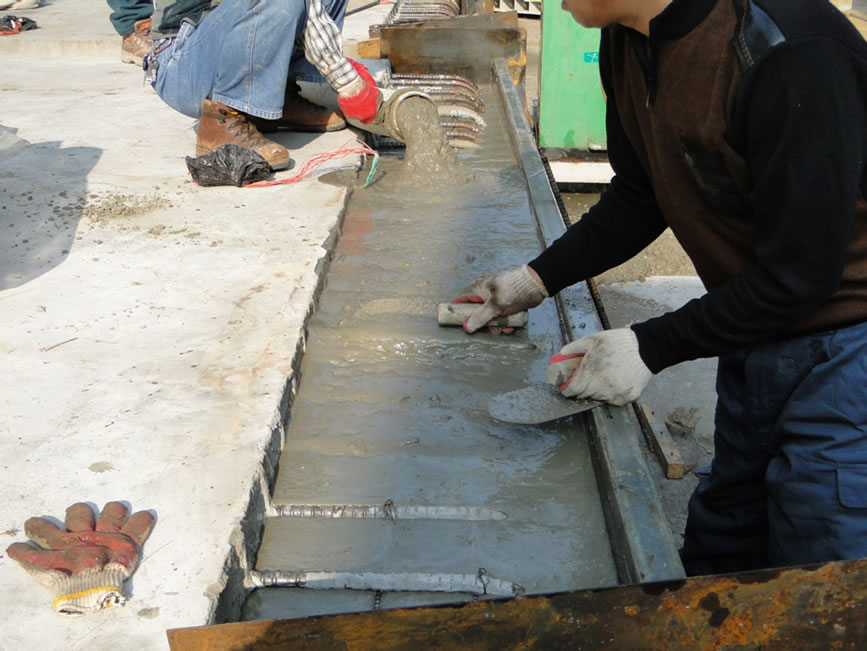 (e)
(e)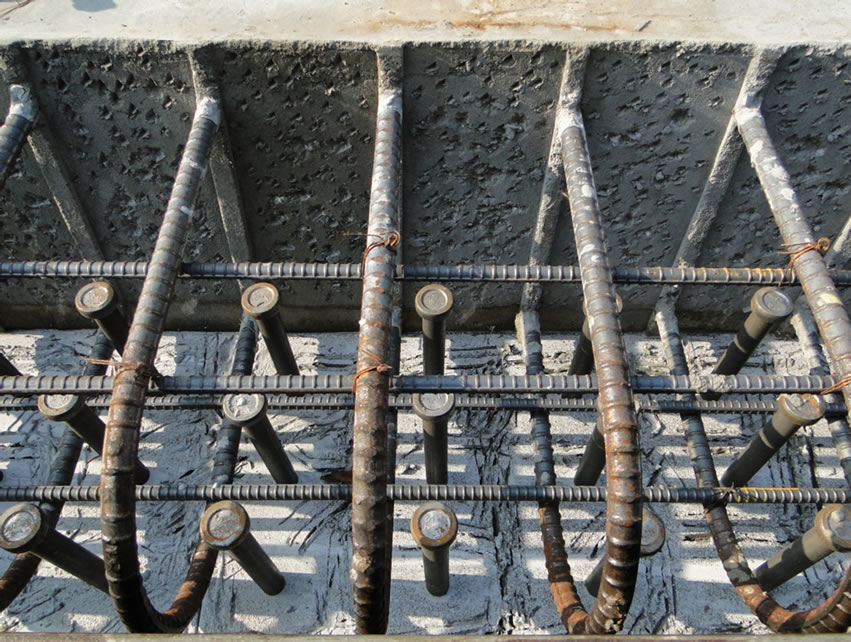 (f)
(f)
Figure 5. Fabrication process of specimens. (a) Assembling of rebar; (b) Placing of deck’s concrete; (c) Installation of deck segment on girder; (d) Placing of non-shrinkage mortar; (e) Chipping of connection interface; (f) Placing of connection concrete.
 (a)
(a)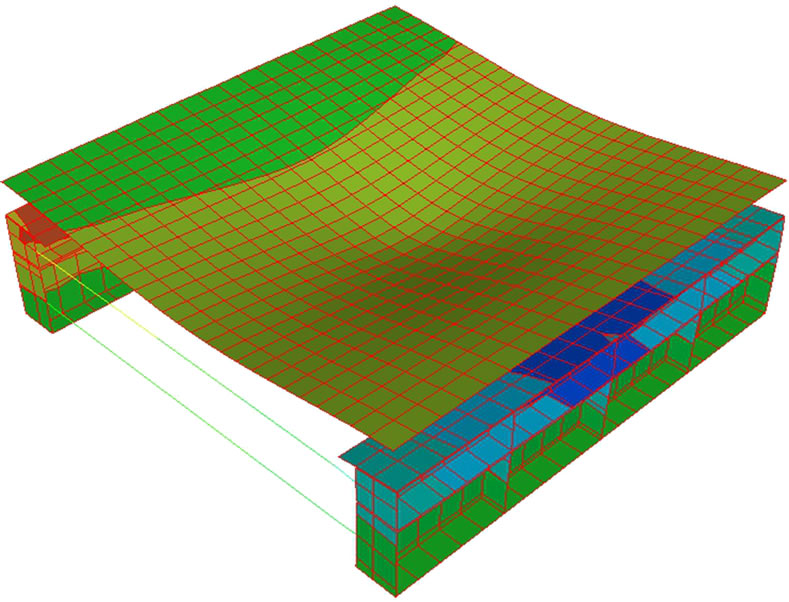 (b)
(b)
Figure 6. Analysis of specimens for the determination of the fatigue load. (a) Pulsating fatigue; (b) Rolling fatigue.
2.3. Testing Procedure and Measurement
The specimens were fixed on the support blocks to enable measurement of the negative moment behavior above the cross-beam. For the static loading test and pulsating fatigue test, the load was applied on a loading surface of 230 mm (longitudinal direction) × 580 mm (transverse direction) at the center of the deck. In the case of the rolling fatigue test, loading plates of 230 mm × 580 mm were continuously installed and a steel plate was disposed over the plates to enable loading by the moving vertical load. Figure 7 shows the fatigue loading tests.
After each specimen experienced the specified number of fatigue cycles, static loading test was conducted to evaluate the degree of damage with respect to the number of cycles. Since the degree of damage can be assessed by means of the deflection or the cross-sectional strain, displacement sensors were disposed at the bottom of the center of the specimens, and strain gauges were installed at locations distant longitudinally from the center by 0, 250, 750, 1250, and 1550 mm as shown in Figure 2. Moreover, 2 strain gauges were also installed at different heights in the FRP module at each location together with 2 strain gauges embedded inside concrete to observe the distribution pattern of the strain inside the section as well as to measure relative slip that might occur at the interface.
3. Experimental Results and Discussion
3.1. Static Failure Pattern
In order to examine the position of the cracks occurring in the negative moment zone of the static loading specimen (DCS), preliminary loading test was carried out up to cracking before the tests. Cracking initiated under loading of about 230 kN above the location corresponding to the end of the haunch. The occurrence of cracks at the end of the haunch indicates that the effective length of the deck may be shortened due to the presence of the haunch. After removal of the preliminary load, crack gauges were installed and loading was applied through displacement control at speed of 0.5 mm/min.
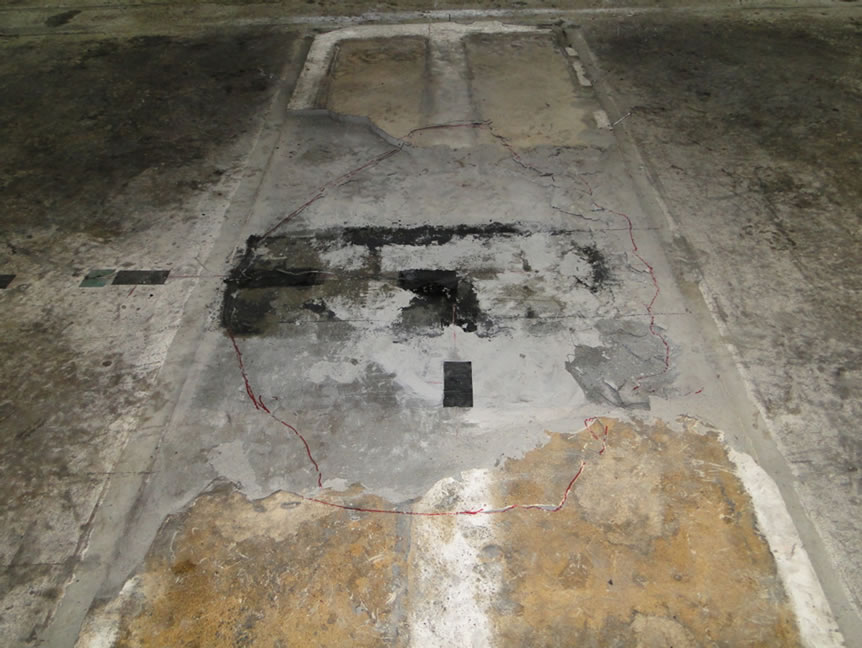
Nearly circular crack with its center at the loaded portion was observed at load of about 250 kN in a partial zone at the top of the deck. Furthermore, the cracks initiated at the end of the haunch propagated transversally with the increase of the load. Finally, punching failure occurred at 1098 kN as shown in Figure 8.
3.2. Fatigue Damage Pattern
The values of the vertical load applied on the fatigue specimens were 254.4 kN for the pulsating fatigue and 242.4 kN for the rolling fatigue, corresponding respectively to 23% and 22% of the static failure strength. The DCFP and DCFR specimens subjected to the repeated action of this vertical load did not fail even after 2 million cycles. Residual performance test was conducted on the specimens that did not experience fatigue failure. The results are discussed in Subsection 3.3. Negative moment cracks developed in the first fatigue cycles at the top of concrete at the end of the haunch. Thereafter, microcracks initiated in partial zones under continuing cyclic loads but did not propagate significantly.
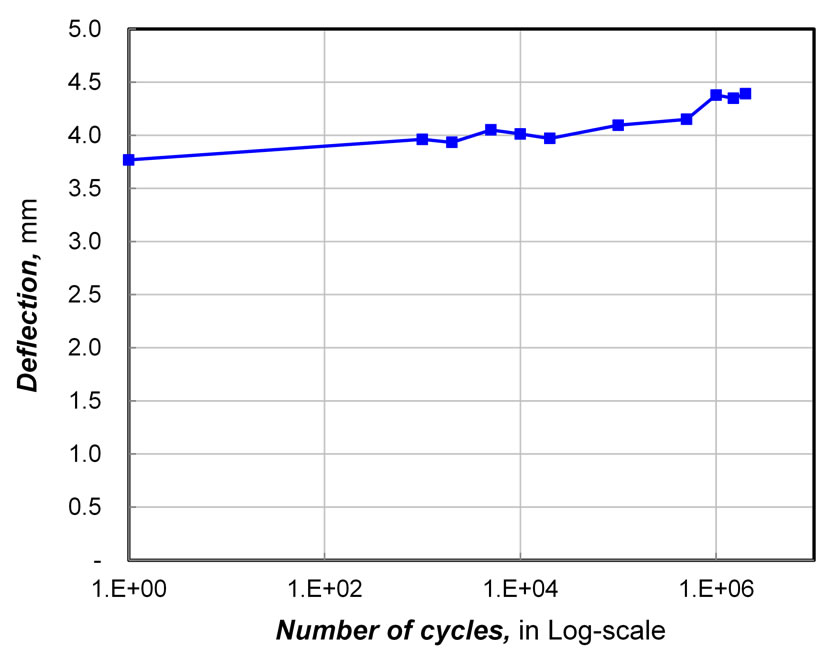
Figure 9 plots the variation of the deflection and strain at the center of the deck (DCFP specimen) according to the number of fatigue cycles with reference to the applied load of 254.4 kN. In fact, strain gauges were also installed at the top surface of the FRP panel but the gauges were damaged since the start of the test. The de-
 (a)
(a)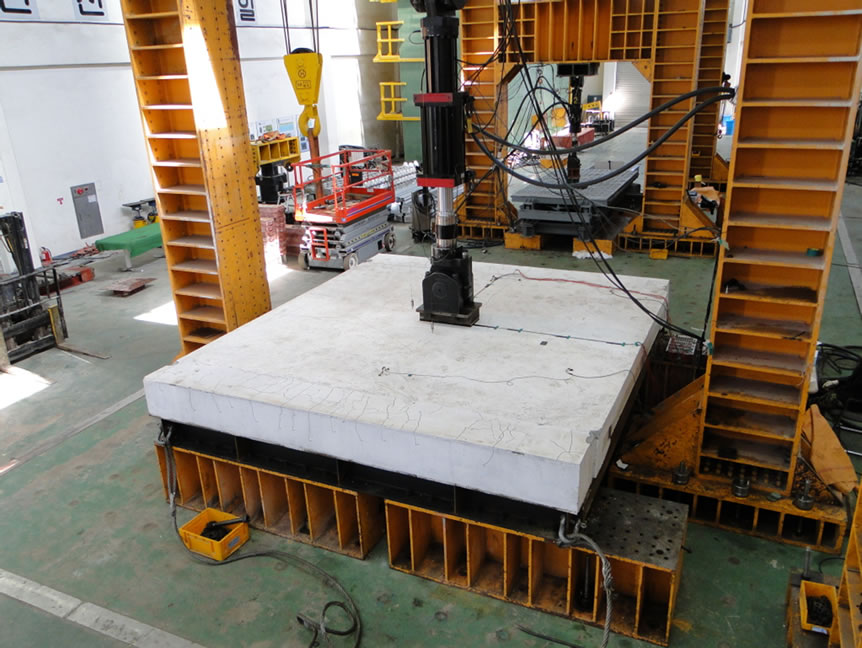 (b)
(b)
Figure 7. View of fatigue loading tests. (a) Pulsating fatigue test; (b) Rolling fatigue test.

Figure 8. Punching failure pattern in the static test specimen.
flection was 3.8 mm at the beginning and increased by 17% to reach 4.4 mm at 2 million cycles. The strain at the bottom of FRP also experienced change from 487 × 10–6 to 569 × 10–6 showing an increasing rate of about 17%. Besides, the strain of concrete changed to exhibit reduction of the curvature of the concrete section and downward shift of the neutral axis. This phenomenon appears when crack occurs in the surrounding concrete. The behavioral pattern in the graph verifies indirectly the damage pattern of the surrounding cracked concrete. The variation of the curvature with respect to the initial curvature reaches approximately 11% showing that the degree of damage is relatively small.
Figure 10 shows the strain distribution pattern in the longitudinal direction from the center of the deck (DCFP specimen). The comparison of the state of the deck before application of the fatigue load and after 2 million cycles indicates that larger damage occurred at the center
 (a)
(a)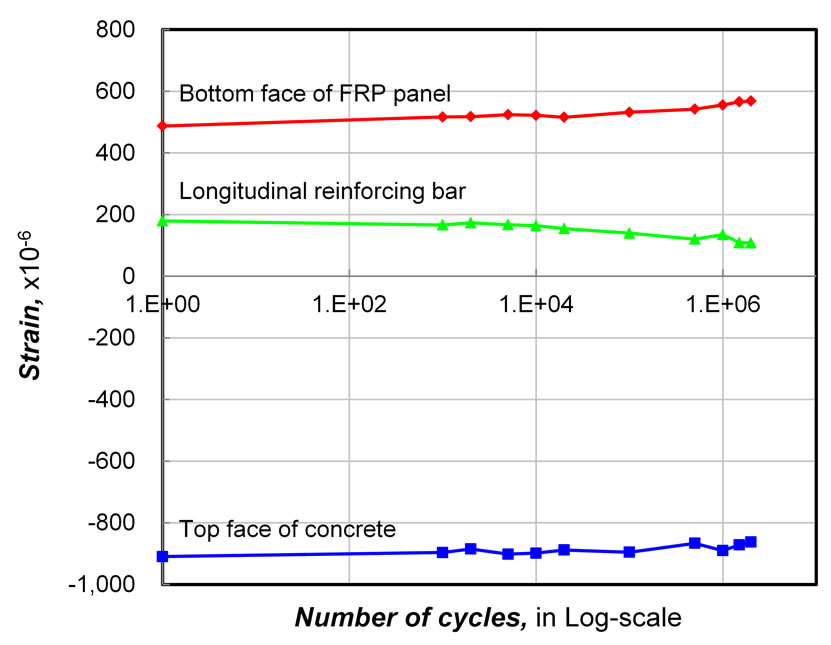 (b)
(b)
Figure 9. Damage pattern at the center with respect to the number of cycles, (a) Deflection; (b) Strain.
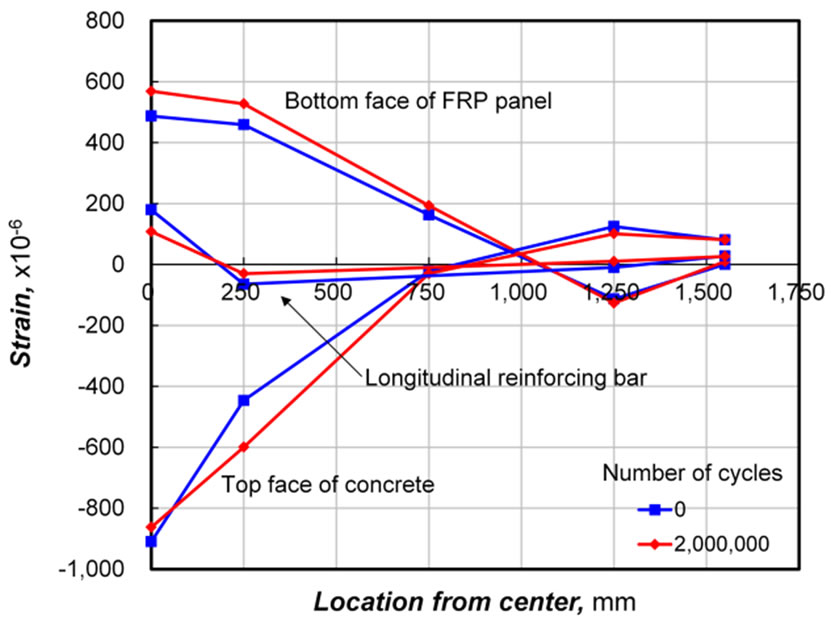
Figure 10. Pattern of the change of strain by longitudinal position.
of the deck than at the supports. This phenomenon can be explained by the larger moment acting on the loading surface. The main cause of such damage can be found in the cracking of concrete surrounding the interface and the resulting damage of the interface. Generally, the interface tends to experience brittle failure in which damage propagates suddenly. However, such failure could practically not be observed in specimen DCFP, where damage occurred proportionally to the size of the applied moment. In addition, the extent of damage being relatively small, it can be asserted that the coarse sand coating and FRP connector chosen to compose FRP and concrete for the PFC deck bears sufficient applicability.
3.3. Residual Performance
Static loading test was conducted to examine the residual performance of the two specimens that did not experience fatigue failure. Loading was applied until failure at speed of 0.5 mm/min. Similarly to the static loading specimen, circular cracking with the center located at the loaded portion was observed according to the increase of the load in a partial zone at the top of the deck. Finally, punching failure occurred as shown in Figure 11.
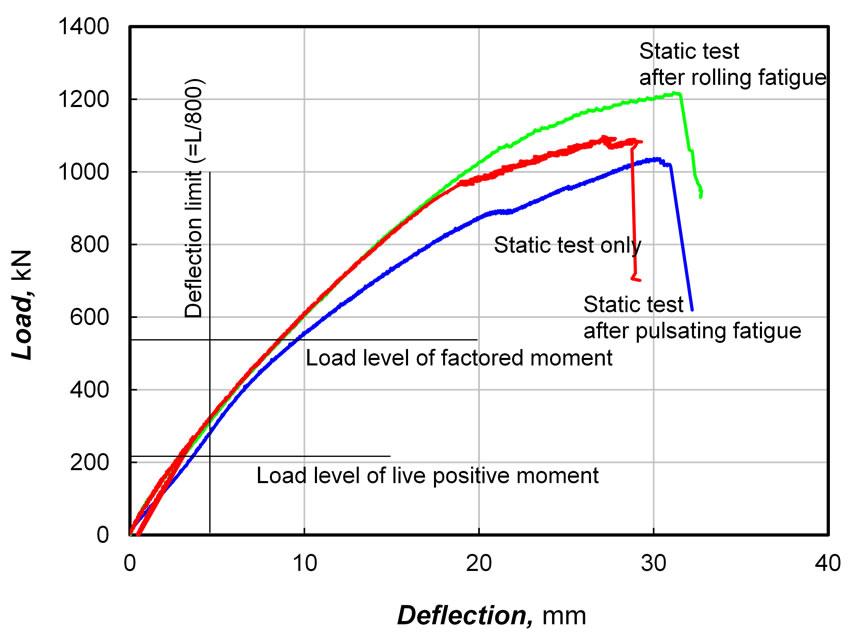
Figure 12 plots the load-deflection and load-crack width curves measured during the static loading tests of the fatigue and static test specimens. Compared to specimen DCS, specimen DCFP exhibits a failure strength smaller by about 5.6% while specimen DCFR shows nearly identical behavioral pattern with a failure strength larger by approximately 10.9%. This verifies that the PFC deck is practically immune to the occurrence of fatigue damage.
Table 3 compares the design criteria and experimental results. The design criteria under service load state involve the deflection and crack width. The measured deflection ranging between 2.8 mm and 3.5 mm satisfies the deflection criterion of 4.625 mm (= L/800, L: span length). Moreover, the crack width occurring at the negative moment zone also satisfies sufficiently the allowable crack width of 0.3 mm.
The shear strength and flexural strength under ultimate state should also be checked. Since all the specimens experienced failure due to punching shear, the shear strength can be known but the flexural strength cannot be verified exactly. However, the flexural strength of these specimens is at least larger than the shear strength. Therefore, the value of the shear strength of the specimens can be assumed to be the minimum flexural strength, and this value can be set as a reference for comparison with the design criteria.
 (a)
(a) (b)
(b)
Figure 11. Punching failure pattern during the evaluation of the residual performance of the fatigue test specimens. (a) Pulsating fatigue specimen; (b) Rolling fatigue specimen.
 (a)
(a)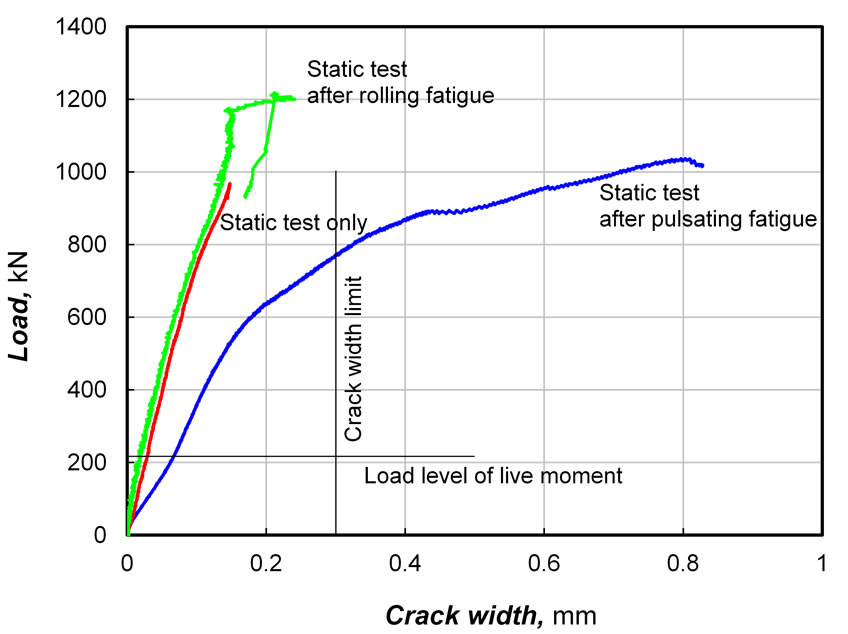 (b)
(b)
Figure 12. Behavioral characteristics of the specimens, (a) Load-deflection curves; (b) Load-crack width curves.
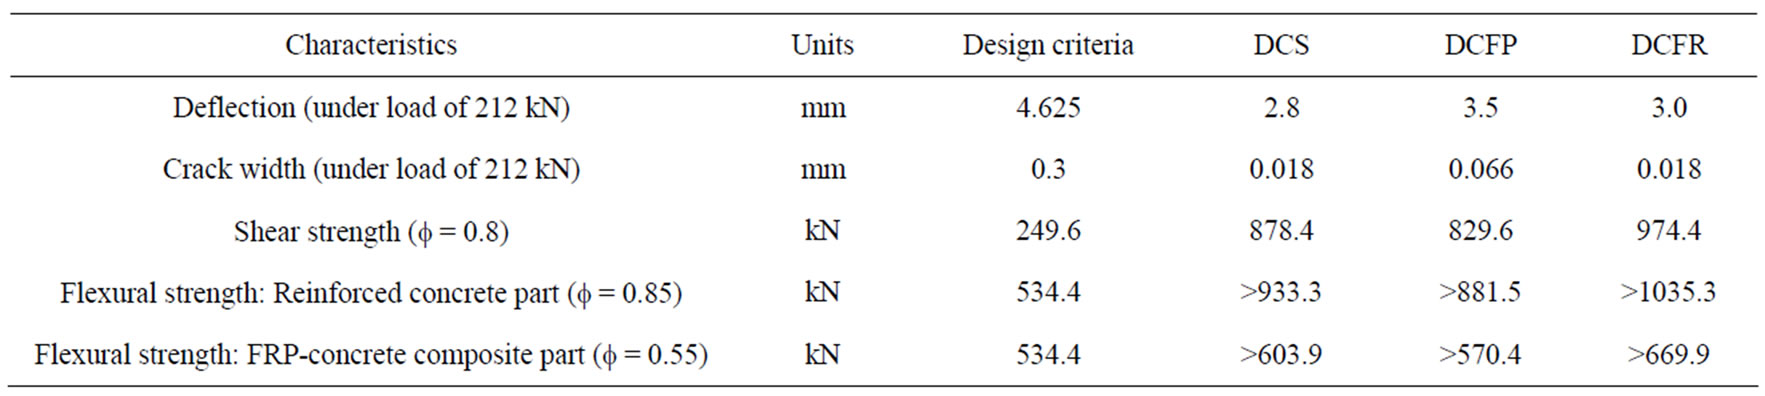
Table 3. Comparison of experimental results and design criteria.
The PFC deck can be divided into two parts: the FRPconcrete composite structure and the reinforced concrete structure around the support. Accordingly, adequate strength reduction factors should be applied with respect to each of the structural type. For the reinforced concrete structure, strength reduction factors of 0.85 for flexure and 0.8 for shear were applied according to the Highway Bridge Design Code of Korea [10]. Besides, the following strength reduction factors were decided with reference to the ACI Committee 440 [11] for the FRP-concrete composite structure. For structures reinforced by FRP bar, it was decided to apply the strength reduction factor for the shear in reinforced concrete structure as it is. Accordingly, the strength reduction factor of 0.8 specified for reinforced concrete structures in Korea was applied. For the flexure, decision was made to apply a shear reduction factor ranging between 0.55 and 0.65 according to the failure pattern. Here, a value of 0.55 was applied for conservative purpose.
Table 3 arranges the values of the reduced strengths of the specimens. The reduced shear strengths were computed by multiplying the shear failure strength of specimen DCS (1,098 kN), DCFP (1,037 kN) and DCFR (1,218 kN) by a strength reduction factor of 0.8. The comparison of these reduced strengths with the design strength relative to shear of 249.6 kN shows that the specimens satisfy sufficiently the shear design criterion. In addition, the minimum flexural strength determined with reference to the shear strength is also seen to satisfy the design criteria even when the flexural reduction factor is applied.
These results show that the PFC deck satisfies the design criteria even after 2 million pulsating or rolling fatigue cycles. This indicates that the PFC deck offers sufficient endurance to fatigue.
4. Conclusions
The durable performance of the precast FRP-concrete composite (PFC) deck was investigated through pulsating fatigue and rolling fatigue tests. Three types of fullscale specimens were fabricated: a reference specimen for the evaluation of the static performance, a pulsating fatigue test specimen and a rolling fatigue test specimen. The results of the fatigue tests conducted using a vertical load corresponding to the service load weighted with a safety factor of 20% showed that the pulsating and rolling fatigue specimens did not fail even after 2 million cycles. Thereafter, static loading tests were performed in order to evaluate the residual performance of the two types of specimens that did not experience fatigue failure. The results revealed that the fatigue specimens exhibited failure strength similar to that of the static test specimen. In addition, the comparison with the design criteria indicated that the PFC deck satisfied the serviceability criteria involving the deflection and crack width as well as the strength criteria that are the shear strength and flexural strength. The coarse sand coating and FRP connector applied to achieve the composition of FRP and concrete were seen not only to provide sufficient fatigue performance but also to offer features preventing sudden propagation of failure. Consequently, it can be concluded that the PFC deck exhibits sufficient endurance to fatigue.
5. Acknowledgements
The “Development of deck systems for hybrid cablestayed bridge” project, an in-house project of the Korea Institute of Construction Technology has supported this research. The authors express their gratitude for the supports.
6. REFERENCES
- D. A. Dieter, J. S. Dietsche, L. C. Bank, M. G. Oliva and J. S. Russell, “Concrete Bridge Decks Constructed with Fiber-Reinforced Polymer Stay-in-Place Forms and Grid Reinforcing,” Transportation Research Record: Journal of the Transportation Research Board, 1814, Paper No. 02-3205, 2002, pp. 219-226.
- K. Cho, S. Y. Park, J.-R. Cho, S. T. Kim and B.-S. Kim, “Evaluation of Wheel Load Fatigue Performance of FRP-Concrete Composite Deck,” Proceedings of the 10th East Asia-Pacific Conference on Structural Engineering & Construction (EASEC-10), Bangkok, 2006, pp. 261- 266.
- T. Keller, E. Schaumann and T. Vallee, “Flexural Behavior of a Hybrid FRP and Lightweight Concrete Sandwich Bridge Deck,” Composites Part A: Applied Science and Manufacturing, Vol. 38, No. 3, 2007, pp. 879-889. doi:10.1016/j.compositesa.2006.07.007
- L. C. Bank, M. G. Oliva, H.-U. Bae and B. V. Bindrich, “Hybrid Concrete and Pultruded-Plank Slabs for Highway and Pedestrian Bridges,” Construction and Building Materials, Vol. 24, No. 4, 2010, pp. 552-558. doi:10.1016/j.conbuildmat.2009.10.002
- K. Cho, S. Y. Park, S. T. Kim, J.-R. Cho and B.-S. Kim, “Development of FRP-Concrete Composite Deck with Long Span,” Proceedings of the 9th International Symposium on Fiber Reinforced Polymer Reinforcement for Concrete Structures (FRPRCS-9), Sydney, 2009, pp. 1-4.
- K. Cho, J.-R. Cho, W.-J. Chin and B.-S. Kim, “Bond-Slip Model for Coarse Sand Coated Interface between FRP and Concrete from Optimization Technique,” Computers & Structures, Vol. 84, No. 7, 2006, pp. 439-449. doi:10.1016/j.compstruc.2005.10.004
- K. Cho, S. Y. Park, S. T. Kim, J.-R. Cho and B.-S. Kim, “Shear Connection System and Performance Evaluation of FRP-Concrete Composite Deck,” KSCE Journal of Civil Engineering, Vol. 14, No. 6, 2010, pp. 855-865. doi:10.1007/s12205-010-0932-8
- P. C. Perdikaris, M. F. Petrou and A. Wang, “Fatigue Strength and Stiffness of Reinforced Concrete Bridge Decks,” Final Report to ODOT, FHWA/OH-93(016), 1993.
- J.-R. Cho, K. Cho, S. Y. Park, S. T. Kim and B.-S. Kim, “Bond Characteristics of Coarse Sand Coated Interface between Stay-in-Place Fibre-Reinforced Polymer Formwork and Concrete Based on Shear and Tension Tests,” Canadian Journal of Civil Engineering, Vol. 37, No. 5, 2010, pp. 706-718. doi:10.1139/L10-012
- Korean Ministry of Land Transport and Maritime Affairs, “Bridge Design Code,” 2010 (in Korean).
- ACI Committee 440, “Guide for the Design and Construction of Structural Concrete Reinforced with FRP Bars,” ACI 440.1R-06, 2006, 44 Pages.