Materials Sciences and Applications
Vol.4 No.10(2013), Article ID:38130,7 pages DOI:10.4236/msa.2013.410078
Photo-Electrochemical Studies on TiO2-Doped Ce (III/IV) Oxides Nanoparticles in Aqueous Electrolytes
![]()
1School of Science, Indiana University Kokomo, Kokomo, USA; 2Purdue School of Science, Indiana University-Purdue University at Indianapolis, Indianapolis, USA.
Email: *kkasem@iuk.edu
Copyright © 2013 Kasem K. Kasem et al. This is an open access article distributed under the Creative Commons Attribution License, which permits unrestricted use, distribution, and reproduction in any medium, provided the original work is properly cited.
Received July 5th, 2013; revised August 21st, 2013; accepted September 4th, 2013
Keywords: Photoelectrochemical; Doped TiO2; Ceric Oxide; Nanoparticles; Photocatalysis
ABSTRACT
Photoelectrochemical studies on TiO2 doped with Ce2O3 or CeO2 took place in aqueous solutions of [Fe(CN)6]4− as the source of hydrated electrons. Our studies show that doping TiO2 with CeO2 gave better photocatalytic reduction of [Fe(CN)6]3− than TiO2 doped with Ce2O3. However the TiO2 assemblies doped with either Ce(III) or Ce(IV) oxides give less photochemical reduction of [Fe(CN)6]3− that the oxides of pure metals (Ti or Ce). In both cases a lowering of the band gaps of TiO2 was noticed. Immobilized TiO2 doped with Ce oxides on a FTO (Fluorine Ten Oxide) surface gave greater photocurrent with I2/I3– than that recorded for [Fe(CN)6]3−/4− redox systems. Our studies indicate that the TiO2 doped with Ce2O3 or CeO2 maintained photoactivity after being immobilized in thin solid sheets and can be used in all solid state photoelectron-chemical cells.
1. Introduction
Doping transition metal ions into the oxides of other transition metals has been widely performed on semiconductors to minimize or eliminate electron/hole recombination and enhance their absorption towards the visible light region [1-4]. To name but few that TiO2 doping with Fe(III), Mo(V), Ru(III), Os(III), Re(V), V(IV/V) and Zn(II) has been reported [5,6]. These studies were extended to use some rare earth ions as dopants in some stable photoactive transition metal oxides such as TiO2 [7-9]. Photo-dissociation of water into hydrogen and oxygen using powder suspensions of some semiconductors was recently reported by several researchers [10-17]. Most of the studies of the photo-dissociation of water were done over compact semiconductor electrodes [11]. Because of their larger surface areas [17] and their ability to carry out all reactions that were previously associated with massive semiconductor electrodes, colloidal semiconductors were used. In some systems, platinized semiconductors powders such as TiO2 were used for simultaneous production of oxygen and hydrogen. Several methods were used to generate ordered assemblies of narrow band gap semiconductor nanostructures for harvesting visible-light energy [5,6]. In most of these methods, one material with a specific band gap is being produced.
The following equation describes the important role that hydrated electrons ( ) can play in the photodissociation of water:
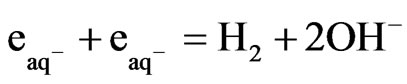 (1)
(1)
This reaction proceeds with the reported rate constant of reaction 1, which is k ≈ 1 × 10¹⁰ M−1∙sec−1 [18]. Under the photo excitation condition, [Fe(CN)6]4− allows an electronic transition that produces hydrated electrons according to the following equation:
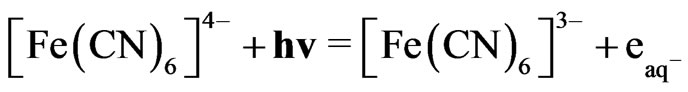 (2)
(2)
The disadvantage caused by the irreversibility of reaction 2 can be overcome through the use of a semiconductor system which acts as an electron donor and reduces [Fe(CN)6]3− back to [Fe(CN)6]4−. The optimum conditions could be reached if the rate of reduction of [Fe(CN)6]3− could be equated to the rate of formation of hydrated electrons from [Fe(CN)6]4−.
Heterogeneous reduction of hydrogen ions on colloidal suspensions of semiconductor’s nanoparticles is possible when a suitable hole-scavenger is present in the suspension medium. However, this process has several disadvantages: the limited conditions for such process to take place with respect to hydrogen ions; the great change in the pH at the surface of the semiconductor; and the effects on the semiconductor’s band gap position. With the high rate of photo-generation of hydrated electrons in homogenous solutions for reactions 1 and 2, it is possible that hydrogen can be generated heterogeneously and homogeneously by the photolysis of colloidal particles suspended in ferrocyanide solutions at room temperature.
Impurities in prepared metal oxides can affect their contribution to the photochemical behavior. Mixing some rare earth metal oxides with transition metal oxides may effectively reduce the impurities of the major component in the mixture [19]. This is because of the gettering effects of rare earth metals. Doping transition metals oxides with rare earth metals ions would guarantee the formation of a P-type semiconductor.
In this paper, we highlight the preparation of TiO2/ Ce2O3 and TiO2/CeO2 and the effects of Ce(III) or Ce (IV) as f-elements dopant may cause on the semiconductor’s properties of TiO2 and on the rate of hydrogen production during the photolysis process using photons of visible light. The possibility of using these systems in a solar energy-based photolysis cell that achieve the goal of reversible, cyclic, and efficient process for hydrogen production is explored.
2. Experimental
2.1. Reagents
All the reagents were of analytical grade.
2.2. Preparation
Following the reported procedure [20] , the following solutions were used: Solution A 2.843 g of Ti iso-propoxide/100 mL of CH2Cl2. Solution B 0.5486 g of (NH4)2CeNO3/10mL Di water; Solution C 5 g/100mL aqueous polyacrylamide solution (pH 12.7), Solution D: 0.40 g of Ce(NO3)3 in 6 mL of DI-water.
2.2.1. Synthesis of TiO2/CeO2 (4.5%)
Both solution A and B were added to solution C dropwise with constant stirring for 12 hours. The solid residue was separate using centrifuge. Dried at 70˚C for 6 hours, followed by calcination for 6 hours at 600˚C.
2.2.2. Synthesis of TiO2/Ce2O3 (9%)
Both solution A and D were added to solution C dropwise with constant stirring for 12 hours. The solid residue was separate using centrifuge. Dried at 70˚C for 6 hours, followed by calcination for 6 hours at 600˚C.
2.3. Instrumentation
2.3.1. Instrumentation
All electrochemical experiments were carried out using a conventional three electrode cell. A BAS 100 W electrochemical analyzer (Bioanalytical Co.) was used to perform the electrochemical studies. Steady reflectance spectra were performed using Shimadzu UV-2101 PC. Irradiations were performed with a solar simulator 300 watt xenon lamp (Newport) with an IR filter.
2.3.2. Photolysis Cell
Photolysis cell (Diagram 1), a one-compartment Pyrex cell with a quartz window facing the irradiation source [6]. The working electrode, a 10.0-cm2 platinum gauze cylinder, had a solution volume of 100 mL. Suspensions of 20 mg of the studied nanomaterial/100 mL of aqueous phosphate buffer at pH 6 were stirred with a magnetic stirrer during the measurements. The pH was fixed at 6 because below this value formation of Fex[Fe(CN)6]y was observed, while above pH 6 the photolysis of [Fe(CN)6]4− was very slow. An Ag/AgCl/Cl− reference electrode was also fitted into this compartment. A 10-cm2 platinum counter electrode was housed in a glass cylinder sealed in one end with a fine porosity glass frit.
2.4. Preparation of Thin Solid Film Electrode
PolyVinyl Pyridine (PVP) Electrolyte: 0.02 g of PVP, 0.002 g of LiTFMS (Lithium tri-fluoromethanesulfonate), and 0.005 g of C12H24Br2 were all dissolved in 5 mL of DMF. 10 mg of SC powder was homogeneously dispersed in this solution and spread evenly on ITO (1.25 cm × 5 cm × 2 mm) and let dry at 60˚C for 4 hours.
Photolysis using thin solid film: Diagram 2 illustrates the assembly of the thin solid-film electrode. The following is photoelectrochemical cell notation: ITO/Solid Electrolyte containing the SC/I2/I− in Phosphate Buffer/Pt (Counter /AgAgCl (Ref).
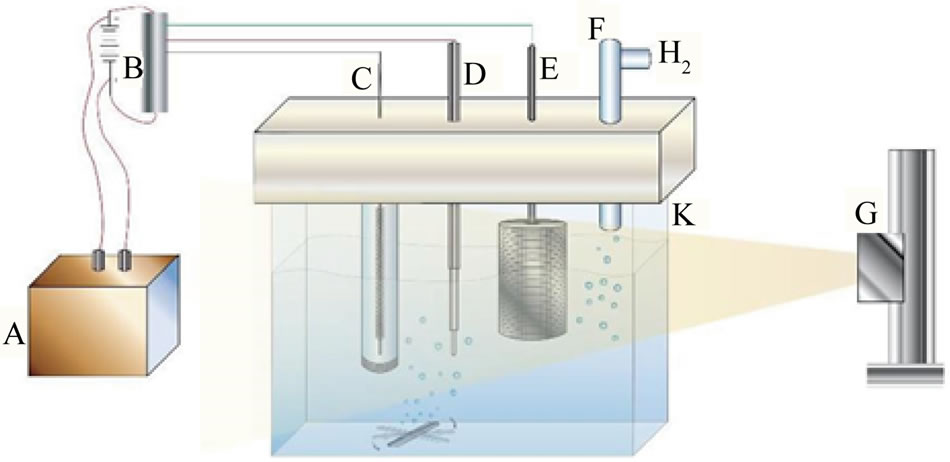
Diagram 1. Diagrams of photolysis cell: A = Photovoltaic generator, B = Light powered potentiostat, C = Counter electrode, D = reference electrode, E = Collector electrode (working electrode), F = gas outlet, G = Solar simulator and K = Cell glass body.
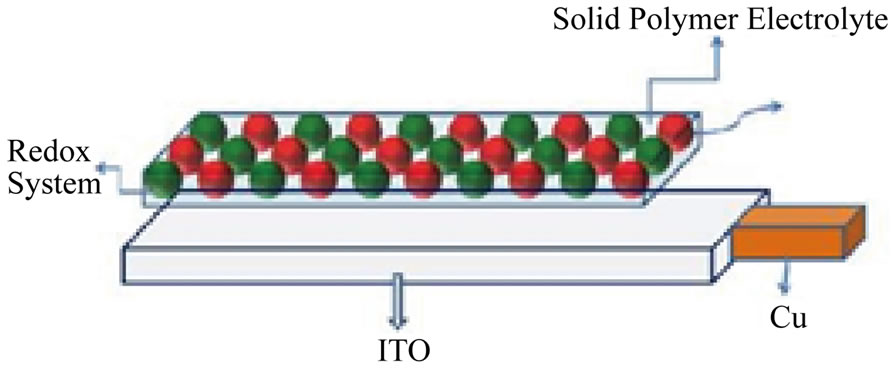
Diagram 2. Thin solid film electrode assembly.
3. Results and Discussion
3.1. Band-Energy Map of the Studied Oxides
The photo absorption behavior of the colloidal nanoparticles of the TiO2/Ce2O3 and TiO2/CeO2 mixtures was investigated using steady state reflectance spectra. The results are displayed in Figures 1 and 2. The approximate values of the band gaps derived from these figures are listed in Table 1. The following equations [21] were used to determine whether direct or indirect transition band structures exist in these doped oxides:
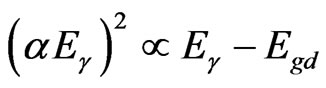 (3)
(3)
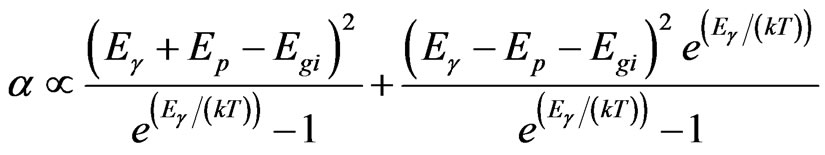 (4)
(4)
where α is absorption coefficient, Eg is the optical band gap.
The plot of α1/2vsEg allows identification of indirect band transitions, while the plot of (αEg)2vsEg will allow the determination of the direct transitions. These plots are known as Tauc plots. The results of these treatments are displayed in Figures 1(b) and (c) for TiO2/4.5% CeO2 and in Figures 2(b) and (c) for TiO2/9%Ce2O3 mixtures. The rest of the data listed in Table 1 are results of the analysis of Tauc plots.
The data listed in Table 1 indicate that addition of Ce(III) or Ce(IV) generally reduced the band gap of TiO2. However, when the concentration of Ce(III) was twice that of Ce(IV) in the studied oxide mixtures resulted in small reduction of the doped TiO2 band gap. Furthermore, the band gap of pure Ce2O3 and that of CeO2 are of close values. Such behavior is expected because the 4f1 electron of Ce(III) is shielded by the outer filled shells of 5p and 5s electrons preventing the 4f electron from directly participating in bonding [22]. Similar discussion cab be said about Ce(IV). The rare earth metal ions maintain much of the character exhibited by a free ion. The nonbondingproperty of the 4f dopant electrons is responsible for the well-known chemical similarity of different rare earth elements. The data listed in Table 1 also show that TiO2 doped with either Ce(III) or Ce(IV) was less active in photo reduction of [Fe(CN)6]3− than the pure oxides of TiO2, Ce2O3, CeO2, indicating that the change in the band
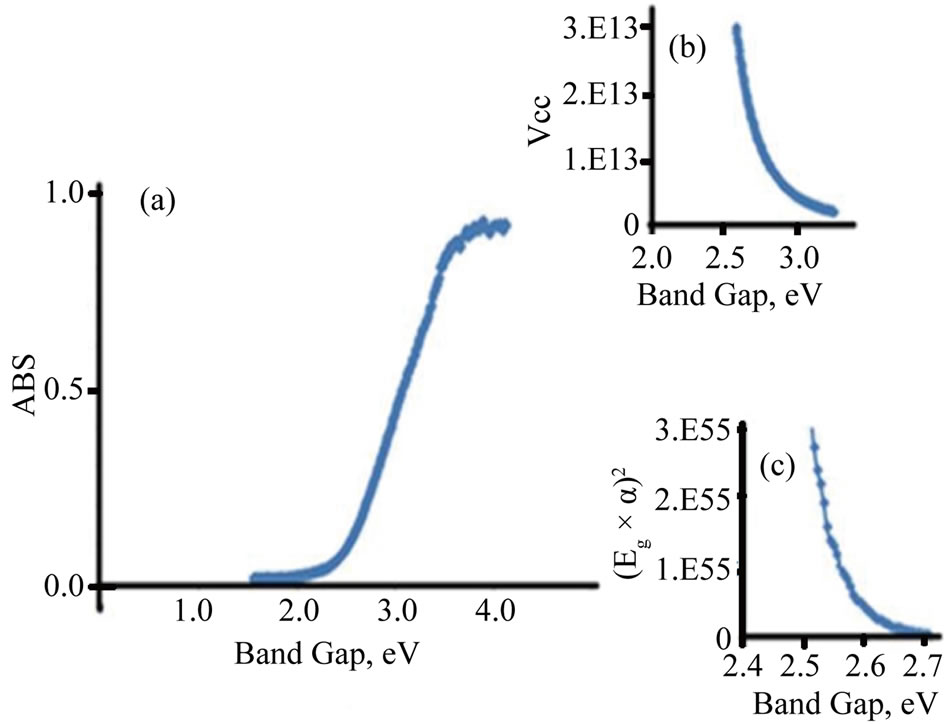
Figure 1. Diffusive reflectance spectrometry for TiO2/CeO2. (a) Absorption; (b) Indirect band gap; (c) Direct band gap.
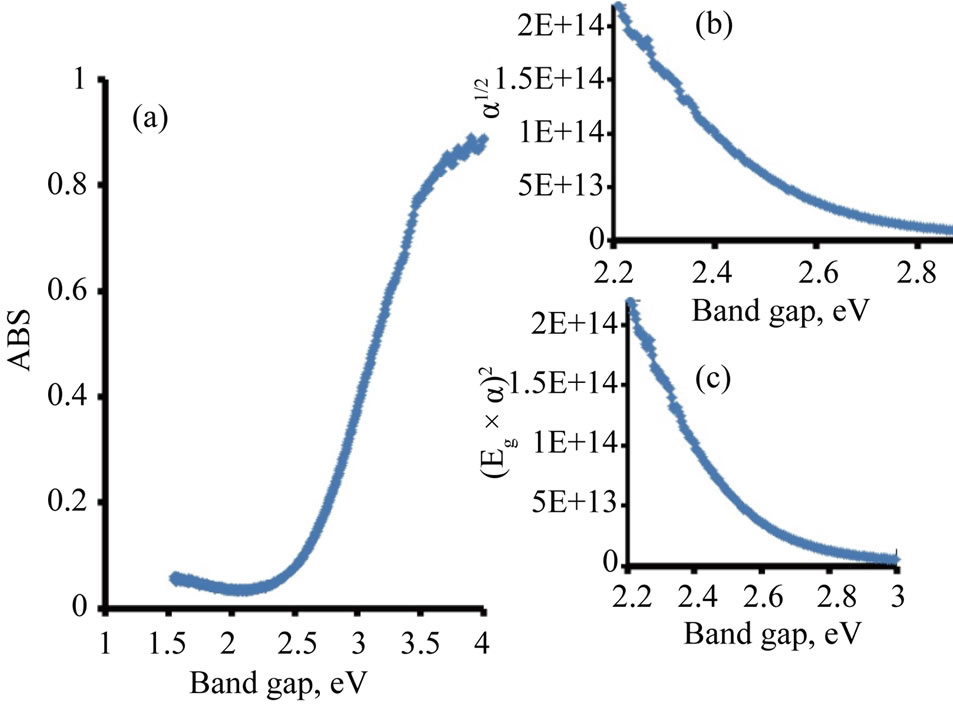
Figure 2. Diffusive reflectance spectrometry for TiO2/Ce2O3. (a) Absorption; (b) Indirect band gap; (c) Direct band gap.
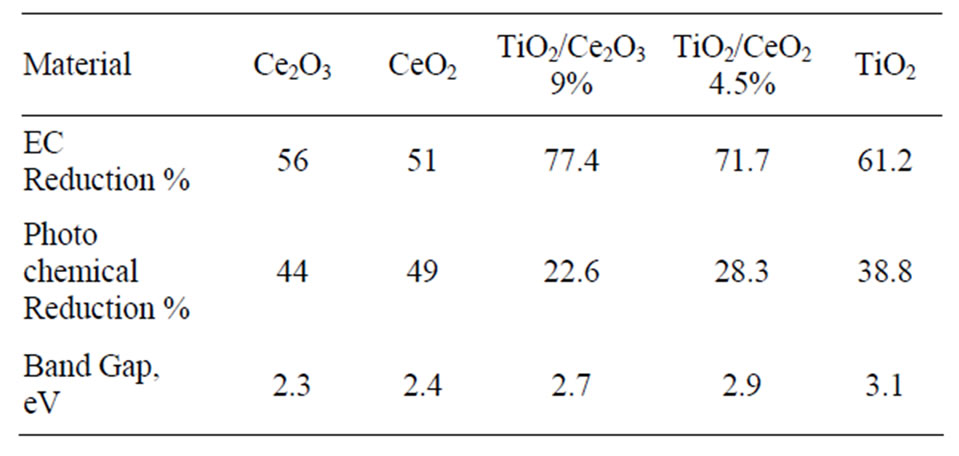
Table 1. Photolysis of Aqueous 10 mM of K4[Fe(CN)6] in 0.2 M  (pH = 6.0).
gap resulted from shifting the conduction band position to a less positive potential vs NHE. It is well known that TiO2 band positions shifts to more negative potential by increasing the pH [23]. At pH 6 our studies show that, the conduction band of pure TiO2 shifts to −0.1 V vs NHE and the measured reduction potential of [Fe(CN)6]4− at this pH is 0.40 vs NHE. The approximate flat band potential measured for doped TiO2 with Ce(III) and with Ce(IV) are 0.0 and −0.1 V vs NHE respectively (vida infra). This makes the approximate position of the conduction band at 0.1 and 0.0 V vs NHE for doped TiO2 with Ce(III) and with Ce(IV) respectively. These data indicate that doping TiO2 with Ce(III) or (IV) reduced its band gap by about 0.4 V. The small change in conduction band potential position in NHE scale suggests that doping caused a shift of valence band to a less positive potential.
3.2. Photolysis of Aqueous Doped Oxide Nano-Particles Colloidal Solutions
Photolysis of [Fe(CN)6]4− will generate hydrated electrons and [Fe(CN)6]3−. The potential of the working electrode was fixed at 100 mV more negative than the reduction potential of [Fe(CN)6]3− to guarantee full reduction of ferricyanide. The current due to the reduction of [Fe(CN)6]3− collected by the working electrode during the photolysis process is a measure of photocurrent. The measured photocurrent was normalized assuming that two photons were absorbed for every one hydrogen molecule, and was used to calculate the number of moles of hydrogen generated per square meter per hour of illumination.
The contribution of the TiO2 doped with cerium ions to the photochemical process in aqueous electrolytes can be tested by measuring the photo-reduction current and compare it with the total photoelectrochemical reduction current recoded during the photolysis process. Figure 3 displays the current-time curves recorded during the photolysis of 10 mM of [Fe(CN)6]4− in 0.2 M phosphate (pH 6) in the absence and presence of TiO2 doped with Ce2O3. Figure 4 displays the current-time curves under
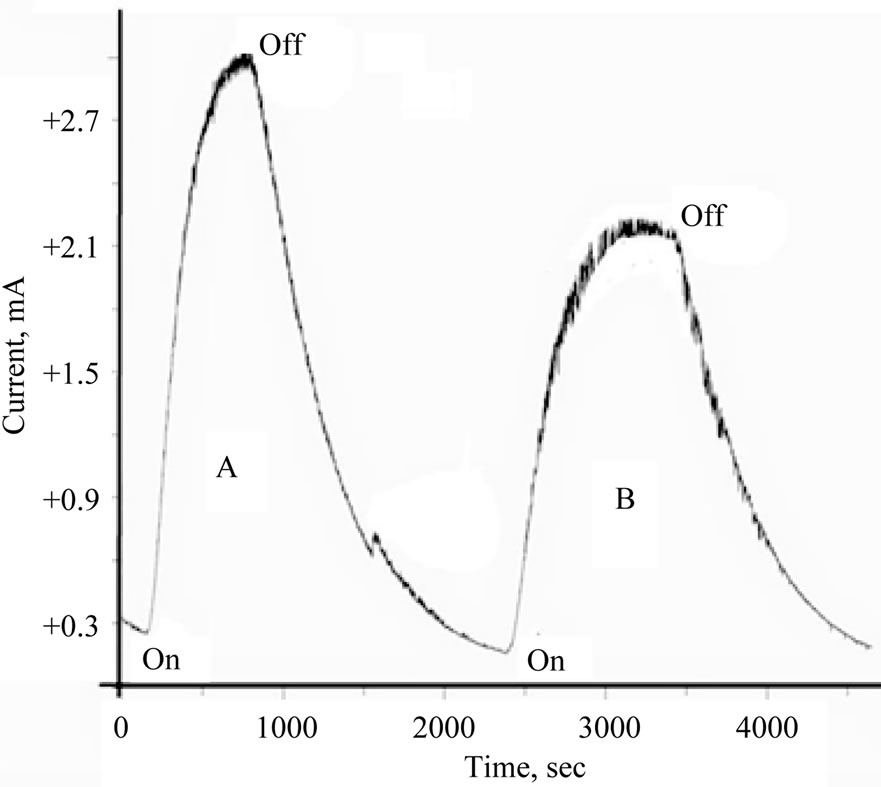
Figure 3. Photolysis of aqueous 10 mM [Fe(CN)6]4−/phosphate buffer (pH = 6) in presence of TiO2/Ce2O3 nanoparticles. (A) Ref no oxide added; (B) in presence of the oxide.
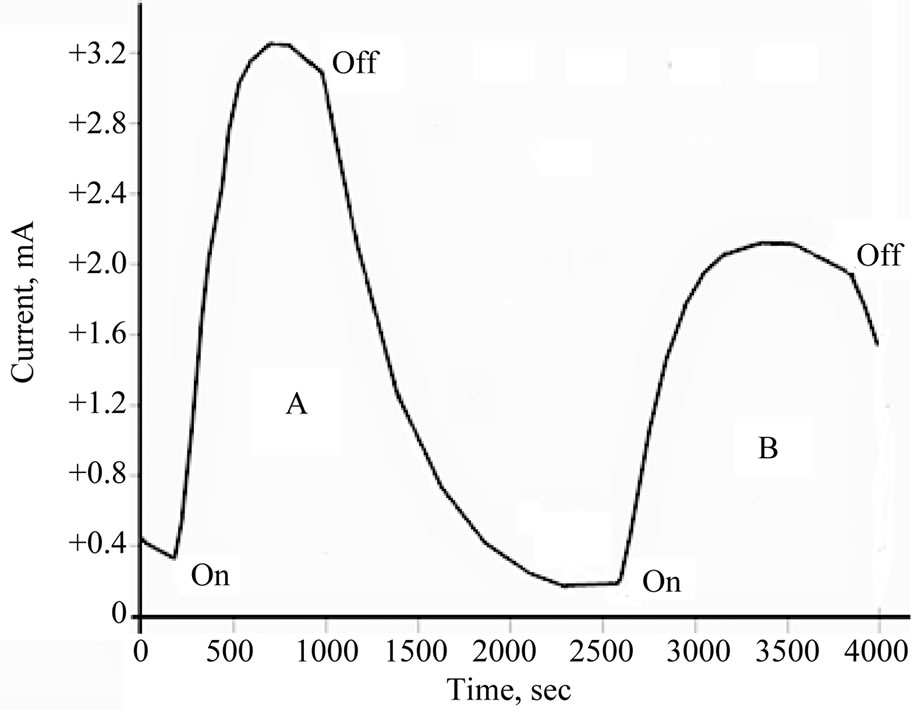
Figure 4. Photolysis of aqueous 10 mM [Fe(CN)6]4−/phosphate buffer (pH = 6) in presence of TiO2/CeO2 nanoparticles.
similar conditions but in the presence of TiO2 doped with CeO2. Less current was generated in the presence of TiO2 doped with either Ce2O3 or with CeO2 than in the presence of pure metal oxides.
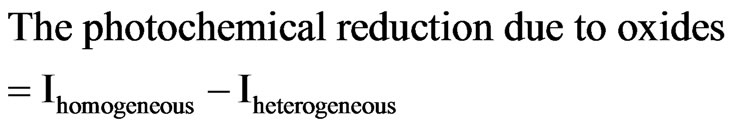
Understanding the results displayed in Figures 3 and 4 can be achieved using the model illustrated in Figure 5. Photolysis of [Fe(CN)6]4− according to Equation (2) in an oxide-free solution, results in formation of [Fe(CN)6]3−. Electrochemical reduction of [Fe(CN)6]3− generates the peak (a), in Figure 5(A). In the presence of metal oxide mixtures, the recorded electrochemical reduction peak (b), is less in height than peak (a). This is attributed to the fact that, in the presence of semiconductor oxides, a portion of [Fe(CN)6]4− will be adsorbed on the surface of the oxide, which makes the recorded electrochemical reduction current of the working electrode less than in the absence of the oxide particles, so Ihomogeneous > Iheterogeneous
where Ihomogeneous = I (recorded in the absence of oxide particles) and Iheterogeneous = I (recorded in the presence of oxide particles)
 (5)
(5)
In a heterogeneous system (Diagram 3) the reduction of [Fe(CN)6]3− to [Fe(CN)6]4− takes place as follow:
 (6)
(6)
The adsorbed [Fe(CN)6]3− on the particle captures electrons from CB (conduction band) according to this reaction:
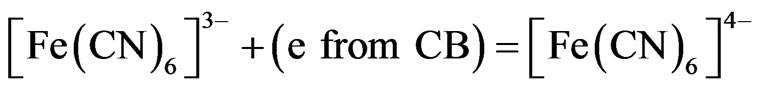 (7)
(7)
Completion of the reaction illustrated by Equation (7) grantees continuation of reaction 2.
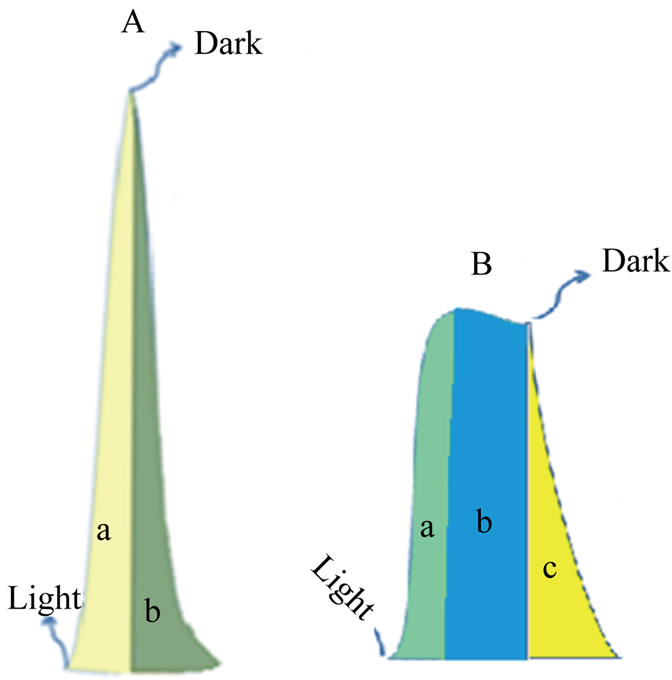
Figure 5. Model for I-t for the photolysis of aqueous solution of [Fe(CN)6]4−. (A) In absence of nanoparticles; (B) In presence of nanoparticles.
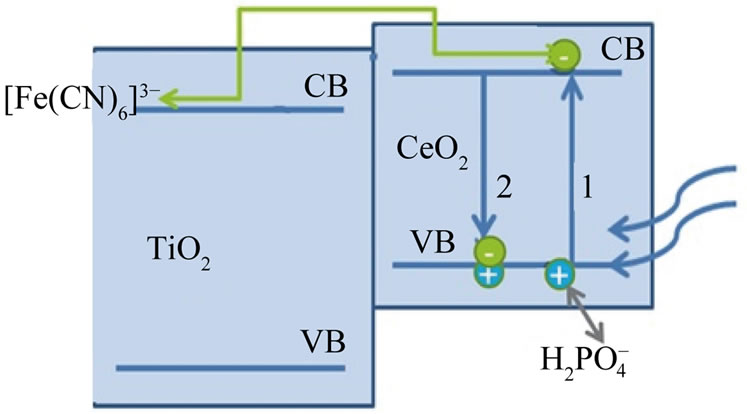
Diagram 3. Energy map for TiO2/CeO2 assembly.
Figure 3 shows that photolysis of homogenous solutions [Fe(CN)6]4− reaches a peak current with a very short plateau , while the photolysis of a heterogeneous suspension of [Fe(CN)6]4 (in presence of metal oxides) reaches a smaller peak height with a longer plateau. The longer plateau of electrochemical reduction current in the heterogeneous suspension than that in homogenous solutions can be attributed to the extra supply of [Fe(CN)6]3− (as photo oxidation products) that is desorbed from the surfaces of the nanoparticles of the oxides and reached the Pt working electrode in later time. Sections (b) in Figure 5(A) and section (c) in Figure 5(B), represents electrochemical reduction current in darkness, hereafter described as “dark current”.
The data listed in Table 1 indicate that TiO2 doped with either Ce2O3 or CeO2 show the least photo activity toward reduction of [Fe(CN)6]3− compared to that of pure oxides. Such behavior was previously reported for TiO2 doped with increasing percentages of CeO2 in presence of methylene blue (MB) where the activity if TiO2 dropped when the percentage of Ce(IV) increased from 0.25% to more than 1% [20]. Assuming that the doped Ce oxides partially (adsorbed) covers the surface if TiO2 when it is present at low concentrations (ca less than 1.0 %), the surface coverage becomes greater at higher percentages. Such adsorption competes with the adsorption of major active anions such as  and [Fe(CN)6]3− and retards the desired reaction represented by Equations (6) and (7). This negative effect on the photo activity can be explained assuming that CeO2 adsorbed on the surface of TiO2 created surface states where the recombination between electron/holes generated first by CeO2 is possible. This will prevent injection of electrons into the CB of TiO2, and prevent the holes of oxidizing
  (Diagram 3).
3.3. Thin Solid Films Behavior
Cyclic voltammograms (CVs) of TiO2/Ce2O3, TiO2 /CeO2 thin solid films loaded over FTO electrodes in the presence of [Fe(CN)6]4−/3− under illumination and under dark conditions are displayed in Figure 6. These CV’s indicate that the studied electrode assemblies are photoactive with the I2/I− redox system. The observed photocurrent within the studied potential ranges indicates that [Fe(CN)6]4−/3− underwent electron accepting/donating processes. Such immobilization caused an adjustment of the flat band potential to accommodate these processes. These CVs also give an approximate value for the flat band potential, as at potential negative to −0.3 V and at −0.2 V (Figure 6(B)) a photocurrent is observed (Figure 6(A)). This is an indication of flat band potentials of TiO2 /Ce2O3 and TiO2/CeO2. Figure 7 displays linear sweep voltammetry (LSV) studies of TiO2/CeO2 thin solid films on FTO, in [Fe(CN)6]4−/3− and in  /I2 . It can be noticed that the recorded photocurrent in presence of
  /I2 (Figure 7(a2)) is greater than that recorded for [Fe(CN)6]4−/3− (Figure 7(b2)) at potentials that are more negative than the flat
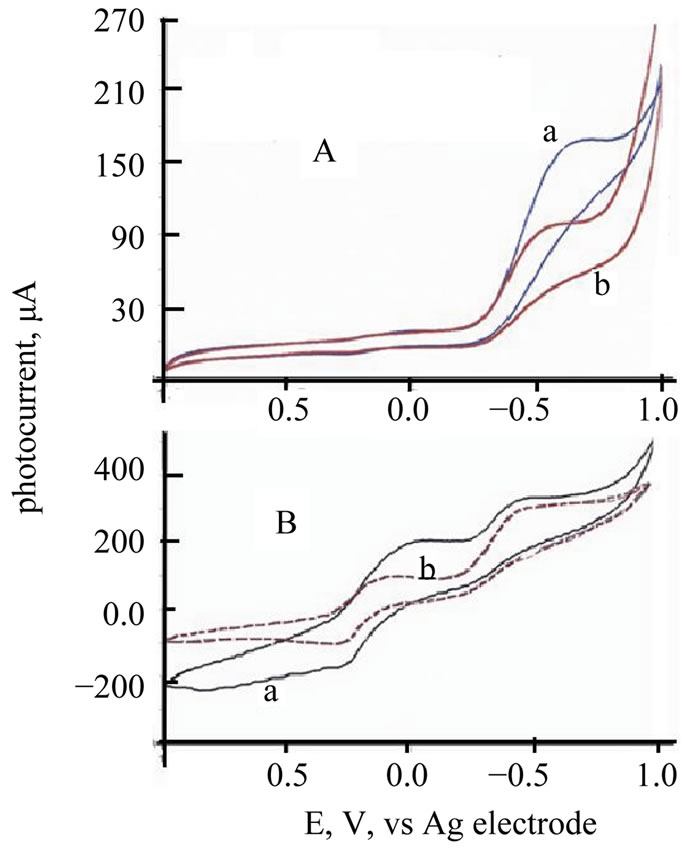
Figure 6. (A) CV of ITO/TeO2/CeO2 thin film in/ [Fe(CN)6]4−/Pt Cell a = CV under illumination; b = CV under dark; (B) CV of ITO/TeO2/CeO2 thin film in [Fe(CN)6]4−/Pt Cell a = Solid line = CV under illumination, b = dashed red line = CV under dark.
band potential.
Photolysis of an aqueous solution of 0.2 M phosphate containing 10 mM  /I2 under a constant potential of −0.800 vs Ag/AgCl electrode using a thin solid films of TiO2/CeO2 on FTO as the photoactive electrode is displayed in Figure 8. The generated photocurrent is less than that recorded in aqueous suspensions (Figures 3 and 4). Such behavior is expected because the surface area of the photoactive material in the thin solid film is much less than that in the suspension system. Furthermore, the phenomena of dark current observed with thin films is much less than that observed with the suspensions, evidenced by the steeper drop in the photocurrent under dark. Figure 8 also shows reproducible photochemical activities through several cycles of darkness and illumination.
4. Conclusion
Doping TiO2 with either Ce2O3 or CeO2 alters the energy band structure of TiO2. Ce(III/IV) addition reduced the band gap of doped TiO2 resulting in shifting both con-
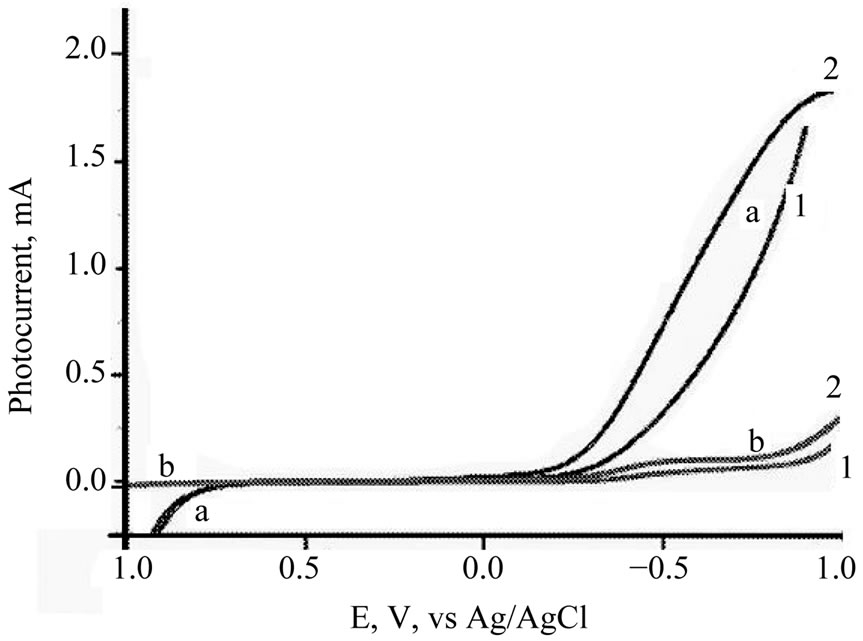
Figure 7. LSV for TiO2/CeO2 thin solid film on FTO in: (a) 10 mM I2/I−; (b) 10 mM [Fe(CN)6]4− 1: under dark; 2: under illumination.
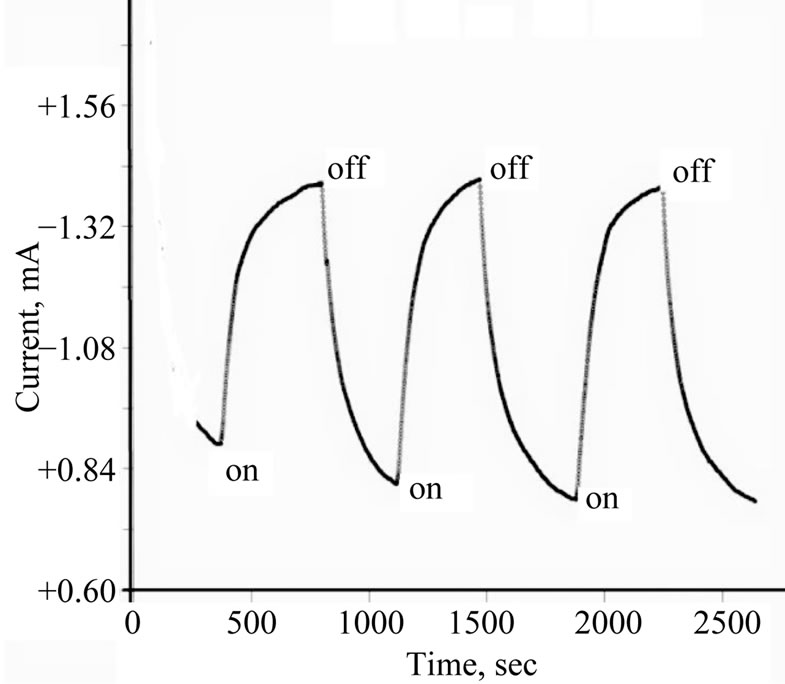
Figure 8. Photocurrent—Time plot at −0.800 V of ITO/ TeO2/CeO2 thin film in 10 mM I2/I− at −0.80 V.
duction and valence band to more negative potential. The doped TiO2 assemblies give less photochemical reduction of [Fe(CN)6]3− than the oxides of pure metals (Ti or Ce). Such observed behavior was explained on the basis that the dopant facilitates the e/h recombination [20]. The possible existence of oxygen vacancies in presence of CeO2 as a dopant enhances the chance of formation of localized states within the band gap range. These localized states lowered the rate of e/h recombination. This also explains why TiO2/Ce2O3 gives less photoactivity than TiO2/CeO2 (Table 1).
REFERENCES
- Y. Wang, Y. Hao, H. Cheng, et al., “Photoelectrochemistry of Transition Metal-Ion-Doped TiO2 Nanocrystalline Electrodes and Higher Solar Cell Conversion Efficiency Based on Zn2+-Doped TiO2 Electrode,” Journal of Materials Research, Vol. 34, No. 12, 1999, pp. 2773-2779.
- P. Yang, C. Lu, N. P. Hua and Y. K. Du, “Titanium Dioxide Nanoparticles Co-Doped with Fe3+ and Eu3+ Ions for Photocatalysis,” Materials Letters, Vol. 57, No. 8, 2002, pp. 794-801. http://dx.doi.org/10.1016/S0167-577X(02)00875-3
- J. Moon, H. Takagi, Y. Fujishiro and M. Awano, “Preparation and Characterization of the Sb-Doped TiO2 Photocatalysts,” Journal of Materials Science, Vol. 36, No. 4, 2001, pp. 949-955. http://dx.doi.org/10.1023/A:1004819706292
- R. Asahi, T. Morikawa, T. Ohwaki, K. Aoki and Y. Taga, “Visible-Light Photocatalysis in Nitrogen-Doped Titanium Oxides,” Science, Vol. 293, No. 5528, 2001, pp. 269-271.
- K. K. Kasem, et al., “Photoelectrochemical and Spectroscopic Studies of Colloidal Nano-Particles of Mixed TiO2 /V2O5 Metal-Oxide Semiconductors,” Material Science and Application, Vol. 3, No. 5, 2012, pp. 265-271.
- K. K. Kasem, “Hydrogen Production by Selective PhotoDissociation of Water in Aqueous Colloidal Nano-Particles of Doped Iron (III) Oxides Semiconductors,” Journal of Materials Science & Technology, Vol. 26, No. 7, 2010, pp. 619-624. http://dx.doi.org/10.1016/S1005-0302(10)60095-3
- I. Atribak, I. Such-Basáñez, A. Bueno-López and A. G. García, “Catalytic Activity of La-Modified TiO2 for Soot Oxidation by O2,” Catalysis Communications, Vol. 8, No. 3, 2007, pp. 478-482. http://dx.doi.org/10.1016/j.catcom.2006.07.022
- S. Anandan, A. Vinu, K. L. P. S. Lovely, et al., “Photocatalytic Activity of La-Doped ZnO for the Degradation of Monocrotophos in Aqueous Suspension,” Journal of Molecular Catalysis A: Chemical, Vol. 266, No. 1-2, 2007, pp. 149-157. http://dx.doi.org/10.1016/j.molcata.2006.11.008
- S. Anandan, Y. Ikuma and V. Murugesan, “Highly Active Rare-Earth-Metal La-Doped Photocatalysts: Fabrication, Characterization, and Their Photocatalytic Activity,” International Journal of Photoenergy, Vol. 2012, 2012, Article ID: 921412. http://dx.doi.org/10.1155/2012/921412
- D. Martel, H. N. Cong and J. Weiss, “Process for the Production of Hydrogen from an Aqueous Medium,” FR 2940263 A1 20100625, Fr. Demande, 2010.
- V. M. Aroutiounian, V. M. Arakelyan and G. E. Shahnazaryan, “Metal Oxide Photoelectrodes for Hydrogen Generation Using Solar Radiation-Driven Water Splitting,” Solar Energy, Vol. 78, No. 5, 2005, pp. 581-592. http://dx.doi.org/10.1016/j.solener.2004.02.002
- M. Kaneko, H. Ueno, R. Saito, S. Yamaguchi, Y. Fujii and J. Nemoto, “UV Light-Activated Decomposition/ Cleaning of Concentrated Biomass Wastes Involving Also Solid Suspensions with Remarkably High Quantum Efficiency,” Applied Catalysis, B: Environmental, Vol. 91, No. 1-2, 2009, pp. 254-261. http://dx.doi.org/10.1016/j.apcatb.2009.05.033
- K. Kasem and M. Dahn, “Photodissociation of Water Using Colloidal Nanoparticles of Doped Titanium (IV) Oxide Semiconductors for Hydrogen Production,” Current Science, Vol. 99, No. 8, 2010, pp. 1068-1073.
- C. E. Jones and L. J. Carpenter, “Solar Photolysis of CH2I2, CH2ICl, and CH2IBr in Water, Saltwater, and Seawater,” Environmental Science and Technology, Vol. 39, No. 16, 2005, pp. 6130-6137. http://dx.doi.org/10.1021/es050563g
- V. M. Daskalaki, P. Panagiotopoulou and D. I. Kondarides, “Production of Peroxide Species in Pt/TiO2 Suspensions under Conditions of Photocatalytic Water Splitting and Glycerol Photoreforming,” Chemical Engineering Journal, Vol. 170, No. 2-3, 2011, pp. 433-439. http://dx.doi.org/10.1016/j.cej.2010.11.093
- K. Kasem, M. Dahn and N. Zia, “Photolysis of Aqueous Colloidal Zinc Oxide Nanoparticles for Hydrogen Production,” CACS Communications, Vol. 4, No. 1, 2010, pp. 13-17.
- A. Patsoura, D. I. Kondarides and X. E. Verykios, “Enhancement of Photoinduced Hydrogen Production from Irradiated Pt/TiO2 Suspensions with Simultaneous Degradation of Azo-Dyes,” Applied Catalysis, B: Environmental, Vol. 64, No. 3-4, 2006, pp. 171-179. http://dx.doi.org/10.1016/j.apcatb.2005.11.015
- S. Gordon, E. J. Hars, M. S. Matheson, J. Rahani and J. K. Thomas, “Reaction Constant of Hydrated Electrons,” Journal of the American Chemical Society, Vol. 85, No. 10, 1963, pp. 1375-1381. http://dx.doi.org/10.1021/ja00893a002
- J. Grym, O. Prochazkova, J. Zavadil and K. Zdansky, “Role of Rare-Earth Elements in the Technology of III-V Semiconductors Prepared by Liquid Phase Epitaxy, Semiconductor Technologies, Jan,” In: Grym, Ed., III-V-Semiconductors-Prepared-by-Liquid-Phase-Epitaxy, InTech, 2010, pp. 295-320. http://www.intechopen.com/books/semiconductor-technologies/role-of-rare-earth-elements-in-the-technology
- G. Magesh, B. Viswanathan, R. P. Viswanath and T. K. Varadaragan, “Photocatalytic Behavior of CeO2-TiO2 System for Degradation of Methylene Blue,” Indian Journal of Chemistry A, Vol. 48, No. 4, 2009, pp. 480-488.
- R. A. Van Leeuwen, C.-J. Hung, D. R. Kammler and J. A. Switzer, “Optical and Electronic Transport Properties of Electrodeposited Thallium (III) Oxide Films,” Journal of Physical Chemistry, Vol. 99, No. 41, 1995, pp 15247- 15252. http://dx.doi.org/10.1021/j100041a047
- C. W. Thiel, Y. Sun and R. I. Cone, “Progress in Relating Rare-Earth Ion 4f and 5d Energy Levels to Host Bands in Optical Materials for Hole Burning, Quantum Information and Phosphors,” Journal of Modern Optics, Vol. 49, No. 14-15, 2002, pp. 2399-2411. http://dx.doi.org/10.1080/0950034021000011491
- T. Bak, M. Rekas and C. C. Sorrell “Photo-Electrochemical Hydrogen Generation from Water Using Solar Energy. Materials-Related Aspects,” International Journal of Hydrogen Energy, Vol. 27, No. 10, 2002, pp. 991- 1022. http://dx.doi.org/10.1016/S0360-3199(02)00022-8
NOTES
*Corresponding author.