Materials Sciences and Applications
Vol.3 No.4(2012), Article ID:18473,8 pages DOI:10.4236/msa.2012.34036
Composition Dependence of Structure and Magnetic Properties in Manganese Doped Nanocrystalline ZnO Particles Prepared by Co-Precipitation
![]()
Departemen Fisika, FMIPA-Universitas Indonesia, Depok, Indonesia.
Email: *rosari.saleh@ui.ac.id
Received January 6th, 2012; revised February 9th, 2012; accepted March 16th, 2012
Keywords: Mn Doped ZnO Nanoparticles; Structural and Magnetic Properties
ABSTRACT
Mn-doped nanocrystalline ZnO particles have been successfully synthesized at low temperature (80˚C) by the coprecipitation method using zinc sulfatehepta hydrate and NaOH. The structural and magnetic properties have been characterized using X-ray diffraction (XRD), Energy dispersive x-ray, vibrating sample magnetometer and electron spin resonance. XRD measurements revealed that the sample posses hexagonal wurzite structure. From the Rietveld refined XRD spectra, the lattice parameters, average crystallite size and microstrain values was obtained. In this range of doping concentrations all samples show an expansion of the lattice parameters relative to the bulk samples. From magnetic measurements we observed the presence of room temperature ferromagnetic order in our Mn-doped ZnO samples.
1. Introduction
Dilute magnetic semiconductors (DMSs) have been attracting much interest since they show their possibility of manipulating charge and spin degrees of freedom in a single material. Theoretical predictions of room temperature ferromagnetism in ZnO based DMS have caused intensive efforts on ZnO material doped with transition metal. The Mn-doped ZnO system is very promising due to its wide bandgap of ZnO host material and due to its high solubility of Mn atoms in ZnO matrix. Mn-doped ZnO has also attracted much attention because of disagreements about the existence and the origin of roomtemperature ferromagnetism. Sharma et al. [1] observed ferromagnetism behavior above room temperature for small atomic percentages of Mn doped in ZnO bulk and thin films. They proposed that room-temperature ferromagnetism behavior due to carrier-induced interactions between isolated Mn ions in ZnO. Contrary to this result, several authors have been argued that room-temperature ferromagnetism in Mn-doped samples originated from an oxygen-vacancy-stabilized metastable phase [2,3]. Some authors [4-6] believed that the secondary phases of Mn transition metals clusters and their oxides might be responsible for the observed ferromagnetism behavior. However, some recent studies showed the absence of ferromagnetic ordering in bulk single phase of Mn-doped ZnO down to 2 K [7,8]. Such incosistent results have also been observed for Mn-doped ZnO thin films, which extend from paramagnetic properties [9] to spin-glass behavior [10]. Most likely the differences in the reported results are due to different preparation methods and by different researchers suggesting that magnetic properties of this system are very sensitive to the preparation conditions.
In this work, we reported synthesis of Mn-doped ZnO in the form of nanocrystalline particles using a simple coprecipitation method. The structural and magnetic properties of the nanocrystalline particles were investigated using X-ray diffraction (XRD), energy dispersive x-ray spectroscopy (EDX), infrared absorption (FTIR), electron spin resonance (ESR) and vibrating sample magnetometer (VSM).
2. Experimental
For the synthesis of Mn-doped ZnO nanoparticles in this study, manganese sulfate monohydrate (MnSO4∙H2O), Zinc sulfate hepta hydrate (ZnSO4∙7H2O), 25% aqueous Sodium hydroxide (NaOH) were used which are procured from Aldrich and Merck. All of the chemicals used are GR grade without further purification. ZnO nanoparticles were synthesized by using a co-precipitation method. The requisite amounts of ZnSO4∙7H2O and MnSO4∙H2O were dissolved in distilled water depending on the percentage of Mn doping to form solution. For the sake of convenience, these solution are designated as solution A. Solution A was then put into an ordinary ultrasonic cleaner using a 57 kHz operating frequency for 2 h. Simultaneously, 44 mmol NaOH was prepared in 440 ml of de-ionized water (solution B). Then, solution A was subsequently stirred with a magnetic stirrer at room temperature. In this solution, the solution B was added until the final pH of solution reached to 12 and then solution was further stirred for 0.5 h with constant stirring. So obtained solution was aged at room temperature for 18 h. This solution was centrifuged and washed several times with ethanol and distilled water in order to remove residual and unwanted impurities. The obtained product was dried in a vacuum oven at 200˚C for 1 h yielding dark brown Mn doped ZnO powder.
The x-ray diffraction (XRD) patterns of the Mn-doped ZnO powder samples were measured at room temperature with a standard x-ray diffractometer Philips PW 1710 and monochromatic Cu-Kα (λ = 1.54060 Å) radiation operated at 40 kV and 20 mA in the range from 10˚ to 80˚. The calibration of the diffractometer was done using Si powder. Elemental analyses of the samples have been done by energy dispersive x-ray spectroscopy (EDX) using scanning microscope. Fourier-transform infrared spectra of the powder samples were recorded using a Shimadzu Fourier-transform spectrometer in the range of 400 - 4000 cm–1. Magnetic properties were experimentally studied by measuring magnetization as a function of external magnetic field at room temperature using Oxford Type 1.2 T vibrating sample magnetometer (VSM). These measurements were taken from 0 to ±1 Tesla field. To obtain information on oxidation state and site occupancy of the Mn ions in the ZnO matrix electron spin resonance (ESR) was carried out using X-band JEOL JES-RE1X at room temperature. X-band spectrometer equipped with 9.1 GHz field modulation unit.
3. Results and Discussion
Figure 1 shows the representative EDX spectra for undoped and Mn-doped nanocrystalline ZnO particles. The elemental analysis indicated that the samples contain target elements with carbon as impurities within the EDX analysis limit. Quantitative results of the Mn/Zn ratio are calculated from the area of the corresponding spectral K lines. The amount of Mn in the nanocrystalline ZnO particles has been found to vary between 6 - 30 at%.
Figure 2 illustrates the Mn incorporation in nanocrystalline ZnO particles as a function of the initial cations ratio in the starting dissolution. It is seen that the amount of Mn incorporated in the samples is slightly lower than
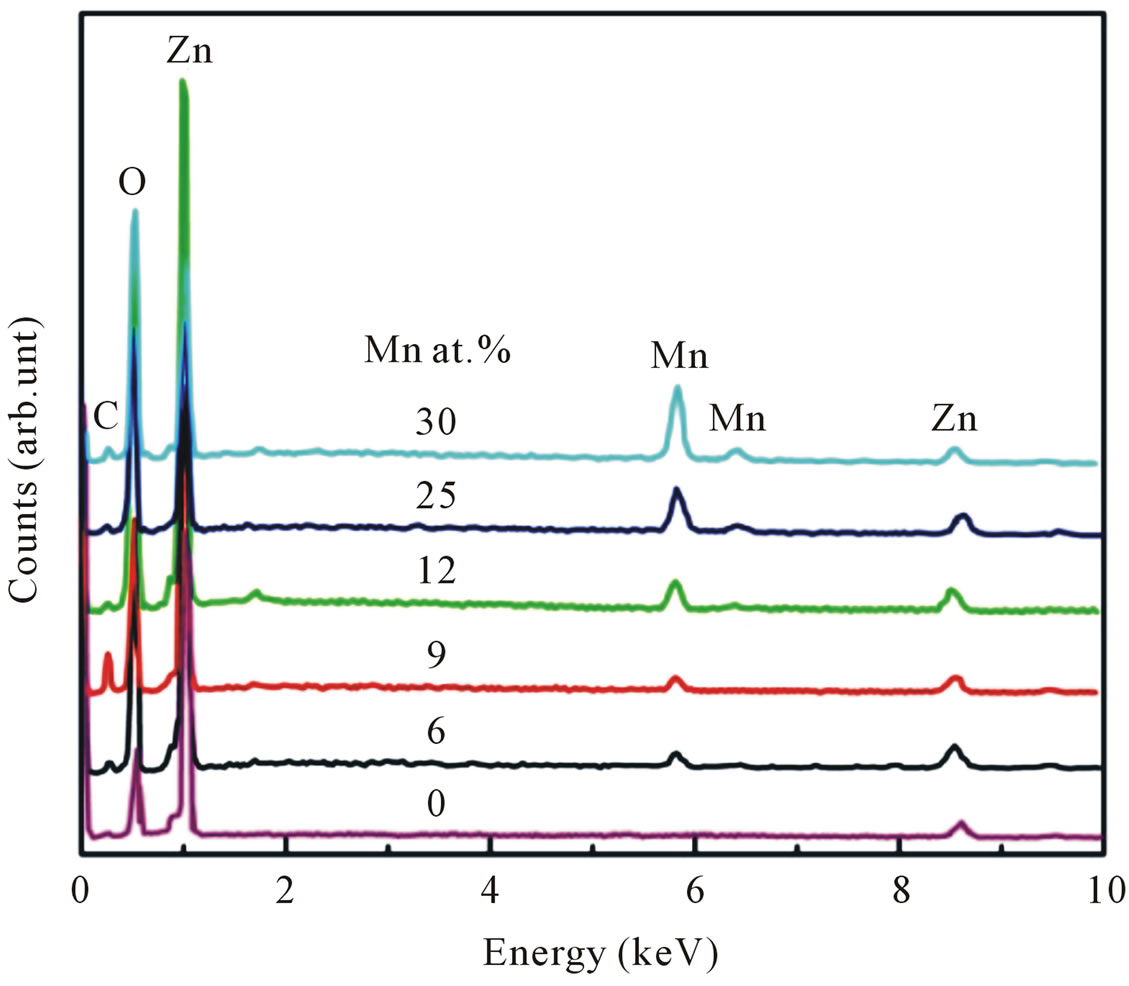
Figure 1. EDX spectra of undoped and Mn-doped nanocrystalline ZnO particles for various doping concentrations.
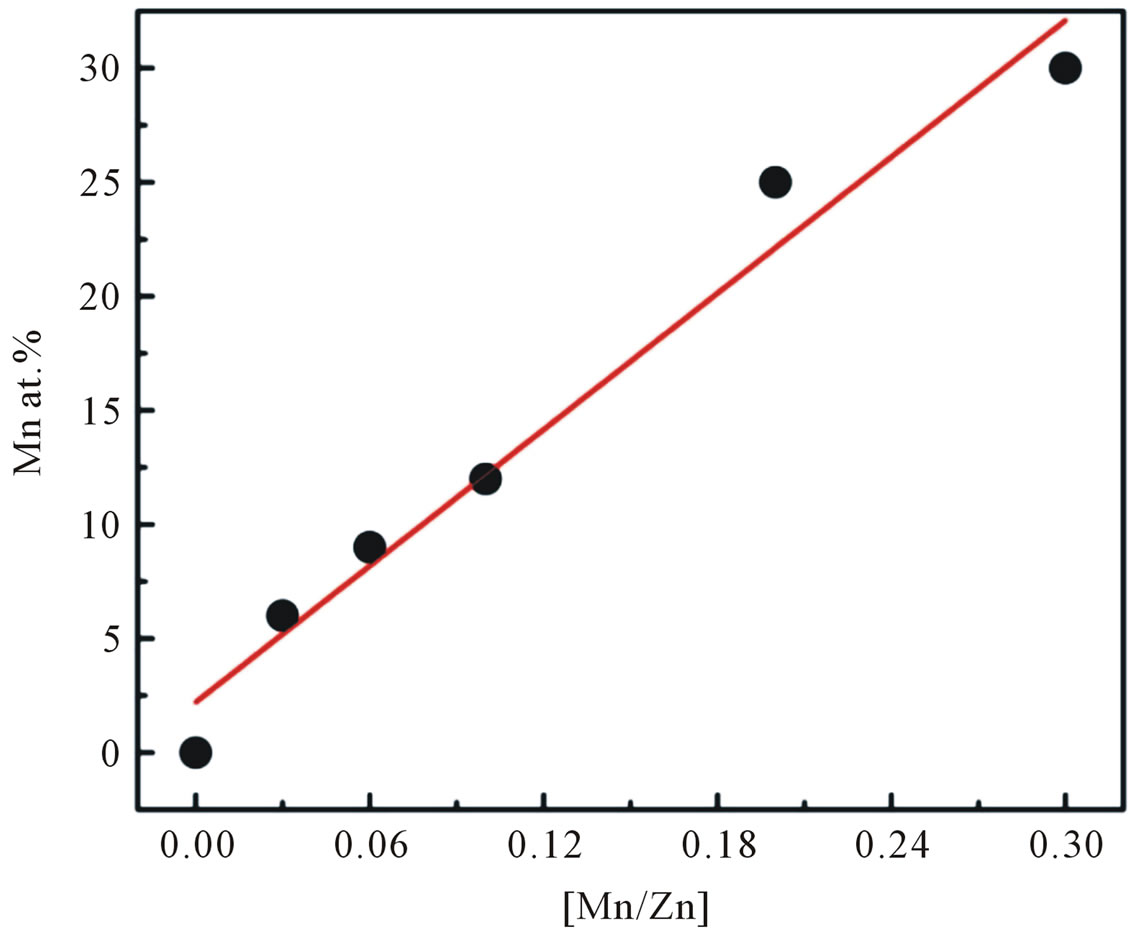
Figure 2. The Mn incorporation in the nanoparticles as a function of the initial cation ratio in the starting solution.
that of the nominal amount of Mn added during the synthesis.
Figure 3 shows the XRD pattern of undoped and Mndoped ZnO. The pattern suggests that the undoped and Mn doped ZnO up to doping concentrations of 25 at% of Mn are constituted in a hexagonal wurzite structure with a prefered orientation of (101) diffraction plane. No additional peak correspond to the secondary-phase formation has been observed up to 25 at% of Mn, which means the crystal structure of Mn-doped ZnO does not depart from its wurzite structure. However, in the sample with further addition 30 at% of Mn, additional peak corresponding to the secondary phase begin to appear at 2θ approximately 62˚. This peak was identified as ZnMn2O4.
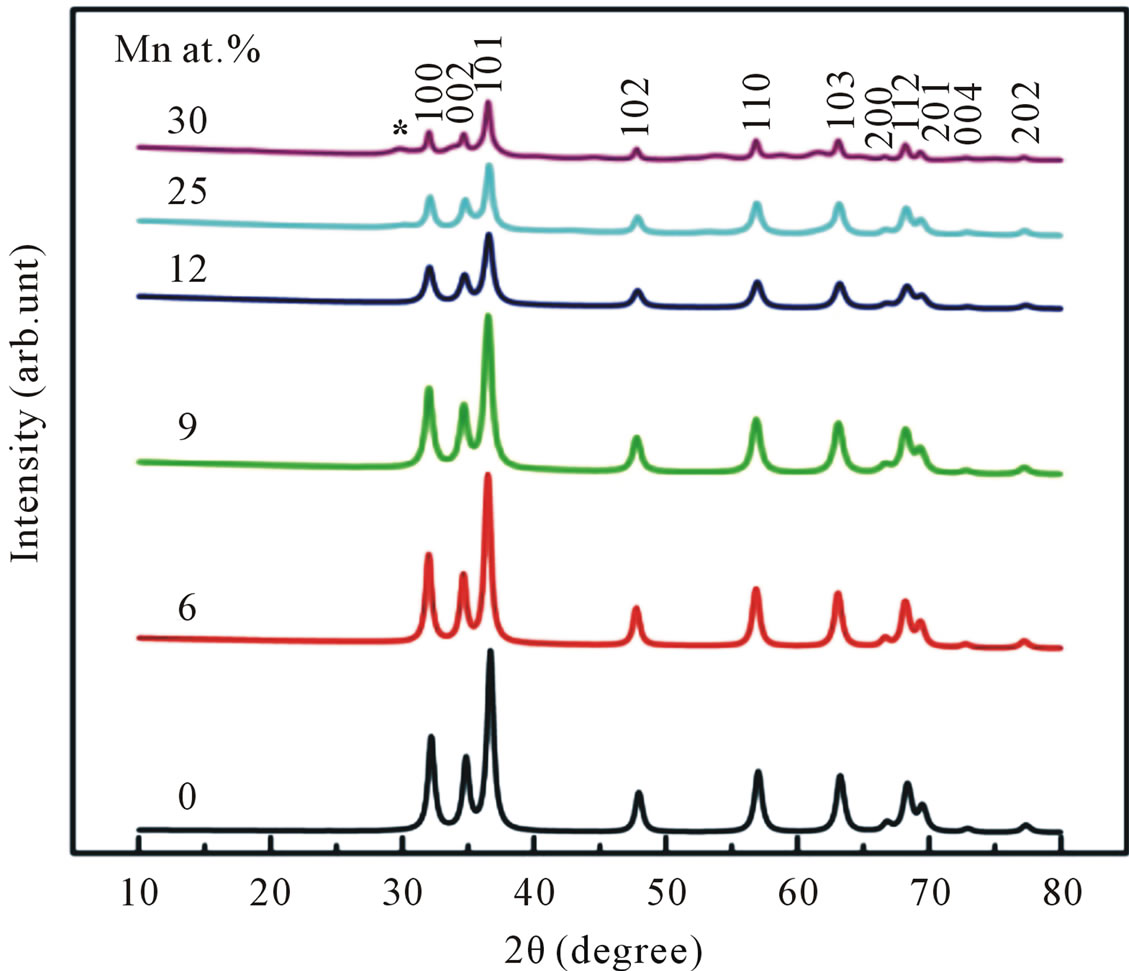
Figure 3. XRD patterns of undoped and Mn-doped nanocrystalline ZnO particles synthesized with different concentrations of Mn.
This result indicated that the doping limit for our Mn doped ZnO samples is below 30 at% of Mn. From Figure 3 one can observe that the Bragg angle of the intense (101) diffraction plane slightly shifted towards higher values relative to that of pure ZnO. This is evidence for creation of internal compressive micro stress. In addition a line broadening was also observed in our XRD spectra. It is commonly accepted that XRD line broadening may be the result of pure size or micro strain, or both size and microstrain. Williamson and Hall [11] have proposed a method combining the effect of size and microstrain on line broadening, when both are operative. The combined effect gives the final-result of FWHM of the diffraction peak, ∆, which is the sum of FWHM grain size and FWHM lattice distortion. This relation may be expressed in the form:
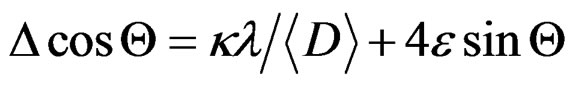 (1)
(1)
where e is the strain associated with the Mn-doped nanocrystalline ZnO particles. This equation represents a straight line between 4 sin Θ as an x-axis and ∆cos Θ as an y-axis. The slope of the line gives the strain e and intercept of this line gives crystallite size
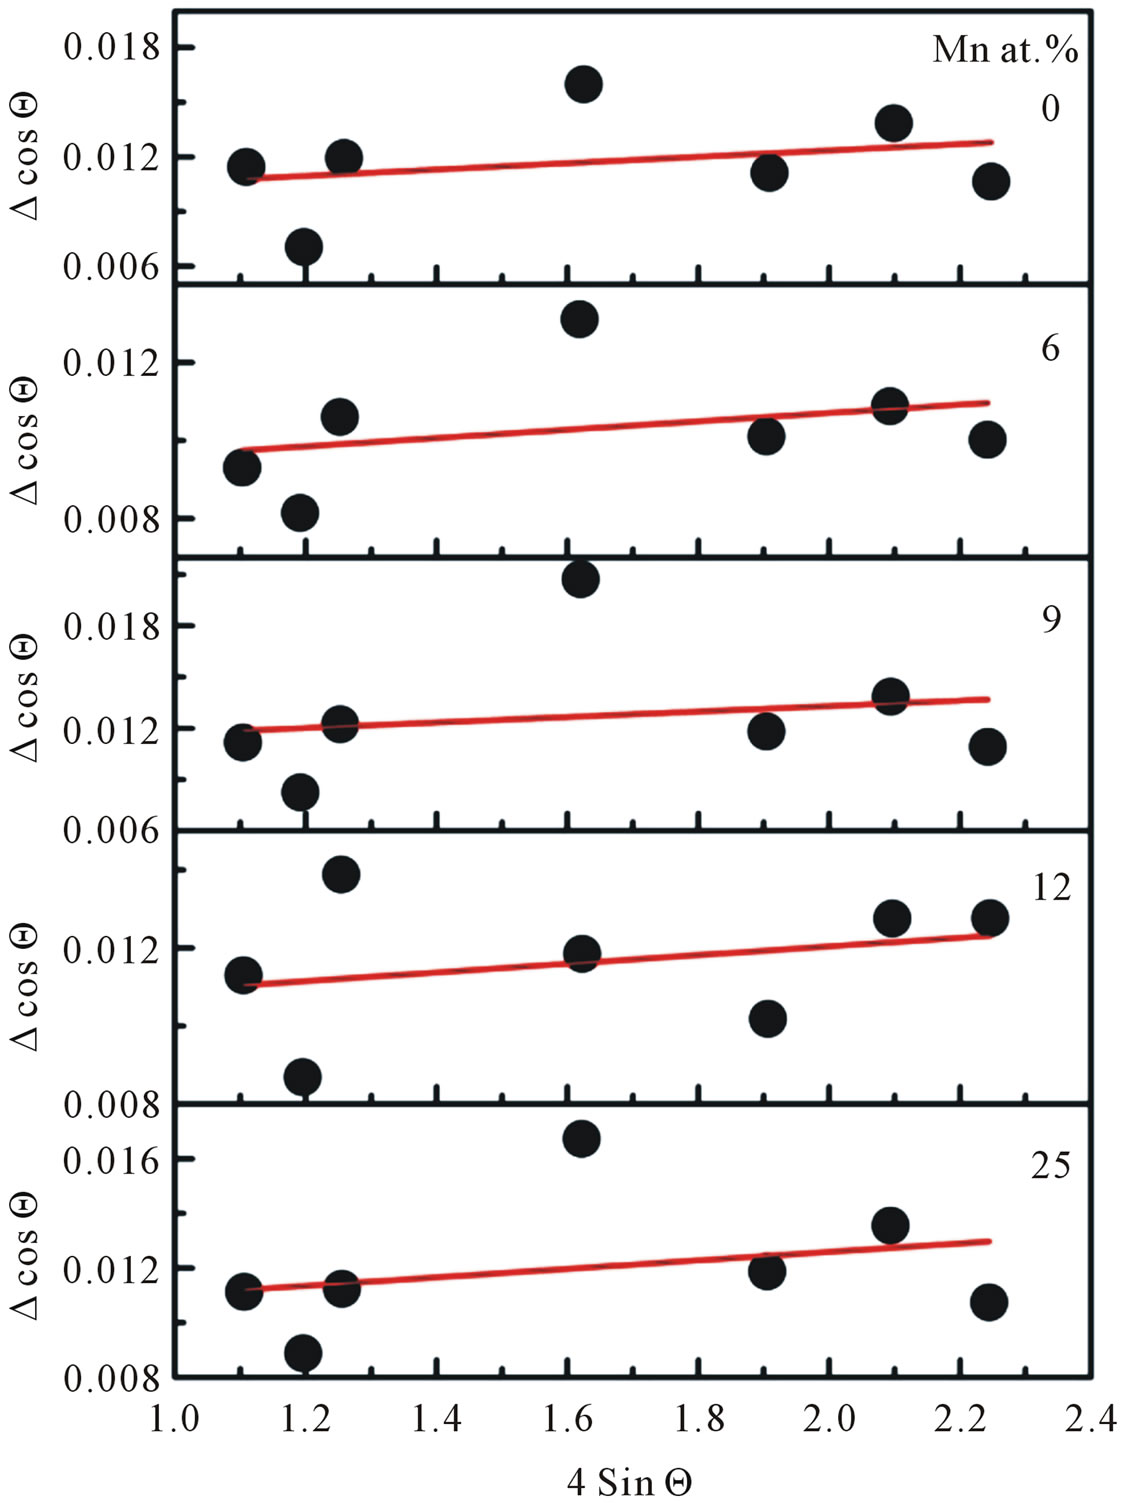
Figure 4. William-Hall plot for each doping concentration of Mn-doped nanocrystalline ZnO particles.
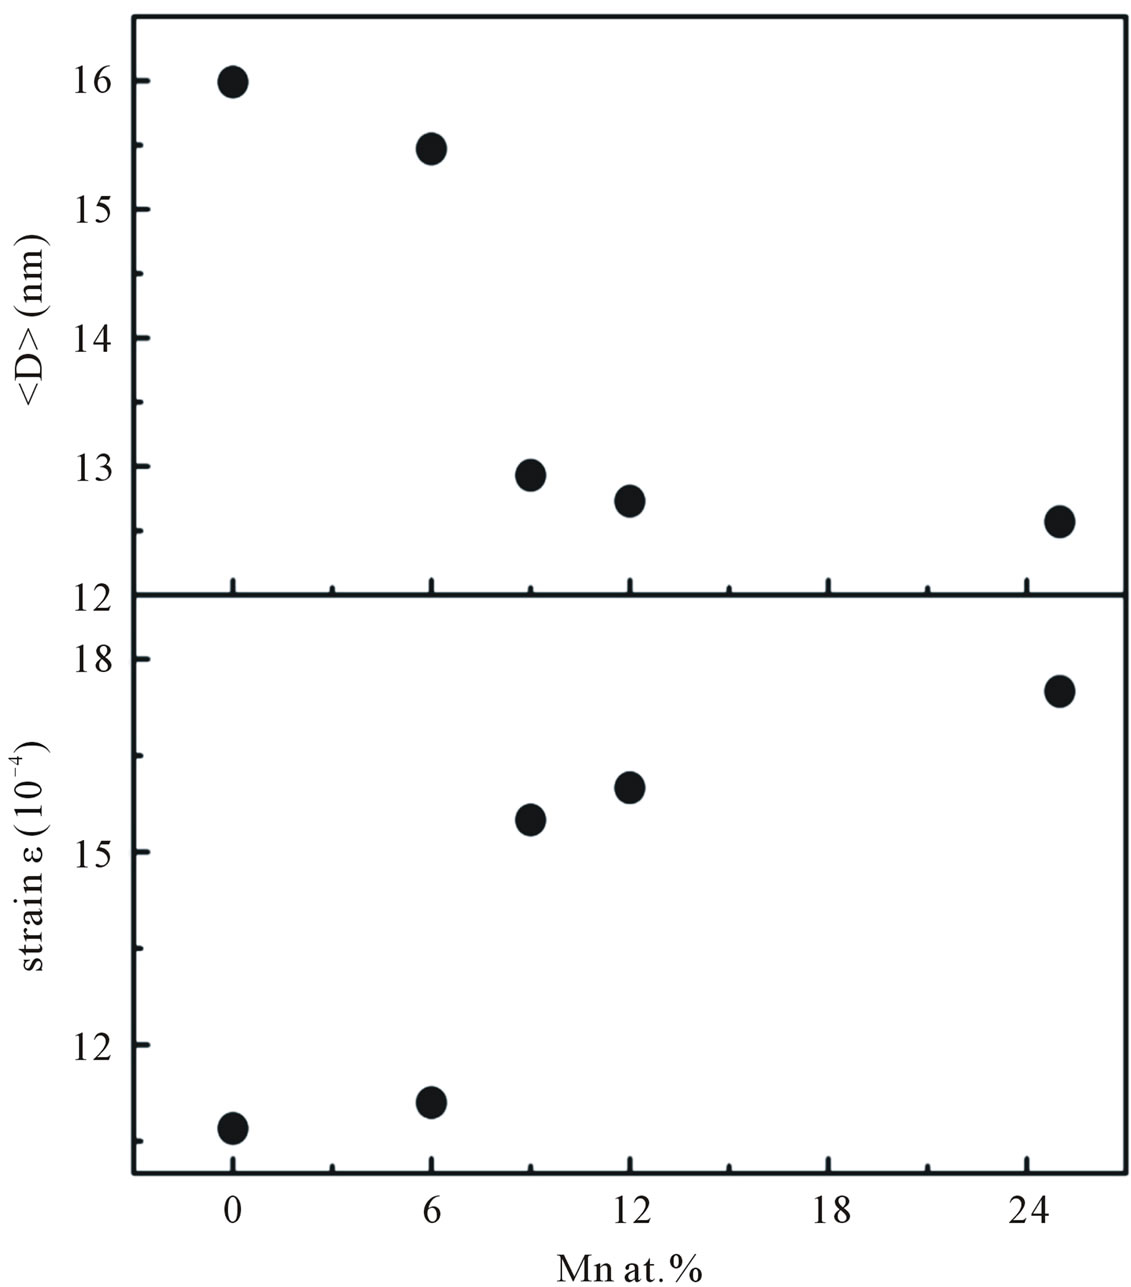
Figure 5. The average crystallite size and micro strain of Mn-doped nanocrystalline ZnO particles obtained from William-Hall’s formula.
The XRD spectra were further analysed by Rietveld technique. Evaluation of the lattice parameters a, c and the unit cell volume V as a function of Mn concentrations is shown in Figure 6. The calculated lattice parameter are higher than the standard JCPDS parameter for bulk ZnO, a = b = 3.2498 Å and c = 5.2060 Å, respectively. Since the ionic radii of Zn2+ (0.74 Å) is smaller than that of Mn2+ (0.83 Å) and larger than that of Mn3+ (0.64 Å) [12].
All of the lattice parameters are increased with increasing Mn concentrations indicating a homogeneous statistical substitution of Mn2+ for Zn2+ in our Mn-doped ZnO samples.
Optical characterization was performed by measuring the diffuse reflectance at room temperature. Figure 7 shows the diffuse reflectance spectra R as a function of wavelength for samples shown in Figure 3. Since our samples are powder, the low reflectance values in our spectra indicate high absorption in the corresponding wavelength region. The data collected at room temperature showed a clear difference between the samples in the region of 200 - 800 nm. The significance of this is more visible after applying the Kubelka-Munk function F(R) given by the relation F(R) = (1 – R)2/2R, where R is the magnitude of reflectance. The optical gap was estimated from diffuse reflectance spectra by plotting the square of the Kubelka-Munk function F(R)2 as a function of energy. To obtained the optical gap the linear part of F(R)2 curve was extrapolated until it intersects the energy axis at F(R)2 = 0. The optical gaps of our Mn-doped ZnO samples were also shown in Table 1" target="_self"> Table 1. The corresponding optical gaps are seen to be shifted to lower energies with increasing doping concentrations. A similar decrease in band gap energy with doping concentration of transition metals has been reported by several authors [13-15]. They have argued that the band gap narrowing with transition metal (TM) doping in ZnO may be due to the sp-d exchange interaction between the band electrons and the localized d-electrons of the transition-metal ions, as a result of the incorporation of transition-metal ions into the Zn site of the ZnO lattice.
The magnetization versus magnetic field (M-H) curves recorded at room temperature for all Mn-doped ZnO samples are shown in Figure 8. A hysteresis behavior is observed at room temperature, implying the well defined ferromagnetism. However, the shape of the loop for samples doped with higher Mn concentrations do not rule out the presence of some paramagnetic contribution. From Figure 8 it is clear that the increase in Mn concentration decreases the ferromagnetic nature and increases the paramagnetic component of samples. This result is in agreement with the one reported by Sharma et al. [16] and Abdel Hakeem [17]. The coercive field (HC) and the
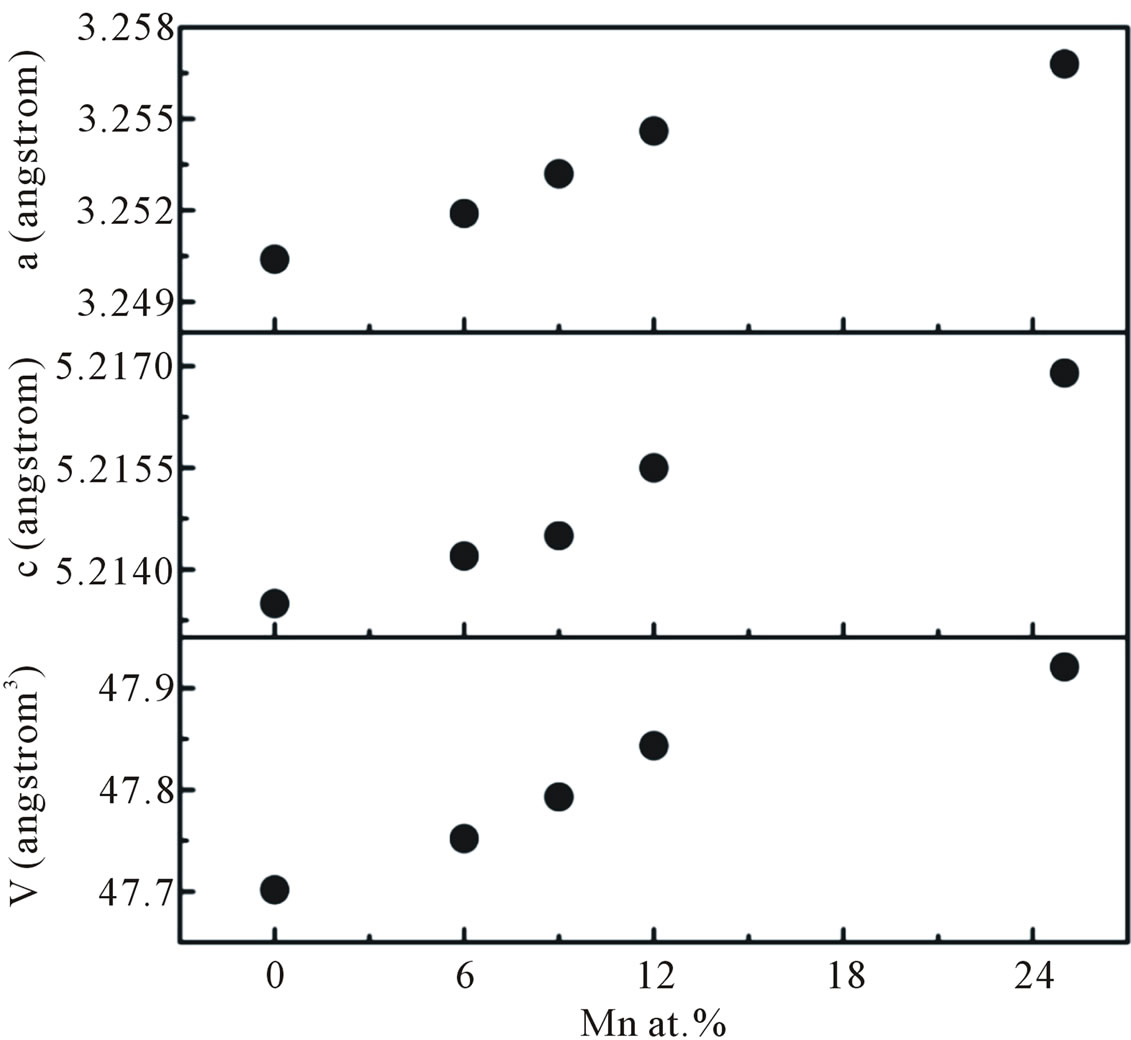
Figure 6. The lattice parameters a, c, and cell volume V of the hexagonal wurtzite undoped and Mn-doped nanocrystalline ZnO particles as a function of doping concentration.
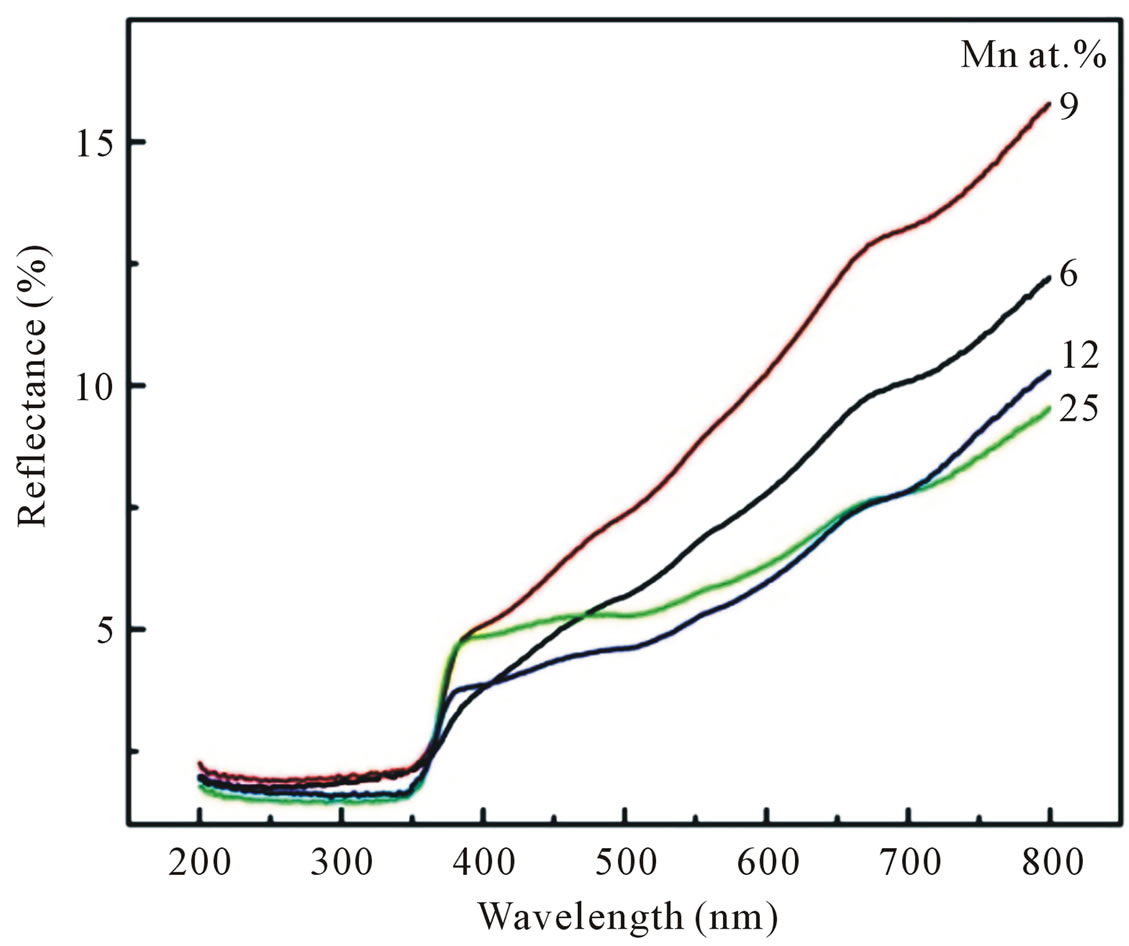
Figure 7. Diffuse reflectance spectra of Mn-doped nanocrystalline ZnO particles synthesized with various doping concentrations.
remnant magnetization (MR) estimated come out to be 1262, 451, 403, 164 Oe and 0.0503, 0.0090, 0.0065, 0.0042 emu/gram for samples doped with 6 and 9, 12, 25 at%, respectively. Since the possible Mn-related seconddary phases have not been observed in our XRD measurements, we could exclude the posibility of room temperature ferromagnetism in our Mn doped ZnO samples due to the presence of any secondary phase.
Even if some tiny secondary phase such as ZnMn2O4 could not results in ferromagnetism because ZnMn2O4 is ferrimagnetic with TC ≈ 15 K [18], and nearly all possible Mn based oxides are antiferromagnetic except Mn3O4
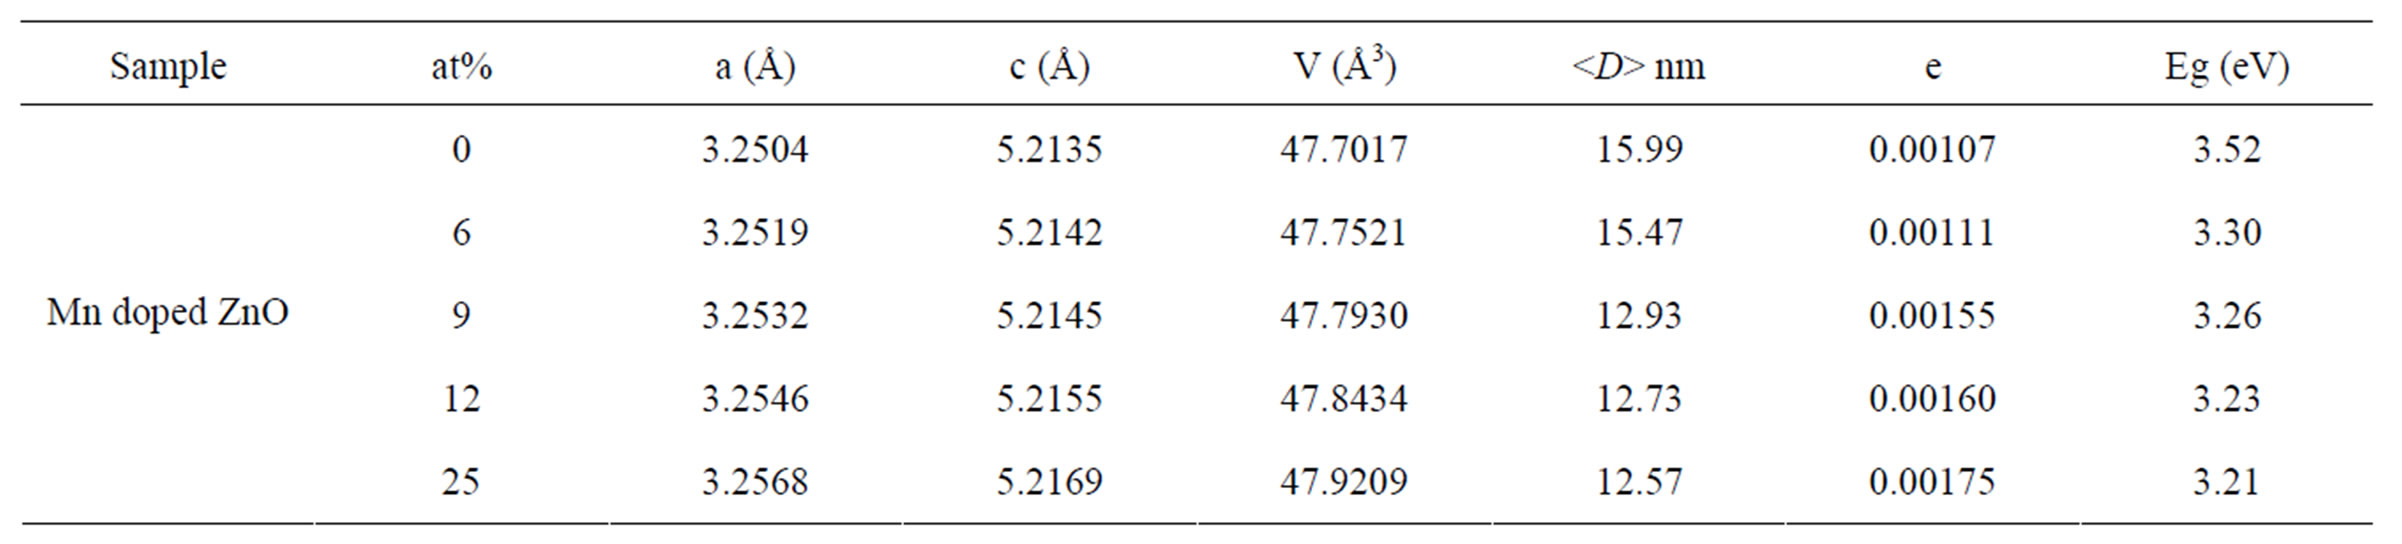
Table 1. Rietveld refined XRD data and optical gap of Mn-doped nanocrystalline ZnO particles.
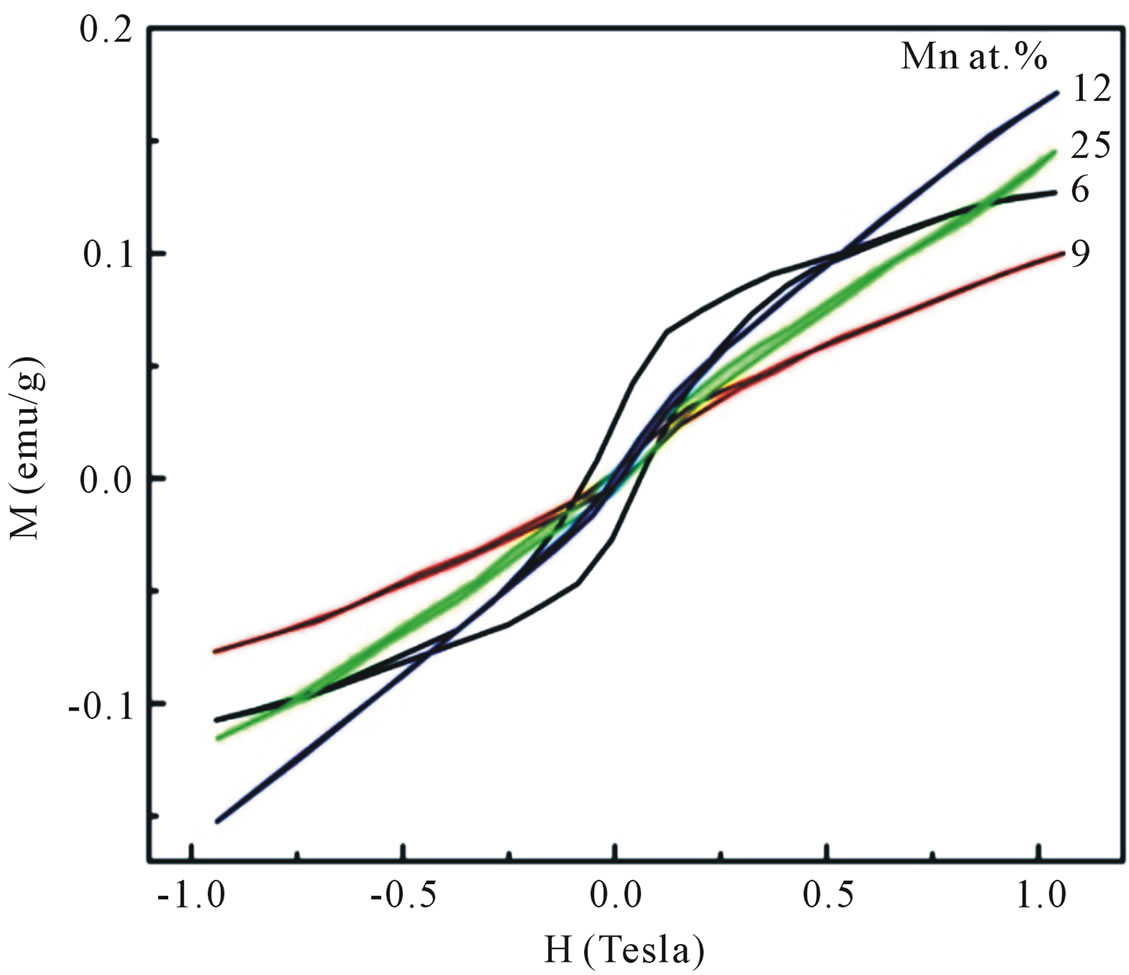
Figure 8. Room temperature M-H curves for Mn-doped nanocrystalline ZnO particles synthesized with various doping concentrations.
with TC ≈ 46 K [19]. Thus, the ferromagnetism behavior observed in our samples studied here does not seem to be related with the presence of any secondary phase such as ZnMn2O4 or Mn3O4.
Electron spin resonance (ESR) is an effective tool to investigate the oxidation state, electronic configuration and site occupancy of the dopant transition metal ion more critically and also to understand the carrier concentration and magnetic exchange coupling at a microscopic level. As the number of unpaired electrons are different in different oxidation states, they can be easily distinguished from the number of fine transitions in the ESR spectra from their g-values. In addition the ESR technique is very sensitive method for detecting ferromagnetic ordering as well as other magnetic species. It is well established that Mn is divalent in II-VI compounds, and assumes the high spin d5 configuration characterized by S = 5/2 and g » 2.0 [20-22]. Figure 9 shows the ESR spectra of ZnO particles doped with different Mn concentrations recorded at room temperature. In our ESR experiments, all signals can be considered as a superposition of two overlapping signals. A broad signal appears
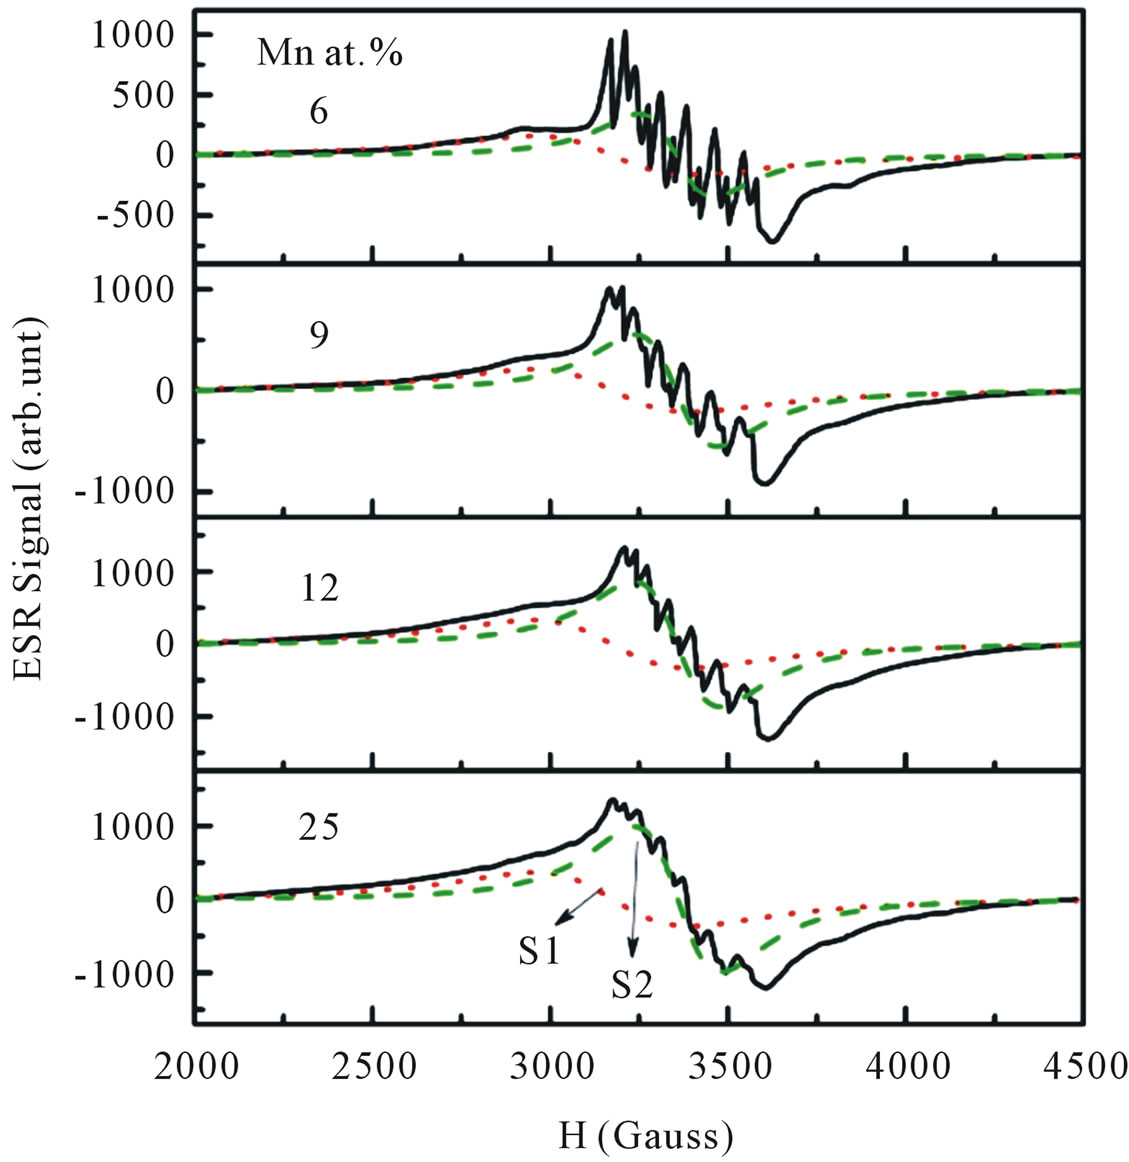
Figure 9. Experimental and fitted ESR spectra of Mn-doped nanocrystalline ZnO particles doped with various doping concentrations. The spectra are deconvoluted into two signals: S1 (red-dotted line) and S2 (green-dashed line) signal.
at the lower field is attributed to ferromagnetic-resonance which arises from transition within the ground state of the ferromagnetic domain [23,24], and a narrow ESR signal arising from the paramagnetic states of isolated Mn2+ ions at room temperature is detected at a higher field in the form of hyperfine and fine lines [25,26]. However, it is believed that this narrow signal is not involved in the ferromagnetic ordering [27]. Thus, our ESR measurements revealed the co-existence of ferromagnetic and paramagnetic states. At lower doping concentrations, an isotropic hyperfine spectrum with six lines is clearly observed. The electronic configuration of the Mn2+ ion is 3 d5 and the electronic ground state is 6S5/2, which splits into three Kramers doublets (±5/2, ±3/2 and ±1/2). In the presence of a magnetic field, the spin degeneracy of isolated Mn2+ ion can be completed removed by the Zeeman splitting, resulting in five fine-structure transitions each split into six hyperfine lines. Due to hyperfine splitting, each of these transitions will be split into six hyperfine sublevels. Upon increasing the Mn concentration, the contribution of hyperfine spectrum of the isolated Mn2+ will become weaker. To determine the g-value and the number of spins associated with each signal we fit the ESR signals with two Lorentzian functions. We labeled this type of spectrum as S1 (a broad signal) and S2 (a narrow signal). The S1 line exhibits a g-value of approximately 2.1195 and ΔHpp of approximately 438 G, while the S2 line has a g-value of approximately 2.0068 and ΔHpp of approximately 208 G. In the doping range investigated, the g-values and ΔHpp of the S1 line were observed to be independent of the doping concentrations, whereas the g-values and ΔHpp of the S2 line tended to decrease and increase, respectively with increasing doping concentrations. The g-values, ΔHpp and corresponding number of spins participating (peak area) in producing the S1 and S2 signals are provided in Figures 10 and 11. It is seen that with increasing doping concentrations the total number of spins contributed to the paramagnetic state is considerably higher than the total number of spins contributed to the ferromagnetic states.
Although it is known that Mn ions belonging to the paramagnetic states do not contribute to the magnetic signal, we observed a decrease in magnetization of the
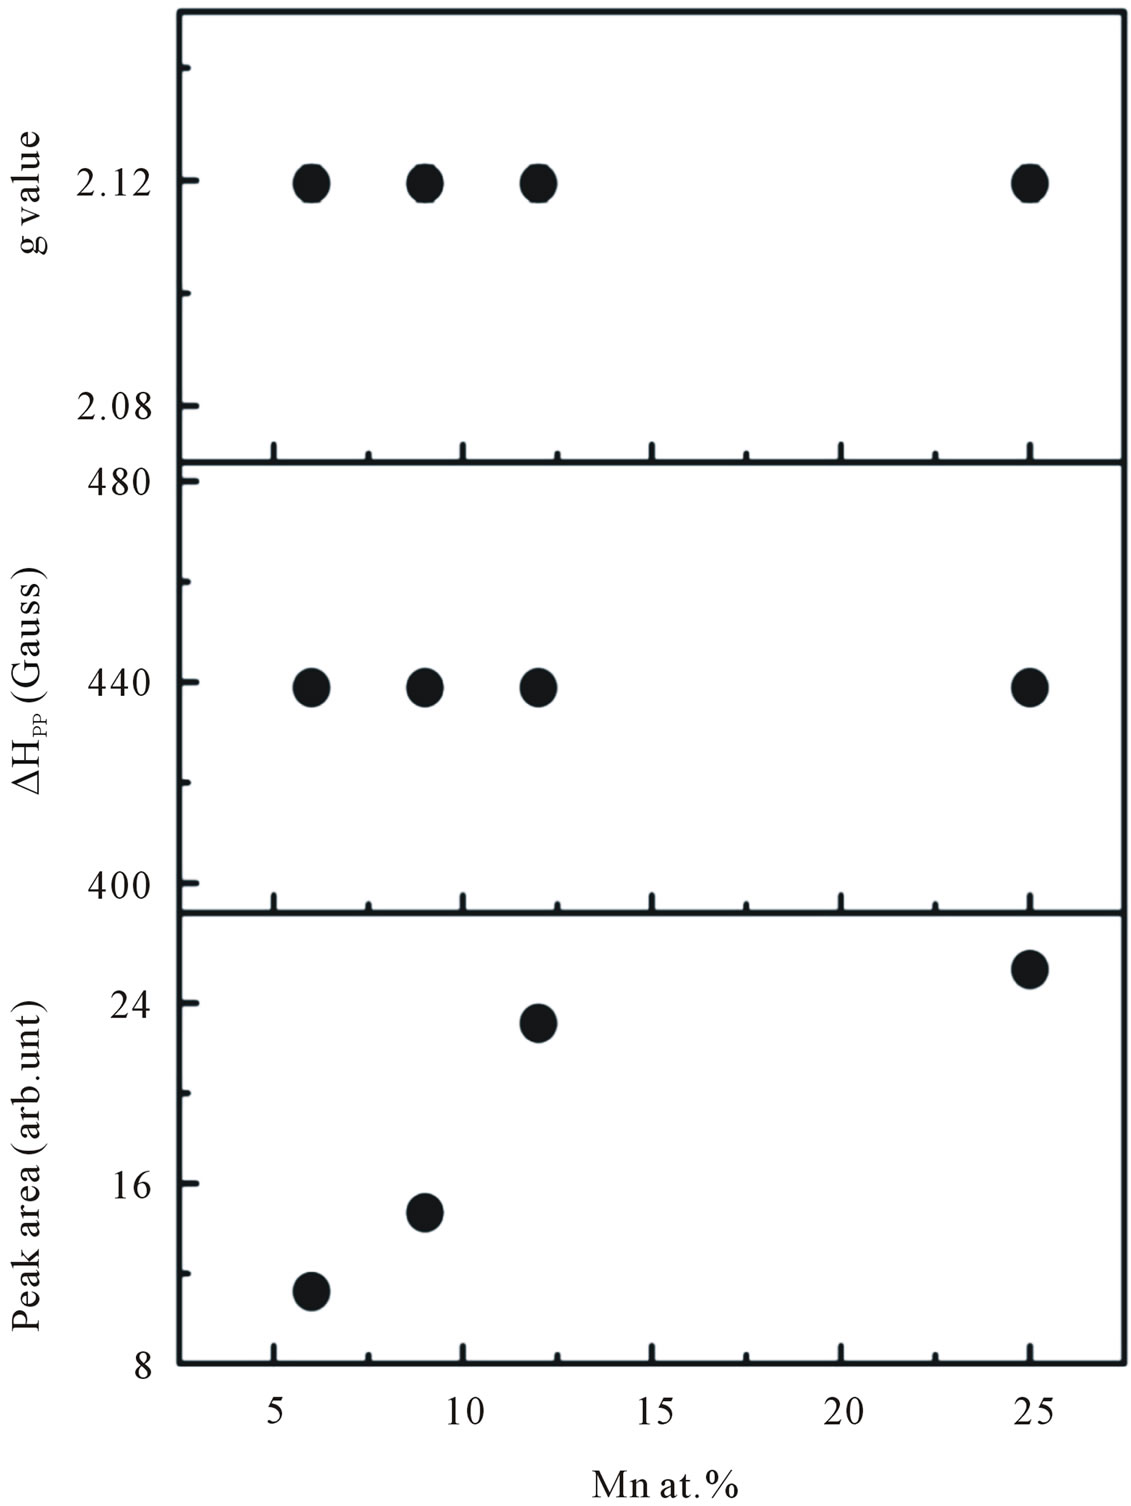
Figure 10. The g-values, line width ∆Hpp, and peak area of the S1 line signal as a function of doping concentration.
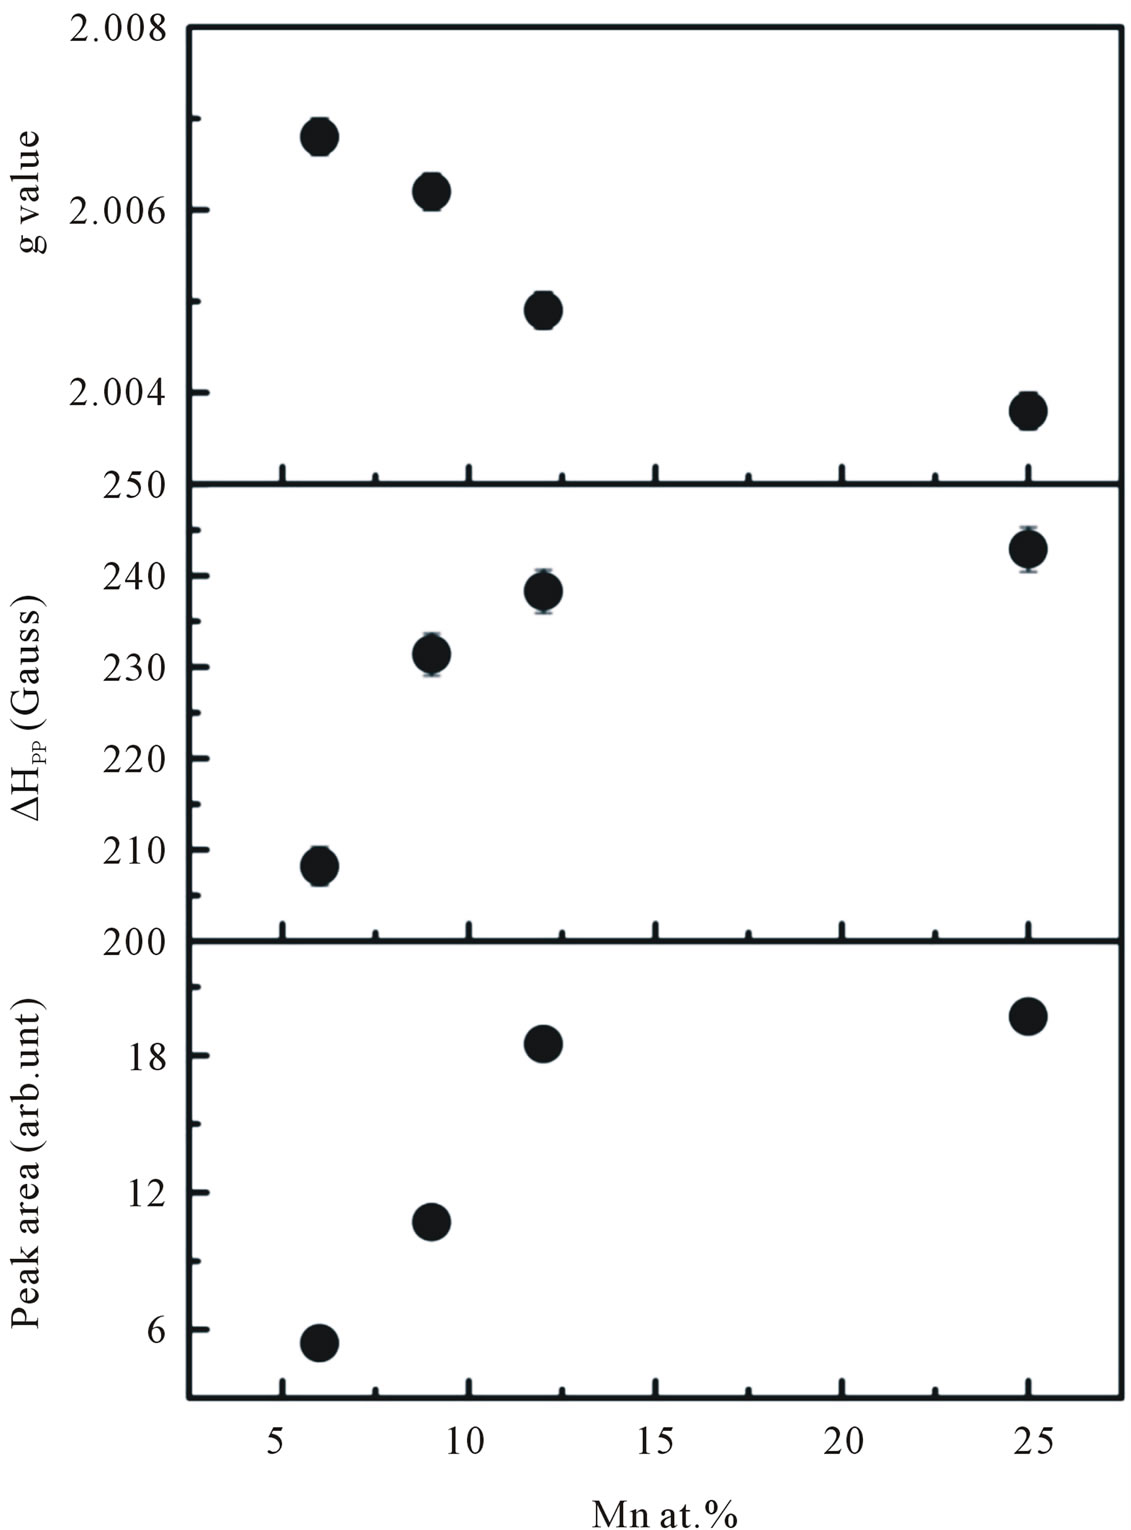
Figure 11. The g-values, line width ∆Hpp, and peak area of the S2 line signal as a function of doping concentration.
samples with increasing doping concentration. This result is consistent with the result obtained from ESR measurements. A similar result was also obtained by other researchers [28-30] who proposed that the concentration of oxygen vacancies played an important role in mediating the ferromagnetic exchange between Mn ions, which is consistent with the bound magnetic polaron (BMP) theory. According to this theory, the ferromagnetic exchange between magnetic transition metal ions in DMS is mediated by a shallow donor electron that form a BMP and overlaps to create a spin-split impurity band [28]. In accordance with the BMP model, the magnetization of the system is assumed to originate from regions of correlated and isolated spins. The magnetization that arises from the correlated spins is ferromagnetic, whereas the magnetization that is due to the isolated spin is paramagnetic. From the discussion above, the donor impurity band exchange model is an appropriate explanation for the observed RTFM behavior in our Mn-doped samples.
4. Summary
In summary, a series of nanocrystalline Mn-doped ZnO particles were synthesized by co-precipitation method. The XRD patterns suggest that all of our nanocrystalline Mn-doped ZnO particles are constituted in a hexagonal wurzite structure with a preferential orientation of (101) diffraction plane. At the concentration Mn of about 30 at% the crystallographic form deviates from its wurzite structure with the manifestation of secondary phases ZnMn2O4, suggesting a greater amount of Mn incorporation into the sample. With the increase in Mn concentrations up to 25 at% the lattice parameter and the average crystallite size increased, indicating that Mn ions substitute for the site of Zn ions and disorder started to occur in the samples. The optical absorption studies showed that band-gap energy is decreased from 3.30 to 3.21 eV as the doping concentration increased from 6 to 25 at%. Samples doped with Mn concentrations up to 25 at% were found to exhibit room-temperature ferromagnetism. Our VSM results indicate that our Mn-doped samples display ferromagnetic interaction that cannot be attributed to the presence of secondary-phase. From VSM and ESR results, we believed the observed RTFM order supports the BMP model [28].
REFERENCES
- P. Sharma, A. Gupta, K. V. Rao, F. J. Owens, R. Sharma, R. Ahuja, J. M. Osorio, B. Johansson and G. A. Gehring, “Ferromagnetism above Room Temperature in Bulk and Transparent Thin Films of Mn-Doped ZnO,” Nature Matter, Vol. 2, 2003, pp. 673-677.
- D. C. Kundaliya, S. B. Ogale, S. E. Lofland, S. Dhar, C. J. Metting, S. R. Shinde, Z. Ma, B. Varughese, K. V. Ramanujachari, L. Salamanca-Riba and T. Venkatesan, “On the Origin of High-Temperature Ferromagnetism in the Low-Temperature-Processed Mn-Zn-O System,” Nature Matter, Vol. 3, 2004, pp. 709-714. doi:10.1038/nmat1221
- J. H. Li, D. Z. Shen, J. Y. Zhang, D. X. Zhao, B. S. Li, Y. M. Lu, Y. C. Liu and X. W. Fan, “Magnetism Origin of Mn-Doped Zn Onanoclusters,” Journal of Magnetism and Magnetic Materials, Vol. 302, No. 1, 2006, pp. 118-121. doi:10.1016/j.jmmm.2005.08.025
- S. Banerjee, K. Rajendran, N. Gayathri, M. Sardar, S. Senthilkumar and V. Sengodan, “Change the Room Temperature Magnetic Property of ZnO upon Mn Doping,” Journal of Applied Physics, Vol. 104, No. 4, 2008, Article ID 043913. doi:10.1063/1.2969945
- S. Thota, T. Dutta and J. Kumar, “On the Sol-Gel Synthesis and Thermal, Structural, and Magnetic Studies of Transition Metal (Ni, Co, Mn) Containing ZnO Powders,” Journal of Physics: Condensed Matter, Vol. 18, No. 8, 2006, pp. 2473-2486.
- J. H. Park, M. G. Kim, H. M. Jang, S. Ryu and Y. M. Kim, “Co-Metal Clustering as the Origin of Ferromagnetism in CoDoped ZnO Thin Films,” Applied Physics Letters, Vol. 84, No. 8, 2004, pp. 1338-1340. doi:10.1063/1.1650915
- G. Lawes, A. S. Risbud, A. P. Ramirez and R. Seshadri, “Absence of Ferromagnetism in Co and Mn Substituted Polycrystalline ZnO,” Physical Review B, Vol. 71, No. 4, 2005, Article ID 045201. doi:10.1103/PhysRevB.71.045201
- C. N. R. Rao and F. L. Deepak, “Absence of Ferromagnetism in Mnand Co-Doped ZnO,” Journal of Materials Chemistry, Vol. 15, No. 5, 2005, pp. 573-578. doi:10.1039/b412993h
- A. Tiwari, C. Jin, A. Kvit, D. Kumar, J. F. Muth and J. Narayan, “Structural, Optical and Magnetic Properties of Diluted Magnetic Semiconducting Zn1–xMnxO Films,” Solid State Communications, Vol. 121, No. 6, 2002, pp. 371-374. doi:10.1016/S0038-1098(01)00464-1
- T. Fukumura, Z. W. Jin, M. Kawasaki, T. Shono, T. Hasegawa, S. Koshihara and H. Koinuma, “Magnetic Properties of Mn-Doped ZnO,” Applied Physics Letters, Vol. 78, No. 7, 2001, pp. 958-960. doi:10.1063/1.1348323
- G. K. Williamson and W. H. Hall, “X-Ray Line Broadening from Filled Aluminium and Wolfram,” Acta Metallurgica, Vol. 1, No. 1, 1953, pp. 22-31. doi:10.1016/0001-6160(53)90006-6
- G. J. Huang, J. B. Wang, X. L. Zhong, G. C. Zhou and H. L. Yan, “Ferromagnetism of Mn-Doped ZnO Nanoparticles Prepared by Sol-Gel Process at Room Temperature,” Optoelectronics Letter, Vol. 2, No. 6, 2006, pp. 6-9.
- Z. H. Wang, D. Y. Geng and Z. D. Zhang, “Room-Temperature Ferromagnetism and Optical Properties of Zn1–xMnxO Nanoparticles,” Solid State Communications, Vol. 149, No. 17-18, 2009, pp. 682-684. doi:10.1016/j.ssc.2009.02.016
- C. J. Cong, J. H. Hong, Q. Y. Liu, L. Liao and K. L. Zhang, “Synthesis, Structure and Ferromagnetic Properties of Ni-Doped ZnO Nanoparticles,” Solid State Communications, Vol. 138, No. 10-11, 2006, pp. 511-515. doi:10.1016/j.ssc.2006.04.020
- R. Elilarassi and G. Chandrasekaran, “Structural, Optical and Magnetic Charazterization of Cu-Doped ZnO Nanoparticles Synthesized Using Solid State Reaction Method,” Journal of Matter Science: Matter Electron, Vol. 21, 2010, pp. 1168-1173. doi:10.1007/s10854-009-0041-y
- P. K. Sharma, R. K. Dutta, A. C. Pandey, S. Layek and H. C. Verma, “Effect of Iron Doping Concentration on Magnetic Properties of ZnO Nanoparticles,” Journal of Magnetismand Magnetic Materials, Vol. 321, No. 17, 2009, pp. 2587-2591. doi:10.1016/j.jmmm.2009.03.043
- A. M. Abdel Hakeem, “Room-Temperature Ferromagnetism in Zn1–xMnxO,” Journal of Magnetism and Magnetic Materials, Vol. 322, No. 6, 2010, pp. 709-714. doi:10.1016/j.jmmm.2009.10.046
- O. D. Jayakumar, H. G. Salunke, R. M. Kadam, M. Mohapatra, G. Yaswant and S. K. Kulshreshtha, “Magnetism in Mn-Doped ZnO Nanoparticles Prepared by a Co-Precipitation Method,” Nanotechnology, Vol. 17, No. 5, 2006, pp. 1278-1285. doi:10.1088/0957-4484/17/5/020
- A. Chartier, P. D. Arco and R. Dovesi, “Ab Initio Hartree-Fock Investigation of the Structural, Electronic, and Magnetic Properties of Mn3O4,” Physics Review B, Vol. 60, No. 20, 1999, pp. 14042-14048. doi:10.1103/PhysRevB.60.14042
- T. Dietl, “Ferromagnetic Semiconductors,” Semiconductor Science and Technology, Vol. 17, No. 4, 2002, pp. 377-392. doi:10.1088/0268-1242/17/4/310
- J. K. Furdyna and J. Kossut, “Dilute Magnetic Semiconductors,” In: R. K. Williarson and A. C. Beer Eds., Semiconductor and Semimetals, Academic Press, New York, 1988.
- J. Kossut and W. Dobrowolski, “Handbook of Magnetic Materials,” K. H. J. Buschow, Ed., Elsevier, Amsterdam, 1993, Vol. 7, p. 231.
- R. M. Kadam, M. K. Bhide, M. D. Sastry, J. V. Yakhmi and O. Kahn, “EPR Studies on (NBu4)2Co2[Cu(opba)]3.S, Where Opba = Ortho-Phnylenesis (Oxamato) and S = Solvent: Unusual Case of Long-Range Magnetic Order in Weakly Interacting Systems,” Chemistry Physics Letters, Vol. 357, 2002, pp. 457-463. doi:10.1016/S0009-2614(02)00542-0
- D. Karmakar, S. K. Mandal, R. M. Kadam, P. L. Paulose, A. K. Rajarajan, T. K. Nath, A. K. Das, I. Dasgupta and G. P. Das, “Ferromagnetism in Fe-Doped ZnO Nanocrystals: Experiment and Theory,” Physical Review B, Vol. 75, No. 14, 2007, Article ID 144404. doi:10.1103/PhysRevB.75.144404
- J. Reddy, M. K. Kokila, H. Nagabhushana, J. L. Rao, B. M. Nagabhushana, C. Shivakumara and R. P. S. Chakradhar, “EPR and Photoluminescence Studies of ZnO:Mn Nanophosphors Prepared by Solution Combustion Route,” Spectrochimica Acta Part A, Vol. 79, No. 3, 2011, pp. 476-480. doi:10.1016/j.saa.2011.03.014
- B. B. Straumal, B. Baraetzky, A. Mazilkin, S. Protasova, A. Myatiev and P. Straumal, “Increase of Mn Solubility with Descreasing Grain Size in ZnO,” Journal of the European Ceramic Society, Vol. 29, No. 10, 2009, pp. 1963-1970. doi:10.1016/j.jeurceramsoc.2009.01.005
- R. V. Sagar and S. Buddhudu, “Synthesis and Magnetic Behaviour of Mn:ZnO Nanocrystalline Powders,” Spectrochimica Acta Part A, Vol. 75, No. 4, 2010, pp. 1218- 1222.
- J. M. Coey, M. Venkatesan and C. B. Fitzgerald, “Donor Impurity Band Exchange in Dilute Ferromagnetic Oxides,” Nature Matter, Vol. 4, No. 4, 2005, pp. 173-179. doi:10.1038/nmat1310
- L. B. Duan, G. H. Rao, J. Yu, Y. C. Wang, W. G. Chu and L. N. Zhang, “Structural and Magnetic Properties of Zn1–xMnxO (0 ≤ x ≤ 0.40) Nanoparticles,” Journal of Applied Physics, Vol. 102, No. 10, 2007, Article ID 103907.
- M. El-Hilo and A. A. Dakhel, “Structural and Magnetic Properties of Mn-Doped ZnO Powders,” Journal of Magnetism and Magnetic Materials, Vol. 323, No. 16, 2011, pp. 2202-2205. doi:10.1016/j.jmmm.2011.03.031
NOTES
*Corresponding author.