Journal of Biomedical Science and Engineering
Vol.6 No.5(2013), Article ID:31900,7 pages DOI:10.4236/jbise.2013.65072
In silico tests on sequence motif significances for human tissue specific genes*
![]()
School of Computer Science and Technology, Tianjin University, Tianjin, China
Email: gongxj@tju.edu.cn, lin_snowing@yahoo.com.cn
Copyright © 2013 Xiujun Gong, Hualin Xu. This is an open access article distributed under the Creative Commons Attribution License, which permits unrestricted use, distribution, and reproduction in any medium, provided the original work is properly cited.
Received 13 February 2013; revised 3 April 2013; accepted 9 May 2013
Keywords: Tissue Specific Genes; Hypothesis Test; Tissue Rich Motif; Tissue Even Motif
ABSTRACT
Identification and analysis of tissue-specific (TS) genes and their regulatory activities play an important role in understanding the mechanisms of the organism, disease diagnosis and drug design. Although so far we are not clear about the mechanisms totally, the sequence features of TS genes are becoming an important clue. In this paper we used an integrated pipeline to discover sequences motifs for the promoter regions of TS genes. To test the significances of those motifs in a specific tissue, we used hypotheses test approaches including Bayesian hypothesis, Binomial distribution and traditional z-test. We finally got 2784, 1204 and 703 motifs respectively out of 3244 motifs obtained in discovery phase using above three tests from 3954 TS genes across 83 human tissues. 52.7% of those motifs can be found in public databases available.
1. INTRODUCTION
Identification and analysis of tissue-specific (TS) genes and their regulatory activities play an important role in understanding mechanisms of the organism, disease diagnosis and drug design [1]. In last years, many research projects were performed to study expressions and regulatory mechanisms of TS genes including transcription factor and their binding sites, sequence features of promoter regions [2], alternative splicing [3] and Epigenetics features [4] of those genes.
Although until now we are not completely clear about the mechanisms of the gene tissue specificity, the sequence features of TS genes are becoming an important clue [2]. P. FitzGerald et al. calculated the statistics of Simple Sequence Repeats (SSR) and identified that the SSR could be an important factor to the tissue specificity [5]. F. Song et al. pointed that methylation changes during development are dynamic, involve demethylation and methylation, and may occur at late stages of embryonic development or even postnatally using mouse genome data [6]. C. Heber et al. showed that Nucleosome rotational setting is associated with transcriptional regulation in promoters of tissue-specific human genes [4].
With the completion of the whole human genome project, various algorithms have been developed for discovering patterns or motifs of huge volume genome sequences. Those typical algorithms include three phases: motif searching, redundant motif pruning and motif significance testing. The methods for motif discovery may be grouped into two categories [7]: enumerative methods and alignment-based methods. Enumerative methods typically involve exhaustive enumeration of words up to some maximum size in a dataset, and are thus best suited to consensus sequence motif models, like Consensus, PROJECTION, PDEM. Alignment methods take on a wide variety of forms, but often involve the development of a probabilistic model of the observed sequence data and optimization to find motifs common to all input sequences, such as MEME [8] program, the expectationmaximization (EM) algorithm and Gibbs sampling [9]. Each algorithm has its unique advantage on individual species or datasets. Tompa et al. [7] conducted a study that compares the performance of 13 different motif finders by using a variety of real and synthetic sequence sets covering a range of genomes. A common practice is to apply several such algorithms simultaneously to improve coverage at the cost of increased redundancy [10].
In this paper, we first applied an integrated motif searching approach to find motifs for TS genes. As we known, it is the first time to search sequence motifs for tissue specific genes. Then we merged the similar motifs using the method in literature [7]. To test the significances of those motifs in each tissue, we used three hypothesis test methods: Bayesian hypothesis, Binomial distribution and traditional z-test. We also distinguish two kinds of significant motifs: tissue rich motifs (TIM) and tissue even motifs (TEM). The former refer to motifs only showing significance in few tissues, and the later refer to motifs in most of the tissues. We finally got 2784, 1204 and 703 motifs respectively out of 3244 motifs obtained in discovery phase using above three tests from 3954 TS genes across 83 human tissues. 52.7% those motifs can be found available in databases public.
2. METHOD@NolistTemp#2.1. Date Preparing
Tissue specific genes were obtained mainly by querying the tissue specific gene expression database TiGER [11] against the tissue names. Some of them came from TisGED [12] database. All of the TS genes with PubMed IDs were used in the experiment. We finally got 3954 human tissue specific genes across 83 human tissues. The gene’s promoter sequences are downloaded from DBTSS [13] and EPD [14]. The promoter region with 1500 bp (−499 bp - 1000 bp around TSS) length is used for motif searching.
2.2. Motif Searching
2.2.1. Motif Searching
In this phase, we integrated three motif searching programs: MEME, AlignACE and Gibbs Sampler. The length of candidate motifs is fixed to 6 - 12 bp, other parameters as the default setting. In this phase, we get 6794 motifs.
2.2.2. PWM Representations of Motifs
Since different motif search programs have their own motif formats as outputs, we have to define a uniform format for motifs to compare their similarities in motif merging phase. A common used representation is the Position Specific Weight Matrix (PWM or PSWM) [15], which is a matrix of nucleotide frequencies in each position of the motif (i.e. the frequencies of the nucleotides A, C, G and T in each position). We transformed all the motifs to the PWM representation.
2.2.3. Motif Merging
In motif merging phase, we used the method similar with in literature [16] to remove motif redundancies. Because this step isn’t the emphasis of this paper, we skip the details of the merging process. After motif merging, 3244 motifs were obtained.
2.3. Motif Tissue Significance Testing
To identify whether a motif is really related with tissue specificity or not, we statistically distinguish two kinds of motifs: tissue rich motifs (TRM) and tissue even motifs (TEM). The former refer to motifs only showing statics significance in less than 3 tissues, and the later refer to motifs in more than 70 tissues. We used hypothesis approaches to test the significance of motifs in each tissue. To do the hypothesis test, the distributions of motifs in a given sequence must be estimated. Therefore, a key step is to calculate the statistic of a motif in a given sequence.
For a given motif m with length w from tissue T0, in which the motif is discovered, our purpose is to judge whether its occurrence in tissue T1 is significant or not. Therefore we have to take a measure on the motif occurrences. Based on the requirements of different hypothesis tests, we applied scoring schemas.
Definition 1: for a given motif m, its matching Score with a Promoter sequence segment x of the gene from tissue T1 PMS1 is defined:
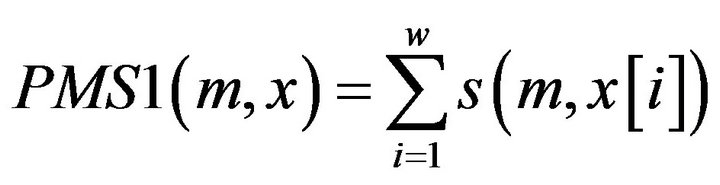
where  is the score between m and x in position i, which can be calculated through the PWM of the motif.
Definition 2: for a given motif m, its matching Score with a Promoter Sequence S of the gene from tissue T1 PSS1 is defined:
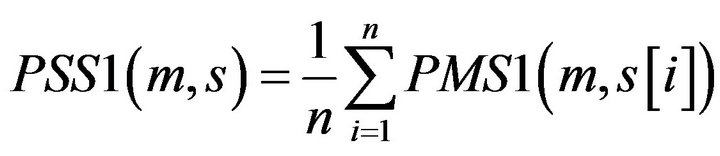
where  with PMS1 more than a predefined threshold is a segment of S by sliding a widow with length w, n is the number of
 .
.
PSS1 is used in classical z-test and binomial test.
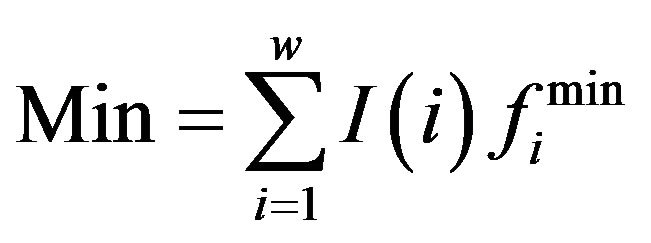
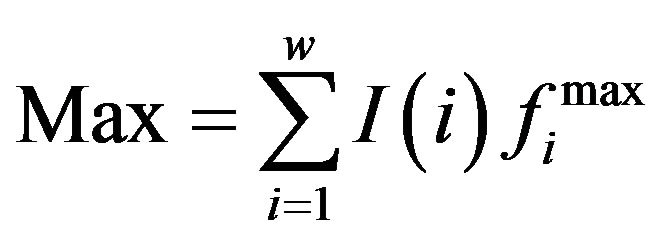
Definition 3: for a given motif m, its matching Score with a Promoter sequence segMent x of the gene from tissue T1 PMS2 is defined [16]:
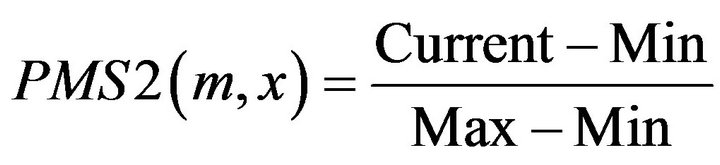 where
where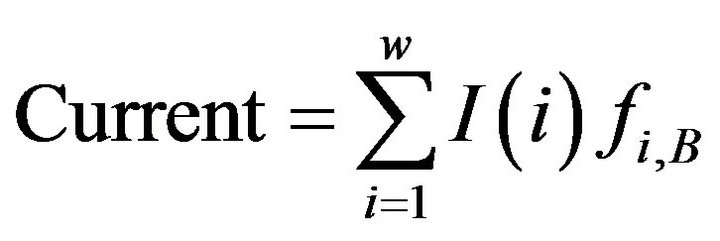 ,
,  ,
,  .
.
 is the frequency of residue B at position i, which is from PWM;
  is the smallest/largest frequency of the residue at position i and
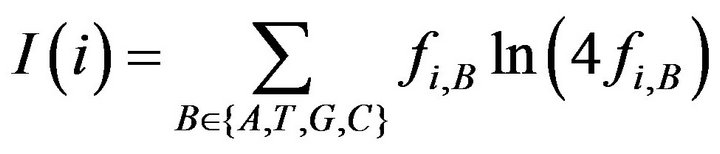 describe the information content of residue B at position i.
Definition 4: for a given motif m, its matching Score with a Promoter Sequence S of the gene from tissue T1 PSS2 is defined:

where  with PMS2 more than a predefined threshold is a segment of S by sliding a widow with length w, n is the number of
 .
.
PSS2 is used in Bayesian hypothesis test.
2.3.1. Classical Z-Test
In the classical z-test, we estimated the mean and variance of the match score PSS1 in tissue T1, and then calculated the z-value:
 .
.
where  and
and  are the mean and variance of the PSS1 in tissue T0.
In the experiment, we set the confidence degree 0.05.
2.3.2. Bayes Hypothesis Test
Assumed that the PSS2 of a motif at tissue T0 follows a Gaussian distribution . To test that whether the motif is significant at tissue T1, we constructed two hypothesizes as the followings:
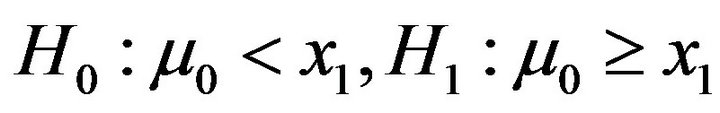
where  is the mean of PSS2 in tissue T1.
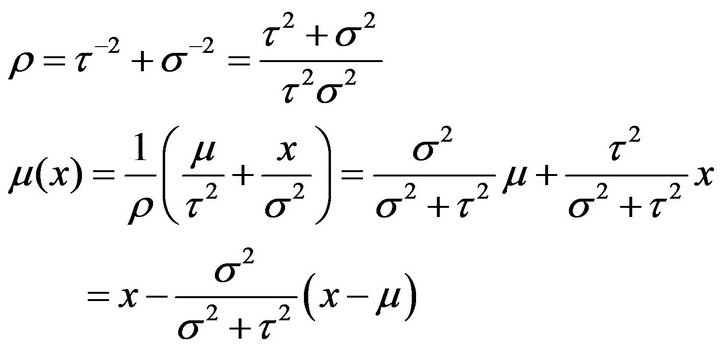
Assumed that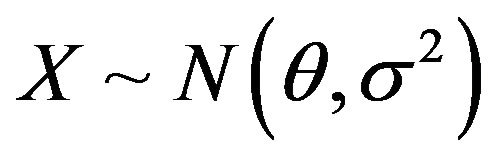 , where
  is unknown and
  is known,
  , where both
  and
and  are known. The post distribution of
  is followed
  according [16], where
2.3.3. Binomial Distribution Test
In Binomial distribution test, instead of PSS1 value, we need the number of matches between the motif and the promoter sequence of a gene. A match between a motif and a sequence is defined if the PMS1 of the motif with a segment of the sequence is larger than a predefined value. We counted all the matches in tissue T0 and T1, represented the numbers of matches by K0 and K1 respectively. The Binomial distribution test is to seek a value K-value holding:
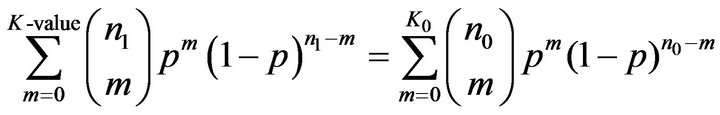
where n0 and n1 are the numbers of promoter sequences in tissue T0 and T1 respectively and p is fixed to 0.5 in the experiment.
3. RESULT@NolistTemp#3.1. Data Sources
The gene expression datasets, such as GNF, SAGE, and EST, are very widely used as data sources for the identifications of TS genes. However, because of the noise in expression datasets and human involvement in defining thresholds, the reliability of the identifications is often not high. In this paper, we use the specific genes obtained mainly by querying the tissue specific gene expression database TiGER against the tissue names. Some of them came from TisGED database. All of the TS genes with PubMed IDs were used in the experiment. We obtained 3954 TS genes across 83 human tissues. Because of the limitation of page size, the gene lists for all the tissues are available on request to the authors.
The gene’s promoter sequences were downloaded from DBTSS and EPD. The promoter region with length 1500 bp (−499 bp - 1000 bp around TSS) is used for motif discovery.
3.2. Motifs Discovered by Three Test Methods
After merging phase, we get total 3244 motifs. The number of motifs in each tissue is shown in Table 1.
With Bayes Hypothesis Test method, we get 1534 TRMs and 1270 TEMs. With Classic z-test method, 539 TRMs and 164 TEMs are obtained. With Binomial Distribution test method, the numbers of two kinds of motifs are 270 and 925 respectively. For the details, see in Figures 1 and 2.
3.3. Overlap Motifs in Three Test Methods
In all the TRMs, 5 TRMs are covered by three methods, 150 TRMs are covered by two methods. In all the TEMs, 39 TEMs covered by three methods, 264 TEMs covered by two methods. For the details, see Figure 3.
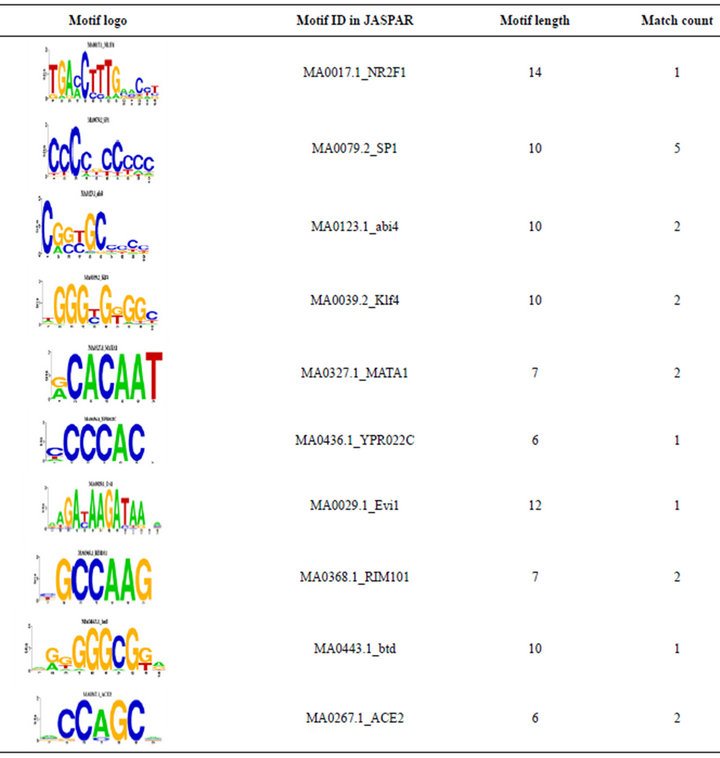
We also compared the overlapped 5 TRMs and 39 TEMotif with JASPAR [17]. 4 TRMs (see Table 2) out of 5 TRMs are found in the JASPAR. For an example, [CCCCNCCCCC] is a motif which was discovered by previous researches in JASPAR ID MA0079.2_SP1, and [GGGGAATCCCC] with JASPAR ID MA0105.1_ NFKB1. 19 TEMs out of 39 TEMs are found in the JASPAR. For an example, the motif [NGNNGCRSCG] has JASPAR ID MA0123.1_abi4. For the details see Table 3.
4. CONCLUSIONS
Tissue specificity is the foundation for cells form specific
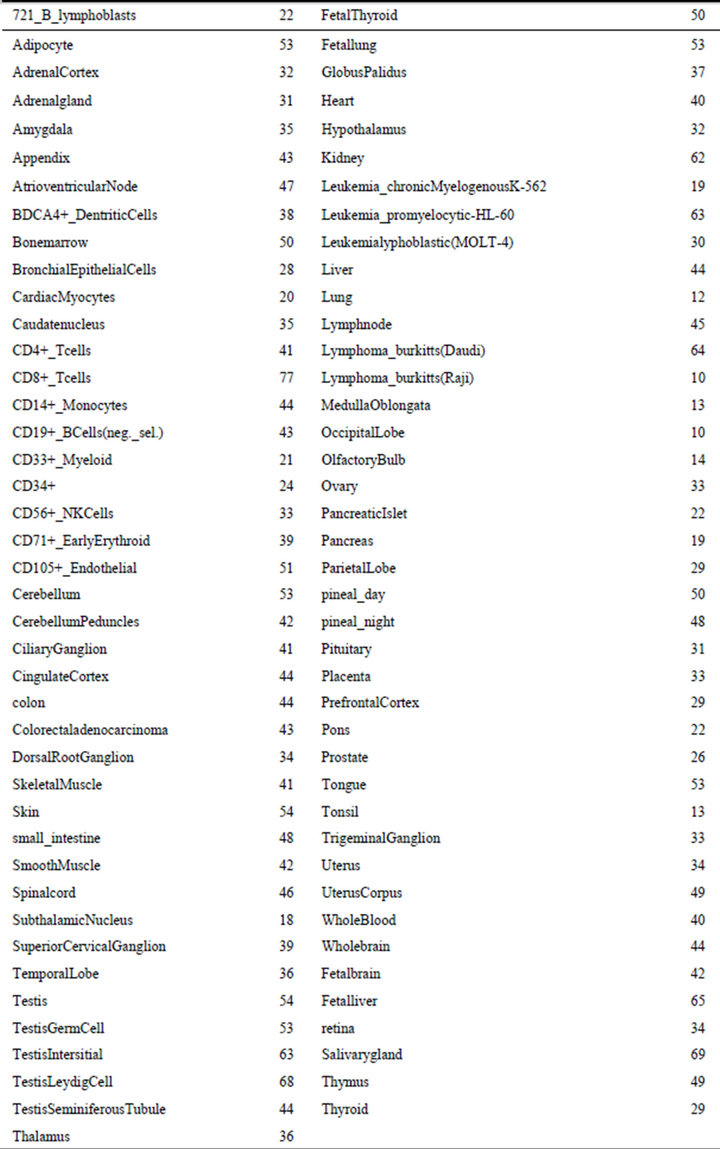
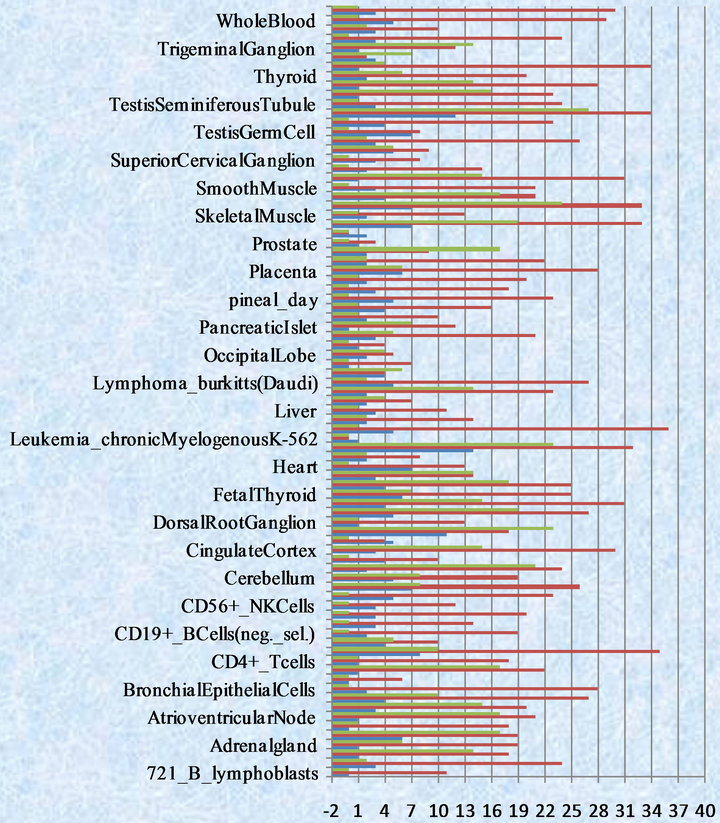
Figure 1. Numbers of TEMs by three test methods (The green color represents binomial distribution method, red color represents bayes hypothesis test method, purple color represents classic hypothesis test method).
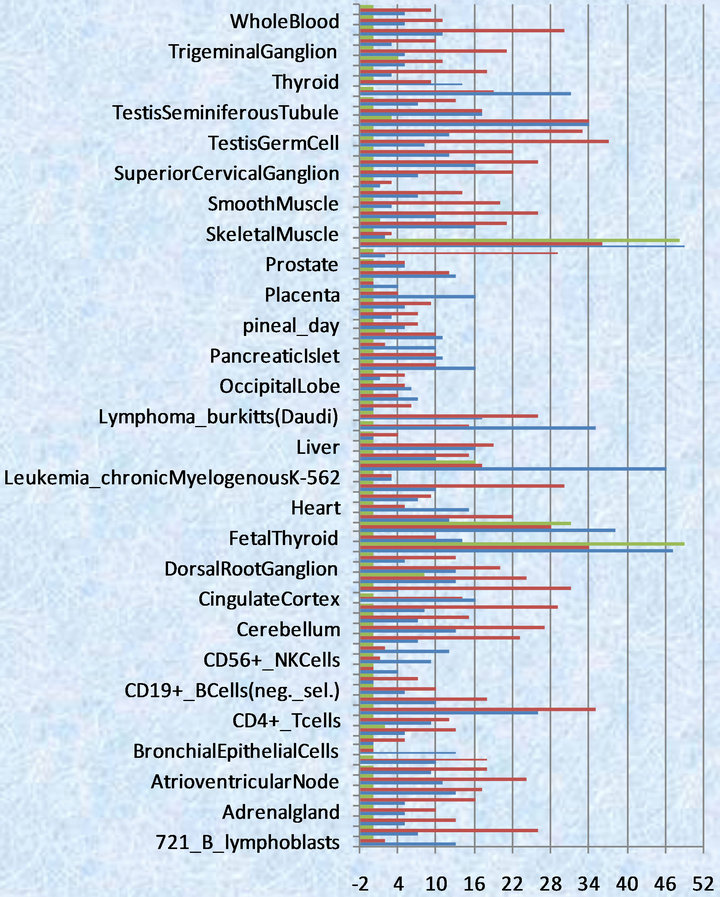
Figure 2. Numbers of TEMs by three test methods (The green color represents binomial distribution method, red color represents bayes hypothesis test method, purple color represents classic hypothesis test method).
 (a)
(a) (b)
(b)
Figure 3. (a) Venn diagram of numbers of tissue rich motif finding by three methods; (b) Venn diagram of numbers of tissue even motif finding by three methods.
tissues and functional organs. Identification and analysis of tissue-specific genes and their regulatory activities play an important role in understanding mechanisms of the organism, disease diagnosis and drug design. And finding accurate and meaningful motif with tissue specificity still remains a big challenge.
In this paper we used an integrated pipeline to discover sequence motifs for the promoter regions of TS genes. To test the significances of those motifs in a specific tissue, we used hypotheses test approaches including Bayesian hypothesis, Binomial distribution and traditional

z-test. We finally got 2784, 1204 and 703 motifs respectively out of 3244 motifs obtained in discovery phase using above three tests from 3954 TS genes across 83 human tissues. 52.7% of those motifs can be found available in databases public.
REFERENCES
- Dezso, Z., et al. (2008) A comprehensive functional analysis of tissue specificity of human gene expression. BMC Biology, 6, 49.
- Kuzmin, D., et al. (2010) Novel strong tissue specific promoter for gene expression in human germ cells. BMC Biotechnology, 10, 58. doi:10.1186/1472-6750-10-58
- Grosso, A., Gomes, A. and Barbosa, N. (2008) Tissuespecific splicing factor gene expression signatures. Nucleic Acids, 36, 4823-4832. doi:10.1093/nar/gkn463
- Hebert, C. (2010) Nucleosome rotational setting is associated with transcriptional regulation in promoters of tissue-specific human genes. Genome Biology, 11, R51. doi:10.1186/gb-2010-11-5-r51
- Lawson, M.J. and Zhang, L. (2008) Housekeeping and tissue-specific genes differ in simple sequence repeats in the 5'-UTR region. Gene, 407, 54-62. doi:10.1016/j.gene.2007.09.017
- Song, F., et al. (2009) Tissue specific differentially methylated regions (TDMR): Changes in DNA methylation during development. Genomics, 93, 130-139. doi:10.1016/j.ygeno.2008.09.003
- Tompa, M., et al. (2005) Assessing computational tools for the discovery of transcription factor binding sites. Nature Biotechnology, 23, 137-144. doi:10.1038/nbt1053
- Bailey, T.L., et al. (2009) MEME SUITE: Tools for motif discovery and searching. Nucleic Acids Research, 37, W202-W208.
- Neuwald, F., Liu, J.S. and Lawrence, C.E. (1995) Gibbs motif sampling detection of bacterial outer membrane protein repeats. Protein Science: A Publication of the Protein Society, 4, 1618-1632.
- Clements, M. (2007) Creating motifs with LocoMotif. Scanning.
- Liu, X., Yu, X., Zack, D.J., Zhu, H. and Qian, J. (2008) TiGER: A database for tissue-specific gene expression and regulation. BMC Bioinformatics, 9, 271. doi:10.1186/1471-2105-9-271
- Xiao, S.J., Zhang, C. and Zou, Q. (2010) TiSGeD: A database for tissue-specific genes. Bioinformatics, 26, 1273- 1275. doi:10.1093/bioinformatics/btq109
- Suzuki, Y., Yamashita, R., Nakai, K. and Sugano, S. (2002) DBTSS: DataBase of human transcriptional start sites and full-length cDNAs. Nucleic Acids Research, 30, 328-331. doi:10.1093/nar/30.1.328
- Périer, R.C., Praz, V., Junier, T., Bonnard, C. and Bucher, P. (2000) The eukaryotic promoter database (EPD). Nucleic Acids Research, 28, 302-303.
- Zare-Mirakabad, F., Ahrabian, H., Sadeghi, M., Hashemifar, S., Nowzari-Dalini, A. and Goliaei, B. (2009) Genetic algorithm for dyad pattern finding in DNA sequences. Genes & Genetic Systems, 84, 81-93. doi:10.1266/ggs.84.81
- Habib, N., Kaplan, T., Margalit, H. and Friedman, N. (2008) A novel bayesian DNA motif comparison method for clustering and retrieval. PLoS Computational Biology, 4. doi:10.1371/journal.pcbi.1000010
- Sandelin, A., Alkema, W., Engström, P., Wasserman, W.W. and Lenhard, B. (2004) JASPAR: An open-access database for eukaryotic transcription factor binding profiles. Nucleic Acids Research, 32, D91-D94.
NOTES
*This work is partly supported by the Natural Science Funding of China under grand number 61170177 and innovation funding of Tianjin University.