Journal of Environmental Protection
Vol. 4 No. 3 (2013) , Article ID: 28738 , 10 pages DOI:10.4236/jep.2013.43033
Chemically Modified Cornulaca monacantha Biomass for Bioadsorption of Hg (II) from Contaminated Water: Adsorption Mechanism
![]()
1Faculty of Science and Arts at Shaqra, Shaqra University, Shaqra, KSA; 2National Research Centre, Textile Research Division, Cairo, Egypt.
Email: *ashem2000@yahoo.com, alihashem@su.edu.sa
Received January 3rd, 2013; revised February 4th, 2013; accepted February 26th, 2013
Keywords: Cornulaca monacantha; Carbamoylethylation; Adsorption Isotherm; Hg (II) Removal; Contaminated Water
ABSTRACT
Cornulaca monacantha (CM) a desert plant has been utilized as adsorbent material for the removal of Hg (II) ions from contaminated water after treatment with acrylamide in alkaline medium to form carbamoylethylated Cornulaca monacantha (CECM). Three levels of CECM having different nitrogen content were prepared. The CECM samples were characterized by estimating the nitrogen content. The ability of CECM to adsorb Hg (II) was investigated by using batch adsorption procedure. The data of the adsorption isotherm was tested by the Langmuir, Freundlich and Temkin models. The removal of Hg (II) onto CECM particles could be well described by the pseudo-second order model. The adsorption rate of mercury was affected by the initial Hg (II) ion concentration, initial pH, adsorbent concentration and agitation time as well as extent of modification. The adsorption experiments indicated that the CECM particles have great potential for the removal of Hg (II) from contaminated water. The maximum adsorption capacity, Qmax of the CECM towards Hg (II) ions was found to be 384.6 mg/g at 30˚C. Similarly, the Freundlich constant, n was found to be 2.03 at 30˚C.
1. Introduction
The industrial activity is responsible to generate a large volume hazardous containing effluents [1,2]. These hazardous effluents need to be treated before being delivered into the environment.
Mercury can be found in significant amounts in wastes from chloro-alkali manufacturing plants, electrical and electronics manufacturing, and sulfide ore roasting operations. Mercury is the most harmful to humans, plants and animals. Exposure to mercury can have toxic effects on reproduction, the central nervous system, liver, and kidney, and cause sensory and psychological impairments [3]. Therefore, all countries have taken measures to reduce mercury exposure through comprehensive prevention strategies including environmental standards that require removal of mercury from industrial effluents.
There are various established methods for the removal of heavy metals. Generally, the techniques employed include reduction and precipitation [4], coagulation, flotation [5], adsorption on activated carbon [6,7], ion-exchange and reverse osmosis or electro dialysis [8]. These methods, however, are less efficient and create sludge. Ion-exchange and reverse osmosis, even though effective and efficient, and expensive, hence only few industries think of it.
The adsorption process [9] is one of the most effective methods used to remove heavy metals from aqueous solution. Activated carbon is the most widely used adsorbent for this purpose because of its extended surface area, microporous structure, high adsorption capacity and high degree of surface reactivity. Therefore, commercially activated carbons are very expensive [10]. This led to search for cheaper adsorbent. Consequently, numerous low-cost alternative adsorbent have been proposed including lingo-cellulosic wastes. Natural cellulosic materials are abundantly available, very cheap and can be modified very easily. Some chemical modifications of cellulose or lignocellulosic materials can improve the adsorbent behavior of these materials. Modification reactions, including crosslinking and/or functionalization, have been tried to enhance the adsorbent stability and/or adsorption capacity. In our laboratory, we have been involved for quite some time in developing various types of agricultural wastes for the removal of heavy metal ions from wastewater [11-14].
The present work was directed at improving the capability of CM residues for removing Hg (II) ions from aqueous solutions. To achieve this goal, the following studies were undertaken: 1) preparation of three levels of CECM with various nitrogen content using acrylamide in alkaline medium; 2) establishment of the conditions under which the maximum adsorption of Hg (II) ions onto CECM occur and 3) evaluation of the kinetics for Hg (II) ion adsorption onto CECM.
2. Experimental
2.1. Materials
Bio-dsorbent, Cornulaca monacantha, a desert plant is widely spread in Kingdom of Saudia Arabia. There is no previous report used, Cornulaca monacantha as adsorbent material for removal of heavy metals. The roots were separated from the stems and leaves, washed with distilled water several times to remove the surface adhered particles and water soluble particles and dried in an electric oven for 24 h and ground using a mixer, and sieved to pass through a 100 - 200 mm. The roots were chosen because they contain the highest percentage of the cellulose content.
2.2. Reagents
Mercuric acetate, EDTA, ethanol, sodium carbonate, and acetic acid were of analytical reagent grade supplied by Merck Company, Germany.
2.3. Methods
2.3.1. Preparation of CECM
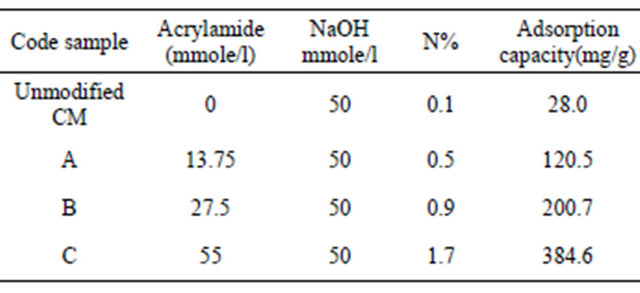
Three levels of CECM with various nitrogen contents were prepared by keeping other reaction conditions constant and varying the amount of acrylamide according to a reported method [15] as shown in Table 1. The reaction was carried out as follows: To a 400 ml beaker containing 10 g of CM with particle sizes in the range 100 - 200 mm was added a know weight of acrylamide (dissolved in the least amount of water). Definite volume of sodium hydroxide solution of known concentration was added to the reaction mixture under continuous stirring with a spatula until a homogeneous paste was obtained. The paste was then transferred to a Erlenmeyer flask and placed in a shaking water-bath at 60˚C for 2 h. The treated sample was subsequently cooled to room temperature. The soluble by-products and any un-reacted acrylamide and excess alkali were removed by washing the sample several times with a water:ethanol (20:80) mixture, and finally dried at 105˚C for 2 h.
Table 1. The characteristics of samples of CECM.
2.3.2. Adsorption Studies
A volume of 100 ml of Hg (II) solution with a concentration in the range 100 - 700 mg/l was placed in a 125 ml Erlenmeyer flask. An accurately weighed adsorbent sample 0.05 g was then added to the solution. A series of such Erlenmeyer flasks were then shaken at a constant speed of 150 rpm in a shaking water bath with temperatures 30˚C. After shaking the flasks for 2 h, the adsorbent was separated by filtration. The filtrate was analysed for the remaining metal ion concentration by titration against standard EDTA solution. The amount of adsorbed metal, qe (mg/g) on adsorbent were calculated according to the following equation:
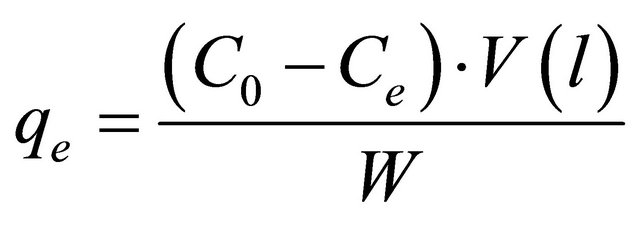 (1)
(1)
where, Co and Ce are the initial and final concentrations of metal ion, mg/l. V is the volume of metal ion (l), W is the weight of adsorbent (g).
2.4. Analyses
2.4.1. Determination of Nitrogen Content (%)
The nitrogen content of CM and CECM samples was determined using the micro-Kjeldahl method [16]. Accurately 0.2 g of the sample was introduced in Kjeldahl digestion tube. 5 g K2SO4 + 0.5 g CuSO4 and 10 ml conc. H2SO4 were added to the sample. The sample was digested for one h. 20 ml of deionized water was added to the sample after allowing it to cool. After adding 25 ml of 40% NaOH, the sample was then distilled in Kjeldahl apparatus and the ammonia liberated was collected in 1 N boric acid and titrated with 0.03 N HCl. The nitrogen content of CM or CECM was calculated as follows:
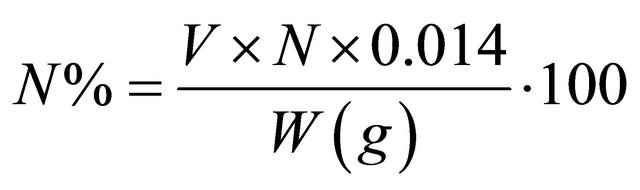 (2)
(2)
where, V is the volume of HCl consumed;
N is the normality of standard HCl;
W is the weight of the sample (g).
2.4.2. Statistical Error Analysis
In the single-component isotherm studies, the optimization procedure requires an error function to be defined to evaluate the fit of the isotherm to the experimental equilibrium data. The common error functions for determining the optimum isotherm parameters were, average relative error (ARE), sum of the squares of the errors (ERRSQ), hybrid fractional error function (HYBRID), Marquardt’s percent standard deviation (MPSD) and sum of absolute errors (EABS) [17]. In the present study, the average relative error (ARE) was used to determine the best fit in isotherm model as:
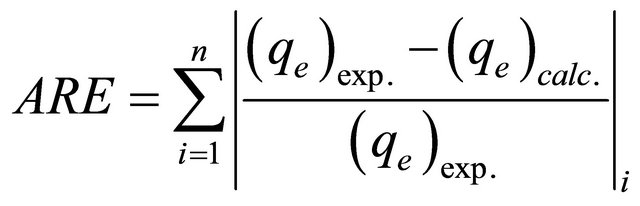 (3)
(3)
3. Results and Discussion
CECM was prepared by reacting CM with acrylamide in alkaline medium. On reacting CM with acrylamide in alkaline medium to obtain carbamoylethylated Cornulaca monacantha (CECM), the following reaction will occur:
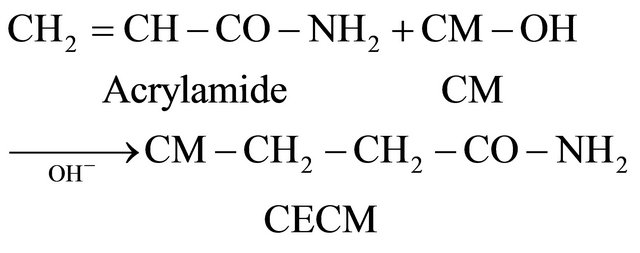 (4)
(4)
CECM samples were prepared in the form of a brown powder having a particle size range of 150 - 200 mm as shown in Table 1.
3.1. Factors Affection Adsorption of Hg (II) onto CECM
3.1.1. Effect of pH
Earlier studies have indicated that the pH of adsorbate is an important parameter affecting bioadsorption of heavy metals. Figure 1 shows the bioadsorption capacity of Hg (II) as a function of pH (2 - 6) at fixed adsorbent concentration, fixed agitation time, fixed adsorbate concentration at 30˚C. It is clear from this figure that the adsorption capacity of Hg (II) onto CECM increases by increasing the pH from 2 to 6. Under highly acidic conditions (pH 2) the adsorption od Hg (II) on CECM is the lowest because metal binding sites on the adsorbent were closely associated with H3O+ and restrict the approach of metal cations as a result of the repulsion forces. However, adsorption increased with increasing the pH of solution since the adsorbent surface could be exposed with negative charge with subsequent attraction with positive charge occurring onto the adsorbent surface. At a pH value higher than 6, the adsorption experiment could not be carried out due to precipitation of Hg (II) as Hg(OH)2.
3.1.2. Effect of Adsorbent Concentration
The effect of adsorbent concentration on adsorption capacity of Hg (II) by CECM is shown in Figure 2. The adsorption capacity (qe), or the amount of Hg (II) adsorbed per unit mass of adsorbent (mg/g), decreases by increasing the concentration of adsorbent. The decrease in adsorption capacity with increasing the adsorbent concentration is mainly due to overlapping of the adsorption sites as a result of overcrowding of the adsorbent particles and is also due to the competition among Hg (II) ions for the surface sites [14].
3.2. Effect of Extent of Modification
Table 1 shows the effect of % N of the CECM on their adsorption capacity of Hg (II) from contaminated water. Evidently, increasing the extent of modification is accomplished by an increase in the adsorption capacity of CECM. It is logical that the CECM with the higher extent of modification has more nitrogen content, which increases the adsorption ability toward Hg (II) through stronger complexation. Current data suggest that the carbamoyethyl groups introduced in the molecular structure of cellulose component of the CM via etherification reaction using acrylamide play a more effective role in the Hg (II) adsorption process than those in the unmodified CM as shown in Table 1.
3.3. Effect of Adsorbate Concentration
The equilibrium adsorption isotherm is fundamental
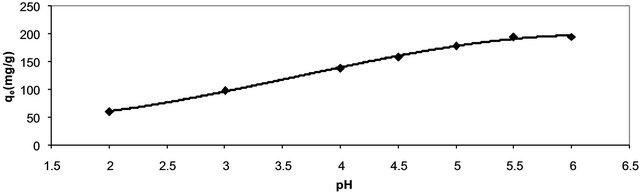
Figure 1. Effect of pH on adsorption capacity of Hg (II) onto CECM at 30˚C.
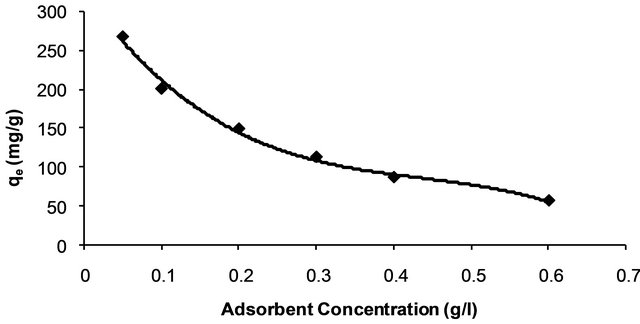
Figure 2. Effect of adsorbent concentration on adsorption capacity of Hg (II) onto CECM at 30˚C.
in describing the interactive behavior between solutes and adsorbent, and is important in the design of adsorption system. Figure 3 shows equilibrium distribution of Hg (II) ions between the liquid phase, Ce (mg/l) and solid phase, qe (mg/g). The equilibrium curve plateau indicates the maximum adsorption capacity of Hg (II) ions on CECM at 30˚C.
As shown in Figure 3 the adsorption capacity of Hg (II) onto CECM increases with the increasing concentration of adsorbate and approaches the equilibrium at higher concentration of the adsorbate. To simulate the adsorption isotherm, three models are commonly used, the Langmuir, Freundlich, and Temkin isotherms.
3.4. Langmuir Isotherm
Langmuir equation [18] was applied for adsorption equilibrium of Hg (II) ions by CECM. The assumption of this model is based on the maximum adsorption corresponds to a saturated monolayer of adsorbate molecules on the adsorbent surface and the energy of adsorption is constant as well as there is no transmigration of adsorbate in the plane surface. The linear form of Langmuir isotherm is given by the following equation:
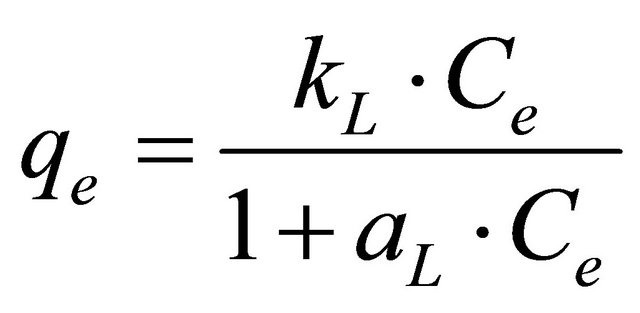 (5)
(5)
where, aL is Langmuir isotherm constant (l/mg), KL is the Langmuir constant (l/g) and aL/KL represents the adsorption capacity, Qmax. The linear equation of this model could be represented by:
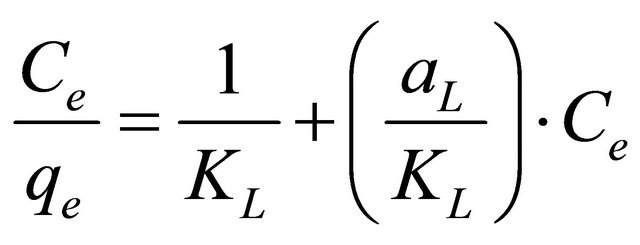 (6)
(6)
The linear plots (Figure 4) of Ce/qe vs Ce give straight lines with the slope aL/KL and intercept 1/KL. The Langmuir constants of adsorption of Hg (II) ions onto CECM are listed in Table 2. The equilibrium constant KL may be used to determine the enthalpy of adsorption, ∆H. The
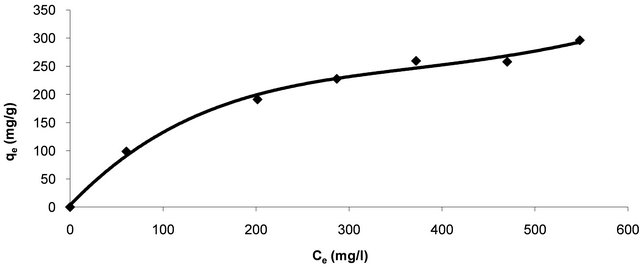
Figure 3. Equilibrium adsorption isotherm of Hg (II) onto CECM at 30˚C.
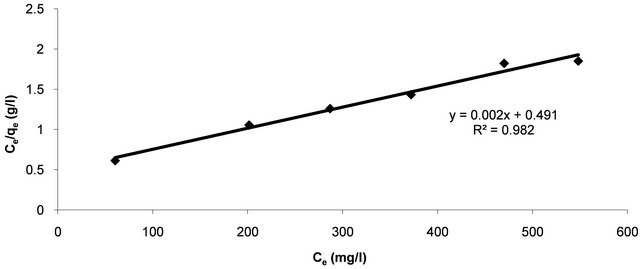
Figure 4. Langmuir adsorption plot of Hg (II) onto CECM at 30˚C.
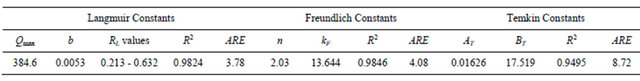
Table 2. Constants of adsorption models and the average relative error (ARE) for Hg (II) onto CECM at 30˚C.
relation between KL and Qmax is given by the following equation:
 (7)
(7)
where, b is related to the energy of adsorption (l/mg). The value of constant b and correlation coefficient, R2 are also listed in Table 2.
The essential features of Langmuir isotherm can be expressed in terms of a dimensionless constant separation factor or equilibrium parameter, RL, which expressed by the following equation:
 (8)
(8)
where Co is the initial concentration of Hg (II) and b is mentioned before. The RL value of Hg (II) onto CECM at 30˚C is given in Table 2. It has been reported that the effect of isotherm shape with a view to predicting if an adsorption system is favourable or unfavorable [19]. It is known that the value of RL < 1 represents favorable adsorption and value of RL > 1 represents unfavorable adsorption.
In our case the value of RL for initial Hg (II) concentrations in the range of 0.213 - 0.632 of was found to be (0 < RL < 1). This vale indicates that the adsorption is favorable. The values of the correlation coefficients, R2 of Langmuir plot was over 0.98 Hg (II) on CECM indicate that the adsorption of Hg (II) onto CECM is fitted well on the Langmuir isotherm (obey the Langmuir isotherm).
3.5. Freundlich Isotherm
The Freundlich equation [20] is employed to describe heterogeneous systems and reversible adsorption and is not restricted to the formation of monolayer. The adsorption data of Hg (II) is analyzed also by Freundlish model. The logarithmic form of Freundlich model is given by the following equation:
 (9)
(9)
where, qe is the equilibrium concentration mercury on CECM (mg/g), Ce the equilibrium concentration of mercury in solution (mg/l) and KF (mg/g) and n are the Freundlich constants characteristic of the system, indicators of adsorption capacity and adsorption intensity, respectively. The linear form of Freundlich equation is:
 (10)
(10)
where qe is the amount of Hg (II) ions adsorbed per unit mass of adsorbent (mg/g), Ce is the equilibrium concentration of Hg (II) ions, mg/l. Linear plots of log qe vs log Ce at at 30˚C (Figure 5) suggest the applicability of adsorption process of Hg (II) onto CECM on Freundlich isotherm. The values of KF and n were evaluated from the intercept and the slope of the plot and their numerical values are listed in Table 2. The n value gives an indication to favorability of adsorption. The values of n was 2.03 at 30˚C (0 < n < 10) showing that the adsorption of Hg (II) ions onto CECM is favourable. The correlation coefficient, R2 value (Table 2) of Hg (II) by CECM was over 0.98 indicating that the adsorption of Hg (II) ions on CECM is fitted well also on Freundlish isotherm (obey the Freundlish isotherm).
3.6. Temkin Isotherm
The Temkin isotherm [21] has been used in the following form:
 (11)
(11)
where R is the universal gas constant (8.31441 J−1∙mol−1∙K−1), T is the absolute temperature (K), AT is the Temkin isotherm constant (g/mg) and bT is Temkin constant. The sorption data were analyzed according to the linear form of the Temkin isotherm as:
 (12)
(12)
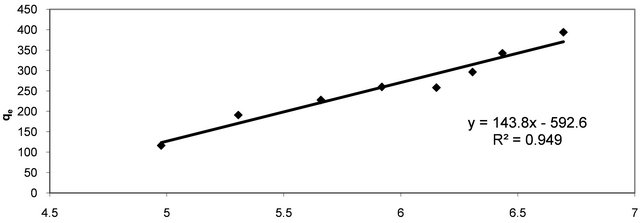
Linear plots of qe vs lnCe at 30˚C (Figure 6) suggest the applicability of adsorption process of Hg (II) onto CECM on Temkin isotherm. The values of AT and bT were evaluated from the intercept and the slope of the plot and their numerical values along with R2 are listed in Table 2. R2 value of Hg (II) by CECM was over 0.94 indicating that the adsorption of Hg (II) ions on CECM is fitted well also on Temkin isotherm (obey the Temkin isotherm).
The comparison between the experimental data and the theoretical data obtained from isotherm models of Hg (II) onto CECM are shown in Figure 7 and Table 2 which illustrates that the Langmuir isotherm fitted the experi-
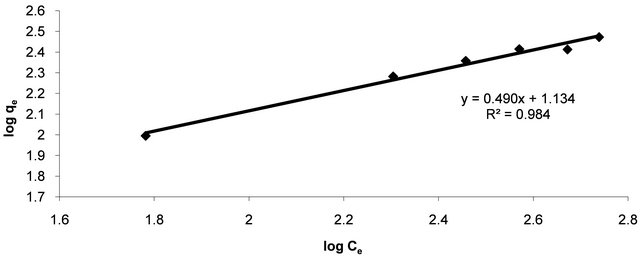
Figure 5. Freundlich adsorption plot of Hg (II) onto CECM at 30˚C.
 lnCe
lnCe
Figure 6. Temkin adsorption plot of Hg (II) onto CECM at 30˚C.
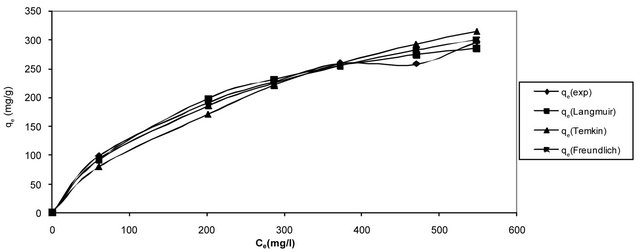
Figure 7. Comparison between different isotherm models of Hg (II) onto CECM at 30˚C.
mental data better than other isotherms.
3.7. Error Analysis
The use of R2 is limited to solve linear forms of isotherm equation, which measures the difference between experimental and theoretical data in linearized plots only, but not the errors in non-linear form of isotherm curved. For this reason we use average relative error (ARE) to determine the best fit in isotherm models. For all isotherm models, the value of ARE for adsorption of Hg (II) onto CECM are calculated and presented in Table 2. The most obvious conclusions from these results are that the Langmuir isotherm model has the lowest values for ARE and therefore fits the data better than the rest of isotherm models.
3.8. Effect of Initial Metal Concentration and Contact Time
Figure 8 shows the effect of agitation time on adsorption capacity of Hg (II) onto CECM by using the concentration of 400 and 500 mg/l at fixed adsorbent concentration and at 30˚C. The amount of Hg (II) adsorbed (mg/g) increases with the increase in agitation time and reached the equilibrium after 20 min for both Hg (II) concentrations. It is clear that the adsorption capacity depends on the concentration of the Hg (II) ions. The adsorption
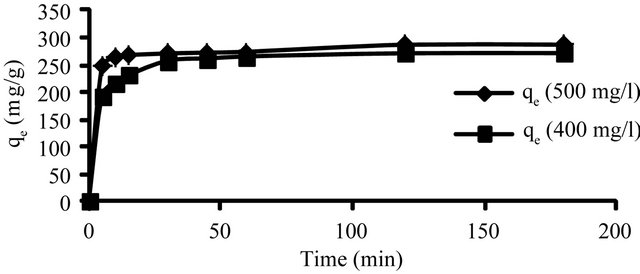
Figure 8. Effect of contact time and initial concentration on adsorption capacity of Hg (II) CECM at 30˚C.
curves are singles and continuous leading to saturation.
3.9. Adsorption Kinetics
3.9.1. Pseudo-First-Order Model
The pseudo-first-order equation [22] is:
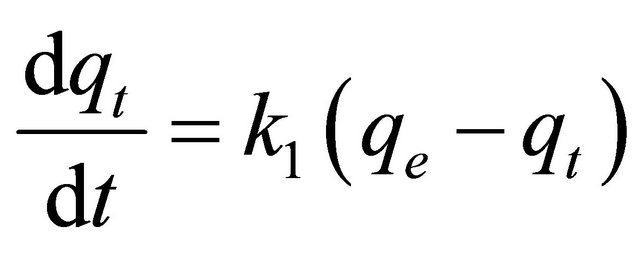 (13)
(13)
where qt is the amount of adsorbate adsorbed at time t (mg/g), qe is the adsorption capacity at equilibrium (mg/g), k is the pseudo-first-order rate constant (min−1), and t is the contact time (min). The integration of Equation (13) with the initial condition, qt = 0 at t = 0, the following equation is obtained:
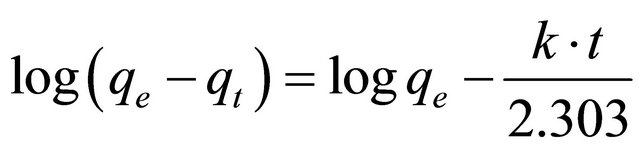 (14)
(14)
In order to obtain the rate constants, the straight line plots of log(qe − qt) against t for Hg (II) onto CACM have been tested. The intercept of this plot should give logqe. However, if the intercept does not equal to the equilibrium uptake of metal ions, the reaction is not likely to be first order even if this plot has high correlation coefficient (R2) with the experimental data [23]. For the data obtained in the present study, the plots of log (qe – qt) versus t as required by Equation (13) for the adsorption of Hg (II) ions at initial concentrations of 400, and 500 mg/l by CECM (figure not show) gave correlation coefficients, R2, which had low values for the two plots concerned. This indicates that the adsorption of Hg (II) onto CECM is not acceptable for this model.
3.9.2. Pseudo-Second-Order Model
The pseudo-second-order model [24] is represented as:
 (15)
(15)
where k2 is the pseudo-second-order rate constant (g/mg∙min). Integrating Equation (15) with the initial condition, qt = 0 at t = 0, the following equation is obtained:
 (16)
(16)
where, k2 is the pseudo-second-order adsorption rate constant. This equation predicts that if the system follows pseudo-second-order kinetics, the plot of t/qe versus t should be linear. Plotting the experimental data obtained for the adsorption Hg (II) ions at initial concentrations of 400 and 500 mg/l onto CECM according to the relationship given in Equation (16) gave linear plots with correlation coefficients, R2, of 0.9999 and 0.9998 for Hg (II) concentrations of 400 and 500 mg/l, respectively, as shown in Figure 9 and listed in Table 3, thereby indicating the applicability of the pseudo-second-order kinetic equation to the experimental data. The experimental and calculated adsorption capacities for the two Hg (II) concentrations as well as the values of k2, and R2 are also presented in Table 3. The first-order and pseudo-secondorder models cannot identify the diffusion mechanism and the kinetic results were then subjected to analyze by the intra-particle diffusion model.
3.10. Intra-Particle Diffusion
The intra-particle diffusion model [25] can be expressed by the following equation:
 (17)
(17)
where, kp is the intra-particle diffusion rate constant (mg∙g−1∙min−1/2) and qt is the amount of solute adsorbed per unit mass of adsorbent. The data of solid phase metal concentration against time t at the initial concentrations of 400 and 500 mg/l of Hg (II) were further processed for testing the rate of diffusion in the adsorption process. Adsorption process incorporates the transport of adsorbate from the bulk solution to the interior surface of the pores in CECM. The rate parameter for intra-particle diffusion, kp for the two concentrations of Hg (II) are measured according to Equation (17). The plots of qt versus t1/2 for the concentrations of 400 and 500 mg/l of Hg (II) are shown in Figure 10. The plots for two concentrations of metal ions have the same features, the initial portion (curved) followed by linear portion and plateau. The initial curved portion is attributed to the bulk diffusion and the linear portion to the intra-particle diffusion, while the plateau corresponding to equilibrium. The deviation of straight lines from the origin (Figure 11) may be because of the difference between the rate of mass transfer in the initial and final stages of adsorption. Further, such deviation of straight line from the origin indicates that the pore diffusion is not the rate-controlling step [26]. The values of kp (mg∙g−1∙min−1) obtained from the slope of the straight lines (Figure 11) are listed in
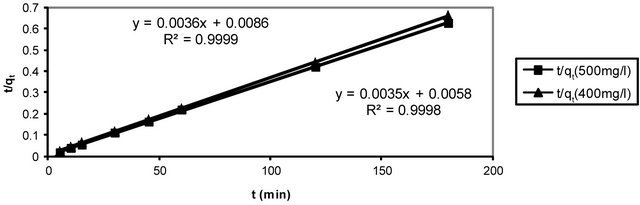
Figure 9. Pseudo-second order reaction of Hg (II) onto CECM using different adsorbate concentrations at 30˚C.
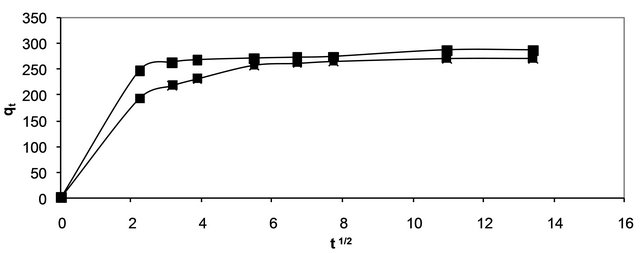
Figure 10. Intra-particle diffusion of Hg (II) onto CECM using two different adsorbate concentrations at 30˚C.
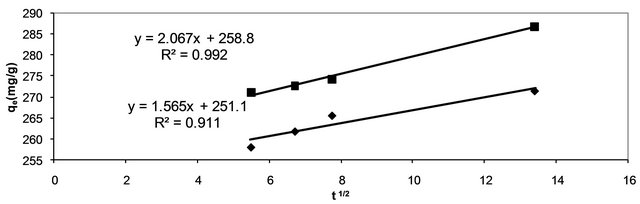
Figure 11. Test of intra-particle diffusion of Hg (II) onto CECM using two different adsorbate concentrations at 30˚C.
Table 3. Kinetic parameters for adsorption of Hg (II) onto CECM at 30˚C.
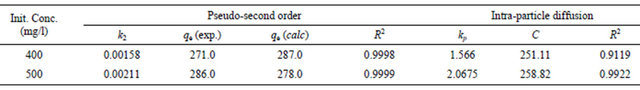
Table 3. The values of R2 for the two plots are listed also in Table 3. These values indicate that the adsorption of Hg (II) onto CECM may be follow the intra-particle diffusion mechanism. The values of intercept, C (Table 3) give an idea about the boundary layer thickness, i.e., the larger the intercept, is the greater the boundary layer effect [27].
3.11. Mechanism of Adsorption
The CECM can be considered to be microporous biopolymer; therefore, pores are large enough to let Hg (II) ions through. The mechanism of Hg (II) adsorption on porous adsorbents may involve four steps: 1) diffusion of ions to the external surface of the adsorbent; 2) diffusion of ions into the pores of the adsorbent; 3) adsorption of the ions on the internal surface of the adsorbent; 4) chelation between the electron donating nature of Oand N-containing groups in the CECM and the electronaccepting nature in the Hg (II) as shown in Scheme 1.
4. Conclusion
Cornulaca monacantha (CM) a desert plant has been utilized as adsorbent material for the removal of Hg (II) ions from contaminated water after treatment with acry-
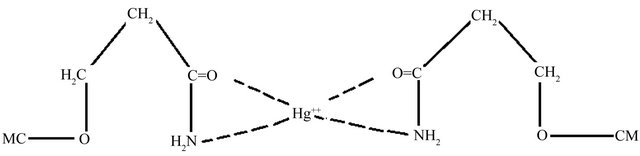
Scheme 1. Schematic presentation of proposed complex structure between CECM and Hg (II) ions.
lamide in alkaline medium to form carbamoylethylated Cornulaca monacantha (CECM). Three levels of CECM having different nitrogen content were prepared. The CECM samples were characterized by estimating the nitrogen content. The ability of CECM to adsorb Hg (II) was investigated by using batch adsorption procedure. The data of the adsorption isotherm was tested by the Langmuir, Freundlich and Temkin models. The removal of Hg (II) onto CECM particles could be well described by the pseudo-second order model. The adsorption rate of mercury was affected by the initial Hg (II) ion concentration, initial pH, adsorbent concentration and agitation time as well as extent of modification. The adsorption experiments indicated that the CECM particles have great potential for the removal of Hg (II) from contaminated water. The maximum adsorption capacity, Qmax of the CECM towards Hg (II) ions was found to be 384.6 mg/g at 30˚C. Similarly, the Freundlich constant, n was found to be 2.03 at 30˚C.
REFERENCES
- S. E. Manaham, “Environmental Chemistry,” 7th Edition, CRC Press, Boca Raton, 2000.
- M. H. Yu, “Environmental Toxicology—Biological and Health Effects of Pollutants,” 2nd Edition, CRC Press, Boca Raton, 2005.
- A. Hashem, A. M. Azzeer and A. Ayoub, “Removal of Hg (II) Ions from Laboratory Wastewater onto Phosphorylated Haloxylon Ammodendron: Kinetic and Equilibrium Studies Polymer-Plastics,” Technology and Engineering, Vol. 49, No. 14, 2010, pp. 1395-1391.
- O. J. Esalah, M. E. Weber and J. H. Vera, “Removal of Lead, Cadmium and Zinc from Aqueous Solutions by Precipitation with Sodium Di-(n-octyl) Phosphinate,” The Canadian Journal of Chemical Engineering, Vol. 78, No. 5, 2000, pp. 948-954. doi:10.1002/cjce.5450780512
- A. I. Zouboulis, K. A. Matis, B. G. Lanara and C. L. Neskovic, “Removal of Cadmium from Dilute Solutions by Hydroxyapatite. II. Floatation Studies,” Separation Science and Technology, Vol. 32, No. 10, 1997, pp. 1755- 1767. doi:10.1080/01496399708000733
- V. Ravindran, M. R. Stevens, B. N. Badriyha and M. Pirbazari, “Modeling the Sorption of Toxic Metals on Chelant-Impregnated Adsorbent,” AIChE Journal, Vol. 45, No. 5, 1999, pp. 1135-1146. doi:10.1002/aic.690450520
- C. A. Toles and W. E. Marshall, “Copper Ion Removal by Almond Shell Carbons and Commercial Carbons: Batch and Column Studies,” Separation Science and Technology, Vol. 37, No. 10, 2002, pp. 2369-2383. doi:10.1081/SS-120003518
- L. Canet, M. Ilpide and P. Seta, “Efficient Facilitated Transport of Lead, Cadmium, Zinc and Silver across a Flat Sheet-Supported Liquid Membrane Mediated by Lasalocid A,” Separation Science and Technology, Vol. 37, No. 8, 2002, pp. 1851-1860. doi:10.1081/SS-120003047
- M. M. Nassar and M. S. El-Geundi, “Comparative Cost of Color Removal from Textile Effluents Using Natural Adsorbents,” Journal of Chemical Technology & Biotechnology, Vol. 50, No. 2, 1991, pp. 257-264. doi:10.1002/jctb.280500210
- G. McKay, “Adsorption of Dyestuffs from Aqueous Solutions with Activated Carbon, Part I: Equilibrium and Batch Contact-Time Studies,” Journal of Chemical Technology & Biotechnology, Vol. 32, No. 7-12, 1982, pp. 773- 780. doi:10.1002/jctb.5030320713
- A. Hashem and K. A. El-Kheraije, “Biosorption of Pb (II) onto Anethum graveolens from Contaminated Wastewater: Equilibrium and Kinetic Studies,” Journal of Environmental Protection, Vol. 4, No. 1, 2013, pp. 108-119.
- A. Hashem, H. A. Hussein, M. A. Sanousy, E. Adam and E. E. Saad, “Modified Monomethylolated Thiourea— Sawdust as a New Adsorbent for Removal of Hg (II) from Contaminated Water: Equilibrium Kinetic and Thermodynamic Studies,” Polymer Plastics Technology and Engineering, Vol. 50, No. 12, 2011, pp. 1220-1230. doi:10.1080/03602559.2011.566301
- A. Al Othman Zeid, M. A. Habila and A. Hashem, “Removal of Zinc (II) from Aqueous Solutions Using Modified Agricultural Wastes: Kinetics and Equilibrium Studies,” Arabian Journal of Geosciences, Vol. 5, 2012, pp. 1- 10.
- A. A. Khalil, H. H. Sokker, A. Al-Anwar, A. Abd ElZaher and A. Hashem, “Preparation, Characterization and Utilization of Amidoximated Poly (AN/MAA)-Grafted Alhagi Residues for the Removal of Zn (II) from Aqueous Solution,” Adsorption Science& Technology, Vol. 27, No. 4, 2009, pp. 363-382. doi:10.1260/026361709790252669
- A. Ragheb, R. Refai, I. Abd El-Thalouth and A. Hebeish, “The Combined Effect of Oxidation and Carbamoylethylation on the Rheological Properties of Maize and Rice Starches,” Starch, Vol. 42, No. 11, 1990, pp. 420-426. doi:10.1002/star.19900421104
- A. I. Vogel, “A Textbook of Quantitative Inorganic Analysis including Elementary Instrumental Analysis,” 3rd Edition, Longman Group Ltd., London, 1972, pp. 402-404.
- S. C. Tsai and K. W. Juang, “Comparison of Linear and Non-Linear Forms of Isotherm Models for Strontium Sorption on a Sodium Bentonite,” Journal of Radioanalytical and Nuclear Chemistry, Vol. 243, No. 3, 2000, pp. 741-746. doi:10.1023/A:1010694910170
- I. Langmuir, “The Constitution and Fundamental Properties of Solids and Liquids,” Journal of the American Chemical Society, Vol. 38, No. 11, 1916, pp. 2221-2295. doi:10.1021/ja02268a002
- K. R. Hall, L. C. Eagleton, A. Acrivos and T. Vermevlem, “Pore and Solid Diffusion Kinetics in Fixed Bed Adsorption under Constant Pattern Conditions,” Industrial and Engineering Chemistry Fundamentals, Vol. 5, No. 2, 1966, pp. 212-223. doi:10.1021/i160018a011
- H. Freundlish, “Over the Adsorption in Solution,” The Journal of Physical Chemistry, Vol. 57, 1906, pp. 385- 470.
- M. J. Tempkin and V. Pyzhev, “Kinetics of Ammonia Synthesis on Promoted Iron Catalysts,” Acta Physiochim, URSS, Vol. 12, 1940, pp. 217-222.
- H. C. Trivedi, V. M. Patel and R. D. Patel, “Adsorption of Cellulose Triacetate on Calcium Silicate,” European Polymer Journal, Vol. 9, No. 6, 1973, pp. 525-533. doi:10.1016/0014-3057(73)90036-0
- Y. S. Hoand G. McKay, “Sorption of Dye from Aqueous Solution by Peat,” Chemical Engineering Journal, Vol. 70, No. 2, 1998, pp. 115-124.
- Y. S. Ho and G. McKeay, “The Kinetics of Sorption of Divalent Metal Ions onto Sphagnum Moss Peat,” Water Research, Vol. 34, No. 3, 2000, pp. 735-742. doi:10.1016/S0043-1354(99)00232-8
- W. J. Weber and C. J. Morris, “Advances in Water Pollution Research,” Proceedings of 1st International Conference on Water Pollution Research, Vol. 2, 1962, p. 231.
- V. J. P. Poots, G. McKay and J. J. Healy, “Removal of Basic Dye from Effluent Using Wood as an Adsorbent,” Journal (Water Pollution Control Federation), Vol. 50, No. 5, 1978, pp. 926-939.
- K. Nagarethinam and M. S. Mariappan, “Kinetics and Mechanism of Removal of Methylene Blue by Adsorption on Various Carbons—A Comparative Study,” Dyes and Pigments, Vol. 51, No. 1, 2001, pp. 25-40. doi:10.1016/S0143-7208(01)00056-0
Nomenclature
CM: Cornulaca monacantha CECM: cyanoethylated Cornulaca monacantha N%: nitrogen content of CM and CECM samples C0: metal concentration in liquid phase at the initial time, mg/l Ce: metal concentration in liquid phase at equilibrium, mg/l qe: adsorption capacity at equilibrium W: weight of adsorbent, g qt: amount of metal adsorbed per unit mass of adsorbent Ct: metal concentration in liquid phase at time t, mg/l KL: Langmuir isotherm constant, l/g Qmax: maximum adsorption capacity, mg/g b: Langmuir constant related to the energy of adsorption RL: equilibrium parameter KF: adsorption capacity of Freundlich model n: adsorption intensity R: universal gas constant, 8.31441 J−1∙Mol−1∙K−1
T: absolute temperature, K AT: Temkin isotherm constant, g/mg bT: Temkin constant R2: correlation coefficient ARE: average relative error k2: rate constant of the pseudo-second-order model, t−1∙g∙mg−1
kp: intra-particle diffusion rate constant, mg∙g−1∙min−1/2
C: value of intercept of intra-particle diffusion model
NOTES
*Corresponding author.