Atmospheric and Climate Sciences
Vol.3 No.1(2013), Article ID:27571,6 pages DOI:10.4236/acs.2013.31008
MODIS-Derived Arctic Land-Surface Temperature Trends
Geophysical Institute, University of Alaska Fairbanks, Fairbanks, USA
Email: reginald.muskett@gmail.com
Received September 19, 2012; revised October 21, 2012; accepted October 30, 2012
Keywords: MODIS; Aqua; Terra; Land-Surface; Temperature; Trends; Arctic
ABSTRACT
Across the Arctic changes in active layer, melting of glaciers and ground ice, thawing of permafrost and sequestration changes of carbon storage are driven in part by variations of land surface heat absorption, conduction and re-radiation relative to solar irradiance. We investigate Arctic land-surface temperature changes and regional variations derived by the MODIS sensors on NASA Aqua and Terra from March 2000 through July 2012. Over this decadal period we detect increase in the number of days with daytime land-surface temperature above 0˚C. There are indications of increasing trends of land-surface temperature change. Regional variations of the changes in land-surface temperature likely arise due to surface material types and topography relative to the daytime variation of solar irradiance.
1. Introduction
The ongoing NASA Earth Observation System (EOS) is conceived by the successes of NASA and international Earth observing satellite missions up to the early 1990’s [1,2]. EOS consists of science segments, data processing and archiving systems and space segments, growing and evolving since fiscal year 1991 within the NASA EarthSun Exploration Division. A fundamental guiding question for EOS is, “How is the Earth changing and what are the consequences for life on Earth?”
Land-surface temperature is a key parameter of landsurface physics and processes at local and up to global scales [2]. It is the consequence of direct and indirect energy fluxes of the sun and atmosphere with the ground. Hence it is a vital parameter for the changes in biogeochemical cycles, ecosystems, energy-heat-mass budgets and cycles, meteorology and climate across the spectrum of temporal scales from the diurnal to multidecadal and longer.
Across the Arctic a unique variety of land-surfaces are present [3]. These include the snow fields and glacier ice of the Greenland Icesheet and ice caps of the Canadian high north, tundra landscapes, summertime wetlands— peatlands, thaw lake districts, the northern continuous permafrost zone and its summertime thaw-layer (the active layer), lowland-upland ecosystems and river basins feeding freshwater to the Arctic Ocean.
Recent investigations have turned to address the vulnerability of carbon and associated biological sequestration and release of old-carbon from carbon-ice rich permafrost [4,5]. The change of land-surface temperature is a key physics constraint and parameter in the changes of land-carbon storage [6].
In this research we investigate land-surface temperature and its changes across the Arctic derived by the Moderate Resolution Imaging Spectroradiometer (MODIS) on the NASA Terra and Aqua satellites from year 2000 through 2012 (Figure 1). This being the first complete decade of MODIS operations we explore the changes and trends of Arctic land-surface temperature.
2. MODIS Terra and Aqua Data
The NASA Terra satellite was launched in December 1999 [7]. It is a satellite of the NASA EOS program [8]. NASA EOS satellites Terra and Aqua carry the MODIS Proto-Flight Model (PFM) and Flight Model 1 (FM1), respectively. Terra orbits in a near polar 98˚ sun-synchronous “morning phase” orbit with a local equator crossing, 705 km altitude, at 10:30 hours local time in the descending mode [7]. In May 2002 NASA launched the EOS Aqua satellite. The Aqua orbit mirrors Terra in near polar sun-synchronous “afternoon phase” with a local equator crossing at 13:30 hours local time in the ascending mode [7]. Both Aqua and Terra orbits are with respect to the Worldwide Reference System 2 grid [8].
EOS Aqua is the long-term member satellite of the NASA “A-Train” constellation [9]. The A-Train includes NASA Aura, CALIPSO, CloudSat and Glory in addition to CNES Parasol and JAXA GCOM-W1 satellites. Orbit corrections are performed routinely to maintain “orbit-station” and temporal synchronization [8]. Aqua and Terra MODIS sensor pointing accuracy and on-orbit calibrations
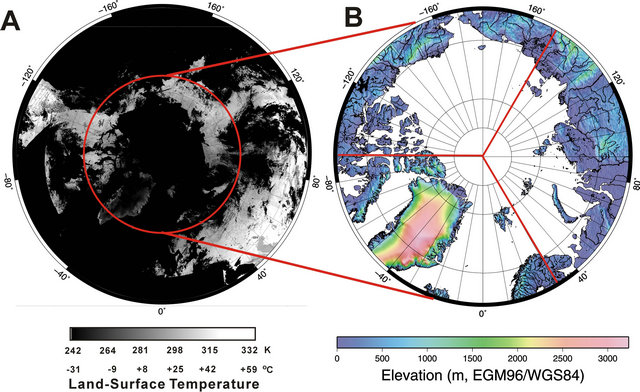
Figure 1. MODIS land-surface temperature and regions of interest: (A) MODIS-Terra 22 July 2004 with 65˚N region and (B) 65˚N ACE2 DEM. Regions of interest for land-surface temperature change are represented by the 65˚N red circle A and the 120˚ sector regions B.
are performed monthly [10].
The MODIS land-surface temperature (Kelvin) retrieval algorithm uses clear-sky day/night thermal emission and emissivity in the 10.78 to 11.28 μm and 11.77 to 12.27 μm bands [11]. L1B Level 2 swath product using cloudcover detection routines with corrections for atmosphere column water vapor and boundary level temperatures and off-zenith-angle pointing are the input data source.
MOD11A1 (Terra) and MYD11AI (Aqua) Level-3 Version 5 datasets are in HDF-EOS format and data structure. The kelvin data layer is a 5-by-5 degree granule at 1-km posting sinusoidal grid [12]. We extract daytime (AM and PM) temperatures with the highest quality flag (most reliable) beginning on 5 March 2000 (Terra) and 8 July 2002 (Aqua). Accuracy of the retrieval landsurface temperature is at 1-kelvin level [13,14]. Diurnal-average trends of MODIS land-surface temperatures with near-ground air temperatures and shallow sub-surface soil temperatures show consistent and high correlation [15].
We process the northern hemisphere 5-by-5 degree granule grids at 1-km posting into daily AM daytime morning and PM daytime afternoon mosaics. We reproject the daily mosaics using the World Geodetic System reference ellipsoid WGS-84 to be consistent with the International Terrestrial Reference Frame.
3. Results
To explore trends from the MODIS land-surface temperature we use areas of interest covering the 65˚N and high latitudes (Arctic), and three 120˚ azimuth sectors for Eurasia, Western North American-Eastern Russia and Eastern North America-Northwestern Europe (Figure 1). In these regions we extract the daily daytime morning and afternoon temperatures at 1-km spacing and compose time series at daily and monthly intervals through March 2010 (Terra) and July 2012 (Aqua). The results are illustrated in Figure 2 through 5 and summarized in Tables 1 and 2.
3.1. Decadal Period Daily Comparisons
Figure 2 and Table 1 show decadal comparisons of daily morning land-surface temperatures from March 2000 through March 2010 from MODIS-Terra. The Arctic region Figure 2(A) shows 2010 land-surface temperatures are increase relative to 2000 land-surface temperatures by 2.1˚C ± 0.2˚C on average with uncertainty. The P-Value (ANOVA) of the increase is 0.01 indicating high significance. The correlation has an R-Square value of 0.97.
On a sector basis regional Arctic morning land-surface temperature show spatial variation. Arctic Eurasia shows an increase of 1.7˚C ± 0.3˚C on average with uncertainty, P-Value of 0.01 and R-Square value of 0.93, Figure 2(B). Arctic western North America shows an increase of 1.9˚C ± 0.2˚C on average with uncertainty, P-Value of 0.01 and R-Square value of 0.95, Figure 2(C). Arctic eastern North America-Western Europe shows an increase of 2.5˚C ± 0.3˚C on average with uncertainty, P-Value of 0.01 and R-Square value of 0.85, Figure 2(D).
Figure 3 and Table 2 show decadal comparisons of daily afternoon land-surface temperatures from July 2002 through July 2012 from MODIS-Aqua. The Arctic region Figure 3(A) shows 2012 land-surface temperatures are increase relative to 2000 land-surface temperatures by 0.1˚C ± 0.2˚C on average with uncertainty. The P-Value
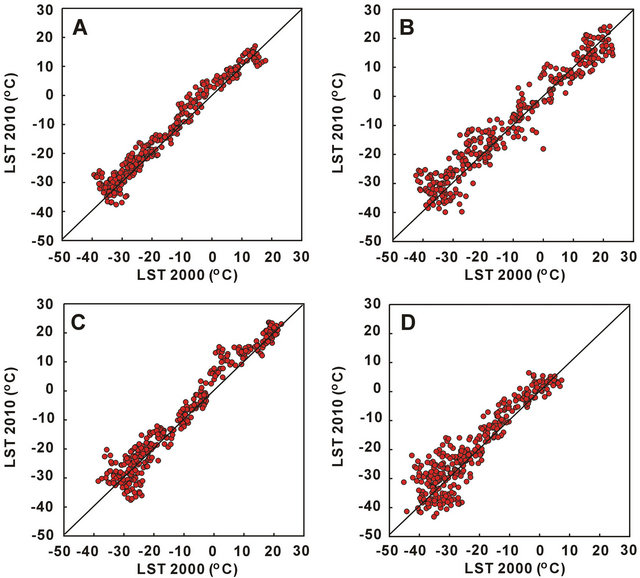
Figure 2. Comparison plots of MODIS-Terra land-surface temperatures in the regions of interest, year 2000 through 2010: (A) 65˚N; (B) Eurasia; (C) Western North America and (D) Eastern North America and Western Europe.
Table 1. Arctic MODIS-derived decadal land-surface temperature change trends.

*120˚ azimuth sectors of the Arctic. PV = P-Value (ANOVA).
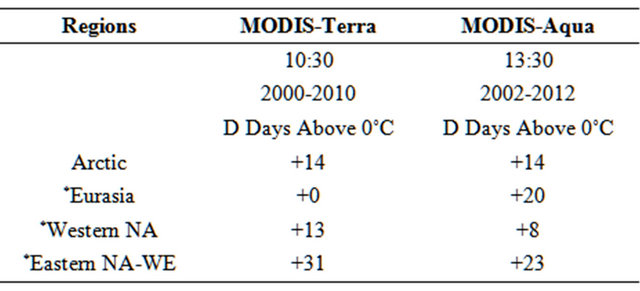
Table 2. Arctic MODIS-derived decadal change of days above 0˚C.
*120˚ azimuth sectors of the Arctic. PV = P-Value (ANOVA).
(ANOVA) of the increase is 0.01 indicating high significance. The correlation has an R-Square value of 0.97.
Using the same sector basis regional Arctic afternoon land-surface temperatures show spatial variation that is difference than morning land-surface temperatures. Arctic Eurasia shows an increase of 2.8˚C ± 0.3˚C on average with uncertainty, P-Value of 0.01 and R-Square
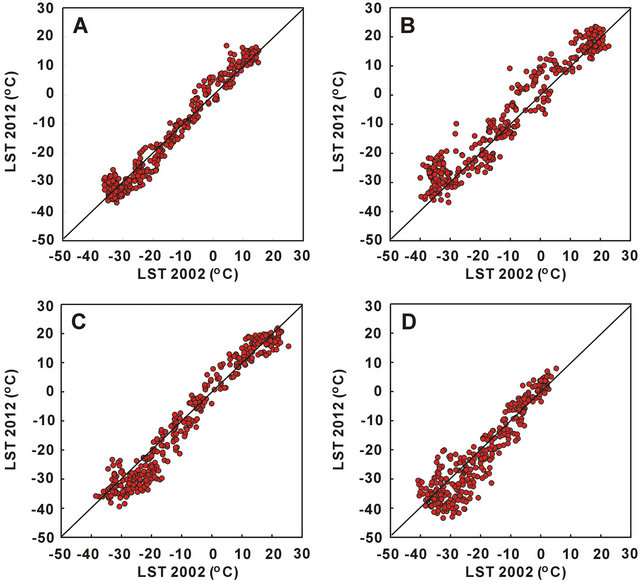
Figure 3. Comparison plots of MODIS-Aqua land-surface temperatures in the regions of interest, year 2002 through 2012: (A) 65˚N; (B) Eurasia; (C) Western North America and (D) Eastern North America and Western Europe.
value of 0.93, Figure 3(B). Arctic western North America shows a decrease of 1.5˚C ± 0.2˚C on average with uncertainty, P-Value of 0.01 and R-Square value of 0.95, Figure 3(C). Arctic eastern North America-Western Europe shows a decrease of 1.5˚C ± 0.3˚C on average with uncertainty, P-Value of 0.01 and R-Square value of 0.87, Figure 3(D).
Figure 4 shows the Arctic daily morning (A) and afternoon (B) land-surface temperature change over the decadal periods of MODIS-Terra and MODIS-Aqua, respectively. Non-stationarity of the daily morning and afternoon land-surface temperature changes is evident. More land-surface temperature decreases occur during afternoon than during morning.
On a daily basis we take account of the number of days with land-surface temperature above 0˚C. Within the Arctic over the decadal periods of MODIS-Terra and MODIS-Aqua the number of days with morning and afternoon land-surface temperature above 0˚C is increase by 14.
On a sector basis there is variation of days of morning and afternoon land-surface temperature above 0˚C over the decadal period. Arctic Eurasia mornings have no increase of days above 0˚C whereas afternoons show an increase of 20 days above 0˚C. Arctic western North America mornings show an increase of 13 days above 0˚C whereas afternoons show an increase of 8 days above 0˚C. Arctic eastern North America-Western Europe mornings show an increase of 31 days above 0˚C whereas afternoons show an increase of 23 days above 0˚C. Note that the afternoon land-surface temperature change decade form MODIS-Aqua extends two years after the morning
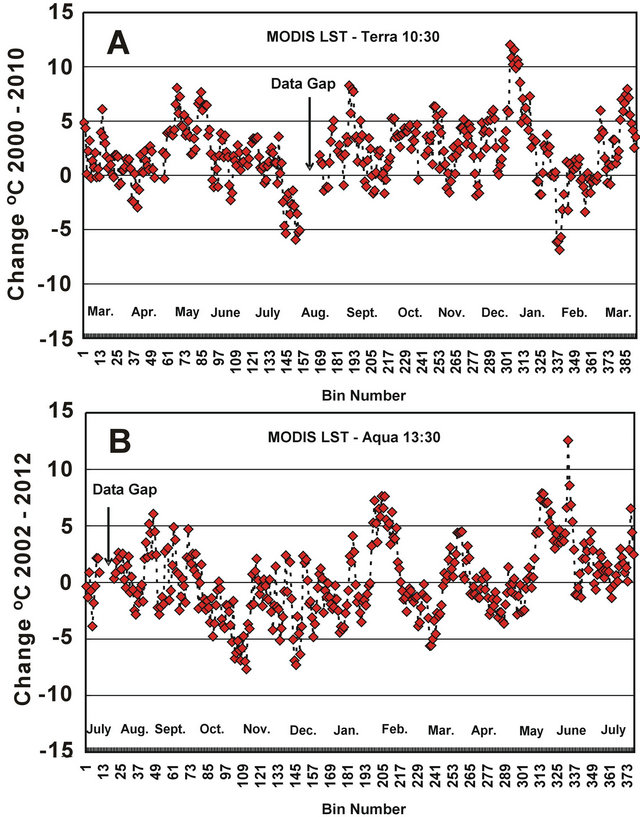
Figure 4. Change of land-surface temperature above 65˚N: (A) MODIS-Terra relative 10:30 and (B) MODIS-Aqua relative 13:30 local equator crossing times. Note: (A) that the beginning series March is from 2000 through 2010 and the ending series March is from 2001 through 2011 and (B) that the beginning series July is from year 2002 through year 2011 and the ending series July is from year 2003 through 2012.
land-surface temperature decade from MODIS-Terra.
3.2. Decadal Period Monthly Changes
From the Arctic daily morning and afternoon land-surface temperatures we compose monthly changes over the decadal periods of MODIS-Terra and MODIS-Aqua, Figure 5. Morning monthly mean land-surface temperature change (Figure 5(A)) shows increase is largest during January and May decrease in largest during February and August. The magnitude of the land-surface temperature increase is larger than decrease by up to a factor of four. Moreover, March monthly mean land-surface temperature shows a decadal increase, i.e. a trend.
Afternoon monthly mean land-surface temperature change (Figure 5(B)) shows decrease is largest during November and increase is largest during June. Seven months show decrease and six months show increase. The magnitude of the November decrease is less than the magnitude of the June increase. July afternoon monthly mean land-surface temperature shows a decadal increase, i.e. a trend consistent with morning mean changes (Figure 5(A)).
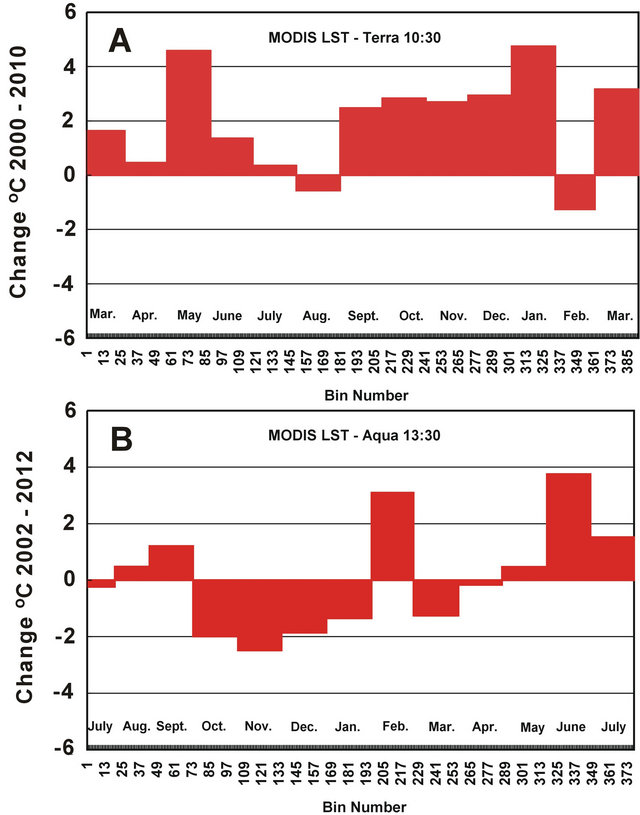
Figure 5. Change of land-surface monthly temperatures above 65˚N: (A) MODIS-Terra relative 10:30 and (B) MODISAqua relative 13:30 local equator crossing times. Note the decadal context of the months is the same as in Figure 4.
4. Discussion and Conclusion
Solar irradiance at the surface of the Earth is a fundamental driving parameter of climate, ecosystems, energywater cycles and meteorology [16,17]. Solar irradiance and activity varies diurnally, by latitude and seasonally (the solar zenith angle) [16]. Solar irradiance varies by solar physics operative on decadal (Schwabe Cycle), multi-decadal (Hale-Gleissberg Cycles) and century and longer periods (Suess/deVries-Hallstatt Cycles) [18-21].
At the surface of the Earth irradiance is direct (solar) and indirect (re-radiance) [19,20]. Re-radiance depends on surface properties, terrain elevation and geometry, and on atmosphere absorption, scattering and transmission by aerosols, chemical species such as those of carbon, hydrogen, nitrogen, and oxygen and their compounds such as carbon monoxide and dioxide, methane, water vapor and ice and ozone [16,22].
At local, regional hemisphere and global scales clouds play important roles in indirect irradiance at infrared wavelengths [16,19,20,23]. This is secondary in powermagnitude relative to direct solar irradiance at the ultraviolet through blue wavelengths.
5. Conclusions
Our investigation utilizes the MODIS sensors daytime acquisitions at local times of 10:30 NASA-Terra and 13:30 NASA-Aqua. For both satellite missions the operational periods are now extending beyond one decade. On this short period there are indications of trends of land-surface temperature, where we focus on the Arctic region. The Arctic is noteworthy for the historical observations of its cloud cover. Many important energy process feedbacks rely on albedo of atmosphere (clear sky), clouds and surface with respect to long-term changes referred to as global dimming and brightening that plays an important role in the surface energy budget.
During the first decade of MODIS land-surface temperature retrievals we detect increase of the number of days with land-surface temperature above 0˚C. This is an important constraint on physical processes affecting snowice-permafrost vulnerability, ecosystems and hydrology of the Arctic region. We detect significant trends of landsurface temperature changes during the first decade of daytime sun-synchronous 10:30 and 13:30 local equatorial crossing acquisitions from MODIS on Terra and Aqua satellites, respectively.
Furthermore we detect regional variations intrends of Arctic Eurasia, North America and Western Europe. These are dependent on surface material types and resident heat capacities. The Arctic regions are noteworthy for the high spatial density of tundra thaw lakes. Likely the variations in land-surface temperatures across Arctic Western North America and Arctic Eastern Eurasia are in part due to a summertime lake signal given the large heat capacity of water.
6. Acknowledgements
We thank the National Aeronautics and Space Administration Goddard Space Flight Center and the US Geological Survey Land Processes Distributed Active Archive Center for providing the MODIS datasets. R. R. Muskett thanks the University of Alaska Fairbanks Arctic Region Supercomputing Center for computational facilities assistance. R. R. Muskett thanks Prof. Vladimir E. Romanovsky, Geophysical Institute and the Scenarios Network for Alaska including the Arctic and Western Alaska Landscape Conservation Cooperatives and the USGS Alaska Climate Science Center for support. Generic Mapping Tools, ENVI/IDL and MATLAB were used. R. Muskett thanks Dr. Devin White (Oak Ridge National Laboratory Depart of Energy for the MODIS Conversion Tool (Exelis Visual Information Solutions), which was modified for this research.
REFERENCES
- H. Mannstein, “Surface Energy Budget, Surface Temperature and Thermal Inertia,” In: R. A. Vaughan and D. Reidel, Eds., Remote Sensing Applications in Meteorology and Climatology, NATO Science Series Catalog: Mathematical and Physical Sciences, Sci. Reidel Publishing Co., Dordrecht, 1987, pp. 391-410.
- Z. Wan, “MODIS Land-Surface Temperature Algorithm Theoretical Basis Document (LST ATBD),” National Aeronautics and Space US Department of Commerce, Washington, 1999.
- J. C. Rowland, C. E. Jones, G. Altmann, R. Bryan, B. T. Crosby, G. L. Geernaert, L. D. Hinzman, D. L. Kane, D. M. Lawrence, A. Mancino, P. Marsh, J. P. McNamara, V. E. Romanovsky, H. Toniolo, B. J. Travis, E. Trochim and C. J. Wilson, “Arctic Landscapes in Transition: Responses to Thawing Permafrost,” EOS Transactions of the American Geophysical Union, Vol. 91, No. 26, 2010, p. 229. doi:10.1029/2010EO260001
- M. T. Jorgenson, V. E. Romanovsky, J. Harden, Y. L. Shur, J. O’Donnell, T. Schuur and M. Kanevskiy, “2010: Resilience and Vulnerability of Permafrost to Climate Change,” Canadian Journal of Forest Research, Vol. 40, No. 4, 2010, pp. 1219-1236. doi:10.1139/X10-060
- G. Grosse, S. Marchenko, V. Romanovsky, K. P. Wickland, N. French, M. Waldrop, L. Bourgeau-Chavez, R. Striegl, J. Harden, M. Turetsky, A. D. McGuire, P. Camill, C. Tarnocai, S. Frolking, E. Schuur and T. Jorgenson, “Vulnerability of High Latitude Soil Organic Carbon in North America to Disturbance,” Journal Geophysical Research, Vol. 116, 2011, Article ID: G00K06. doi:10.1029/2010JG001507
- R. A. Houghton, E. A. Davidson and G. M. Woodwell, “Missing Sinks, Feedbacks, and Understanding the Role of Terrestrial Ecosystems in the Global Carbon Balance,” Global Biogeochemical Cycles, Vol. 12, No. 1, 1998, pp. 25-34. doi:10.1029/97GB02729
- X. X. Xiong, K. F. Chiang, A. S. Wu, W. L. Barnes, B. Guenther and V. V. Salomonson, “Multiyear On-Orbit Calibration and Performance of Terra MODIS Thermal Emissive Bands,” IEEE Transaction on Geoscience and Remote Sensing, Vol. 46, No. 6, 2008, pp. 1790-1803. doi:10.1109/TGRS.2008.916217
- C. L. Parkinson, A. Ward and M. D. King, “Earth Science Reference Handbook: A Guide to NASA’s Earth Science Program and Earth Observing Satellite Missions,” In: C. L. Parkinson, A. Ward and M. D. King, Eds., Earth Science Reference Handbook, National Aeronautics and Space Administration, US Department of Commerce, Washington, 2006, pp. 1-6, 73-88 and 225-227.
- T. S. L’Ecuyer and J. H. Jiang, “Touring the Atmosphere aboard the A-Train,” Physics Today, Vol. 63, No. 7, 2010, pp. 36-41.
- X. X. Xiong, J. Q. Sun and W. Barnes, “Intercomparison of On-Orbit Calibration Consistency between Terra and Aqua MODIS Reflective Solar Bands Using the Moon,” IEEE Geoscience and Remote Sensing Letters, Vol. 5, No. 4, 2008, pp. 778-782. doi:10.1109/LGRS.2008.2005591
- Z. Wan, “New Refinements and Validation of MODIS Land-Surface Temperature/Emissivity Products,” Remote Sensing Environment, Vol. 112, No. 1, 2008, pp. 59-74. doi:10.1016/j.rse.2006.06.026
- C. Coll, Z. Wan and G. M. Galve, “Temperature-Based and Radiance-Based Validations of the V5 MODIS Land Surface Temperature Product,” Journal Geophysical Research, Vol. 114, 2009, Article ID: D20102.
- W. Wang, S. Liang and T. Meyers, “Validating MODIS Land Surface Temperature Products Using Long-Term Nighttime Ground Measurements,” Remote Sensing Environment, Vol. 112, No. 3, 2008, pp. 623-635.
- D. K. Hall, J. E. Box, K. A. Casey, S. J. Hook, C. A. Shuman and K. Steffen, “Comparison of Satellite-Derived and In-Situ Observations of Ice and Snow Surface Temperatures over Greenland,” Remote Sensing Environment, Vol. 112, No. 10, 2008, pp. 3739-3749. doi:10.1016/j.rse.2008.05.007
- S. Hachem, C. R. Duguay and M. Allard, “Comparison of MODIS-Derived Land Surface Temperatures with NearSurface Soil and Air Temperature Measurements in the Continuous Permafrost Terrain,” The Cryosphere Discussion, Vol. 5, No. 3, 2011, pp. 1583-1625. doi:10.5194/tcd-5-1583-2011
- B. Weatherhead, A. Tanskanen and A. Stevermer, “Factors Affecting Surface Ultraviolet Radiation Levels in the Arctic,” In: C. J. Cleveland, Ed., Encyclopedia of Earth, International Arctic Science Committee, Environmental Information Coalition, National Council for Science and the Environment, Washington, 2010, pp. 1-17.
- I. G. Usoskin, “A History of Solar Activity over Millennia,” Living Reviews in Solar Physics, Vol. 5, No. 3, 2008, pp. 1-88. http://www.livingreviews.org/lrsp-2008-3
- F. R. Stephenson and A. W. Wolfendale, “Secular Solar and Geomagnetic Variations in the Last 10,000 Years,” In: F. R. Stephenson and A. W. Wolfendale, Eds., NATO ASI Series C, Mathematical and Physical Sciences, Kluwer Academic Publishers—Springer, New York, 1988.
- W.W.-H. Soon, “Solar Arctic-Mediated Climate Variation on Multidecadal to Centennial Timescales: Empirical Evidence, Mechanistic Explanations, and Testable Consequences,” Physical Geography, Vol. 30, No. 2, 2009, pp. 144-184. doi:10.2747/0272-3646.30.2.144
- W. W.-H. Soon, “Variable Solar Irradiance as a Plausible Agent for Multidecadal Variations in the Arctic-Wide Surface Air Temperature Record of the Past 130 Years,” Geophysical Research Letters, Vol. 32, No. 16, 2005, p. L16712. doi:10.1029/2005GL023429
- I. G. Usoskin, S. K. Solanki and G. A. Kovaltsov, “Grand Minima and Maxima of Solar Activity: New Observational Constraints,” Astronomy and Astrophysics, Vol. 471, No. 1, 2007, pp. 301-309. doi:10.1051/0004-6361:20077704
- N. Scafetta and B. J. West, “Phenomenological Solar Signature in 400 Years of Reconstructed Northern Hemisphere Temperature Record,” Geophysical Research Letters, Vol. 33, No. 17, 2006, p. L17718. doi:10.1029/2006GL027142
- B. A. Tinsley and F. Yu, “Atmospheric Ionization and Clouds as Links between Solar Activity and Climate,” In: M. Judit, R. Fox, C. Frohlich, H. S. Hudson, J. Kuhn, J. McCormack, G. North, W. Sprigg and S. T. Wu, Eds., Solar Variability and Its Effects on Climate, AGU Geophysical Monograph Series, American Geophysical Union, Washington, 2004, pp. 321-39.