Journal of Diabetes Mellitus
Vol. 2 No. 1 (2012) , Article ID: 17308 , 5 pages DOI:10.4236/jdm.2012.21008
Systemic thrombin generation by glucose
![]()
Institute of Laboratory Medicine and Pathobiochemistry, University Hospital of Marburg, Marburg, Germany; *Corresponding Author: morad8008@yahoo.com
Received 27 September 2011; revised 27 October 2011; accepted 14 November 2011
Keywords: Thrombin; Glucose; Intrinsic; Coagulation; Systemic F2a
ABSTRACT
Background: Systemic thrombin activity (F2a), i.e. thrombin protected and transported by (2- macroglobulin, is a new biomarker for the activation state of coagulation in vivo. F2a > 120% of normal diagnoses a pathologic disseminated intravascular coagulation (PIC) in humans, either acute or chronic. Since glucose triggers intrinsic coagulation, the present work aimed to quantify systemic thrombin generation induced by glucose in vivo in mice. Material and Methods: Balb/c mice were i.p. injected with different concentrations of glucose (0 - 0.3 mmoles). After 0 - 3 h EDTA-blood was withdrawn, centrifuged, and the plasma was stabilized 1 + 1 with 2.5 M arginine, pH 8.6, and analyzed for systemically circulating F2a (that is F2a·α2M). The F2a·α2M activity in mice without glucose injection was defined as 100% of murine norm. Results: 1 h after i.p. injection 0.1 - 0.3 mmoles glucose resulted in about 1.4 fold increase of plasmatic glucose and in about 2.5 fold increase of systemic F2a activity. At the 45 min time interval between i.p. injection of 0.038 mmoles glucose and blood withdrawing an approximately 1.5fold increase of plasma glucose caused a 4fold increase in systemic F2a. Discussion: When systemic F2a reaches 120% of the normal, the normal human intravascular coagulation (NIC) turns to the pre-phase of pathologic plasmatic intravascular coagulation (PIC-0 also defined as pre-PIC). At 150% systemic F2a, the PIC-0 changes to PIC-1 which is the common pathologic plasmatic intravascular coagulation (typical PIC). At 200% systemic F2a, PIC-1 changes to PIC-2 (consumption PIC). The present assay technique seems to be suitable in judging the coagulation activation state of any mammalian blood. Diabetic patients should be monitored for the new biomarker systemic F2a similarly as for the old biomarker glycated hemoglobin (HbA1c). The target systemic F2a range should be NIC, preferably around 100% of normal.
1. INTRODUCTION
Thrombin is an important serine protease of human blood that cleaves substrates after basic residues, mainly after arginine. Thrombin participates in different biological phenomena, such as hemostasis, thrombosis, inflammation, and cell proliferation [1,2]. Thrombin (factor 2a = F2a) is the key enzyme of mammalian blood coagulation with important functions, such as conversion of fibrinogen to fibrin, feedback amplification of coagulation via F5a and F8a, and activation of platelets. Thrombin is formed by the cleavage of two peptide bonds in prothrombin (F2) by F10a [3]. F10a binds F5a to form the “prothrombinase complex” that activates prothrombin (F2) to thrombin (F2a). The F10-ase and the prothrombinase complexes are easily formed on negatively charged phospholipids, e.g. of the outer membrane of activated platelets [4].
Glucose, C6H12O6 or H-(C=O)-(CHOH)5-H, is a monosaccharide, with five hydroxyl (OH) groups and one aldehyde group along its six-carbon backbone. Negatively or delta-negatively charged groups can trigger intrinsic F2a generation, possibly by folding of F12 into F12a [5,6]. Glucose triggers the contact phase of human coagulation both in vitro and in vivo [7,8]. Albumin, glycerol, and plasma supplemented with glucose resulted in increased generation of F12a and of F2a in vitro [9- 11].
One typical complication in diabetes is diabetic glomeropathy. Pathologically accelerated coagulation has been suspected as a pathogenic factor that induces mesangial proliferation [12-14]. Diabetic nephropathy seems to be caused by enhanced F10a generation [14,15]. F10a inhibitors, such as fondaparinux, seem to suppress both glomerular hypertrophy and hypervascularity in db/db mice [16]. F10a generation might be triggered intrinsiccally (via glucose itself) or extrinsically (via tissue factor = TF): the mesangium is rich in monocytes/macrophages, which are important generators of TF. Upon inflammation, mesangial cells seem to produce large amounts of TF and of F5 [17,18].
2. MATERIAL AND METHODS
2.1. Mice
Male and female Balb/c mice, 6 - 8 weeks old (average weight 25 g), were obtained from Harlan Winkelmann (Borchen, Germany). Mice were housed under optimal conditions (6 mice per cage) in a 12/12 hour light/dark cycle with food and water available ad libitum. Mice were randomly distributed into treatment and control groups. Mice (n = 2 or 3) received intraperitoneally (i.p.) different amounts of glucose or for control they received 0.9% NaCl. EDTA-blood was withdrawn from the mice at different time points (0, 5, 30, 45, 60, 90, or 180 minutes) using intracardiac or vena cava puncture to avoid coagulation activation. All experimental procedures were approved by the local animal ethics committee and met German and international guidelines.
2.2. EDTA-Concentration
2.6 ml polypropylene monovettes containing 2.6*1.6 = 4.16 mg sterile K3-EDTA (ethylene diamine tetra acetic acid, tripotassium salt) from Sarstedt (Nümbrecht, Germany) were filled with 130 µl 0.9% NaCl of drug quality, to obtain a K3-EDTA solution of 32 mg/ml. 50 µl of this K3-EDTA-solution was given to a polypropylene syringe and 300 µl of murine blood were drawn. The final K3-EDTA-concentration in murine blood was 4.6 mg/ml. This concentration was preferred to 2.3 mg/ml [19] because additional EDTA does not disturb the systemic F2a test but might improve anticoagulation in complicated blood drawings.
2.3. Assay for Circulating Thrombin Activity (Systemic F2a) in Murine Blood
The freshly drawn 4.6 mg/ml EDTA-blood of treated mice (usually n = 3 for each glucose amount) in 1 ml polypropylene cups was centrifuged for 8 min at 3500 rpm (2200 g; 23˚C). For control, the blood of untreated mice (n = 3) was also anticoagulated with 4.6 mg/ml EDTA. After centrifugation, 35 µl of the EDTA-plasma were mixed with 35 µl 2.6 M arginine (pH 8.6) (Sigma, Deisenhofen, Germany) in polystyrene half area wells (Greiner, Frickenhausen, Germany; article nr. 675101). 35 µl of 0 mM (turbidity control) or 1 mM (main reaction) chromogenic thrombin substrate (CHG-Ala-ArgpNA Pentapharm, Basel, Switzerland) in 1.25 M arginine (pH 8.7) were added. The increase in absorbance measured at 405 nm (DA405nm/t) was determined at each time point at 37˚C by a microtiter plate photometer with a 1 mA resolution (Tecan Sunrise, Crailsheim, Germany). The DA/t values of the turbidity control were subtracted from the DA/t values of the main chromogenic reaction.
2.4. Determination of Glucose Concentrations in Mice Plasma
Glucose in EDTA-plasma of mice was determined enzymatically, using the D-Glucose/D-Fructose determination kit from Boehringer Mannheim-R-Biopharm Roche (article nr. 10 139 106 035). The principle of the method is hexokinase-mediated phosphorylation of glucose to glucose-6-phosphat (G-6-P), followed by G-6-P dehydrogenase—mediated oxidation of G-6-P into gluconate-6-phosphate and generation of NADPH, that is monitored at 340 nm (Warburg reaction). 5 µl EDTAplasma were incubated in polystyrene F-wells (NUNC, Wiesbaden, Germany; article nr. 446140) with 100 µl reagent 1 (64 mg NADP, 160 mg ATP, magnesium sulphate, triethanolamine, pH 7.6 in 27 ml H2O), 2 µl reagent 2 (≈200 U hexokinase, ≈100 U G-6-P dehydrogenase in 0.7 ml) and 100 µl H2O for 15 min at 23˚C. The specific increase of absorbance at 340 nm, determined by a microtiter plate photometer (Tecan Sunrise), was approximatly 200 mA for the 0.5 g/l (50 mg/dl = 2.78 mM) glucose standard.
2.5. Statistical Analysis
The test group was compared with the control group, using the X2test [20]. A p-value of less than 0.05 was considered as significant.
3. RESULTS AND DISCUSSION
First, to determine the effect of glucose on systemic F2a activity, balb/c mice were divided into 4 groups (1 control and 3 treated groups). The control group was injected i.p with 0.9% NaCl while the 3 treated groups were i.p. treated with 300 µl of 0.25, 0.5 or 1 M glucose. The blood was withdrawn 0.5 and 1h post injection from vena cava.
As seen in Figure 1(a), systemic F2a activity increased significantly time and dose dependently. 1 h after i.p. injection 0.1 - 0.3 mmoles glucose resulted in about 1.4 fold increase of plasmatic glucose and in about 2.5 fold increase of systemic F2a activity (Figure 1(b)). This implies a continuous systemic generation of thrombin over time parallel to the increase of plasmatic glucose.
In another experiment the mice were i.p. injected with different amounts of glucose (100 µl and 300 µl 1 M). The control group was injected with 0.9% NaCl. After 0.5 h there was a proportional linear increase of systemic thrombin activity with the increase in the amount of glucose injected whereby 0.1 and 0.3 mmoles glucose i.p.
 (a)
(a)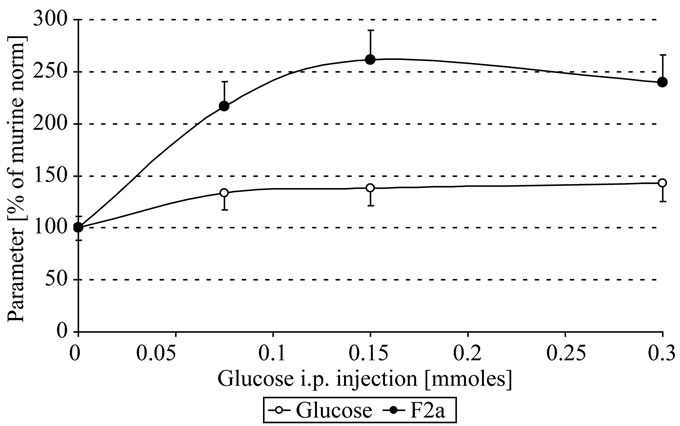 (b)
(b)
Figure 1. In vivo thrombin generation by glucose; Mice were i.p. injected with 300 µl 0 - 1 M glucose. After 0.5, 1 h EDTA-blood was withdrawn, centrifuged, the plasma stabilized 1 + 1 with 2.5 M arginine, pH 8.6, and analyzed for systemic thrombin (F2a) activity (Figure 1(a)). The plasmatic glucose concentrations (O) that change systemic F2a activity (●) are shown in figure 1(b) (after 1 h). Mice with 0 mg glucose i.p. injected were the control mice (100 % of murine norm F2a = 583 % of human norm F2a [6]; 100% of murine norm glucose = 110 mg/dl = 6.1 mM; mean values).
resulted in approximately 1.4 and 1.9 fold systemic thrombin activity, respectively (Figure 2).
Even glucose amounts of much less than 0.1 mmoles i.p. resulted in a significant increase of systemic F2a. So we chose a glucose amount of 300 µl 0.125 M = 0.038 mmoles, that has a clear but still not too pronounced action on systemic thrombin generation: here an increase of the plasmatic glucose of about 1.5 fold could resulted in about 4fold increased systemic thrombin activity, depending on the time interval between glucose i.p. injection and blood drawing. We found that the optimal time interval to withdraw blood was after about 45 min that reflected best the action of glucose on systemic thrombin activity (Figure 3). The body might downregulate the systemic thrombin activity by inhibition of F2a generation or by enhanced (hepatocytes-mediated [8]) clearance
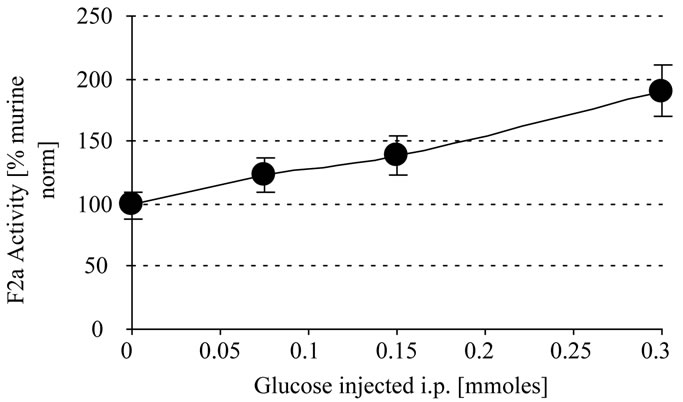
Figure 2. In vivo thrombin generation by glucose. Mice were i.p injected with 300 µl glucose (0 - 1 M). After 0.5 h EDTA-blood was withdrawn, centrifuged and the plasma stabilized with 1 + 1 with 2.5 M arginine (pH 8,6) and analyzed for systemic thrombin (F2a) activity. Mice treated with NaCl were the control mice. In a repeated experiment we found 0.05/124 and 0.1/143 (x/y).
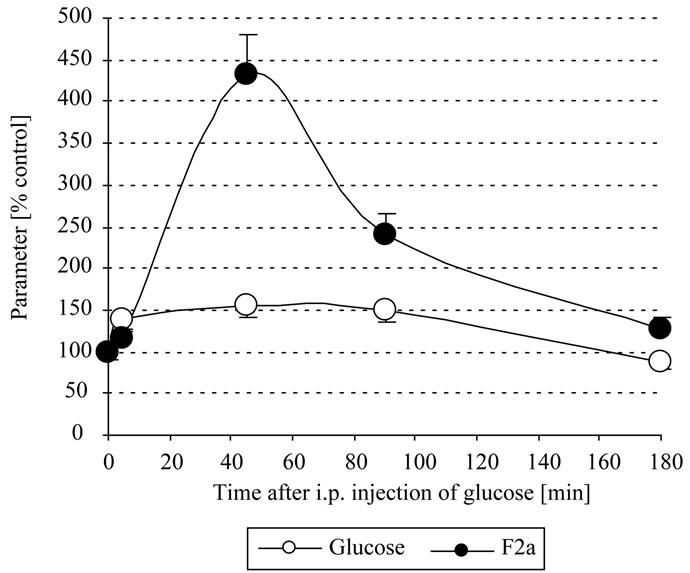
Figure 3. In vivo thrombin generation by glucose. Mice were i.p. injected with 300 µl 0.125 M = 0.038 mmoles glucose. After 0 - 3 h EDTA-blood was withdrawn, centrifuged, the plasma stabilized 1+1 with 2.5 M arginine, pH 8.6, and analyzed for systemic thrombin (F2a) activity. Mice with 0 mg glucose injected i.p. were the control mice.
of activated clotting factors. So the systemic thrombin activity decreased after 90 min and returned almost to normal after 180 min.
In conclusion, administration of glucose resulted in a massive increase in systemic thrombin generation in mice, although the glucose level in blood increased only slightly. In another study of our research group administration of glucose to two healthy human volunteers increased systemic kallikrein activity, that is activation of the early phase of intrinsic coagulation [8]. However, in this human study increased systemic F2a activity could not be detected. Thus, activated coagulation factors could be more efficiently cleared by human than by murine hepatocytes [8].
In human pathophysiology, when the concentration of systemic F2a reaches 120% of the normal, the normal human intravascular coagulation (NIC) changes to the pre-phase of pathologic plasmatic intravascular coagulation (PIC-0 also defined as pre-PIC). At 150% systemic F2a, the PIC-0 changes to PIC-1 which is the common pathologic plasmatic intravascular coagulation (Typical PIC). At 200% systemic F2a, PIC-1 changes to (PIC-2) the advanced pathologic plasmatic intravascular coagulation (consumption PIC) [21-24].
The pathophysiologic situation might be more pronounced in diabetic patients with liver insufficiency, where any increase in blood glucose might result in an increase not only in kallikrein but also in F2a leading to critical concentrations of circulating micro-thrombi.
Therefore, it should be good to monitor systemic F2a in diabetic patients (comparable to the old biomarker glycated hemoglobin (HbA1c)) to avoid complications arising from the increased systemic F2a. The target range of systemic F2a is NIC, that should be as close to the 100% of normal value as possible. If the values are higher than the normal range, the close-to-physiologic anticoagulant low-molecular-weight-heparin (LMWH) should be used to lower them.
The present study shows that glucose itself can increase in vivo thrombin generation. The present assay technique seems to be suitable in judging the coagulation activation state in any mammalian blood [19,23,24].
![]()
![]()
REFERENCES
- Stubbs, M.T. and Bode, W. (1995) The clot thickens: Clues provided by thrombin structure. Trends in Biochemical Sciences, 20, 23-28. doi:10.1016/S0968-0004(00)88945-8
- Guillin, M.C., Bezeaud, A., Bouton, M.C. and JandrotPerrus, M. (1995) Thrombin specificity. Thrombosis and Haemostasis, 74, 129-133.
- Furie, B. and Furie, B.C. (1992) Molecular and cellular biology of blood coagulation. New England Journal of Medicine, 326, 800-806. doi:10.1056/NEJM199203193261205
- Montoro-García, S., Shantsila, E., Marín, F., Blann, A. and Lip, G.Y. (2011) Circulating microparticles: New insights into the biochemical basis of microparticle release and activity. Basic Research in Cardiology, 106, 911-923. doi:10.1007/s00395-011-0198-4
- Stief, T.W. (2010) Thrombin generation by the amino acid glycine. Hemostasis Laboratory, 3, 129-133.
- Stief, T.W. and Mohrez M. (2011) Thrombin generation by valproate. Hemostasis Laboratory, 4, 101-144.
- Stief, T.W. (2012) Glucose activates the early phase of intrinsic coagulation. Hemostasis Laboratory, 5, 67-81.
- Stief, T.W. and Mohrez, M. (2012) Glucose activates human intrinsic coagulation in vivo. Hemostasis Laboratory, 5, 83-89.
- Stief, T.W. (2011) Factor 12 activation in two purified systems. Hemostasis Laboratory, 4, 385-408.
- Stief, T.W. (2011) Zn2+, hexane, or glucose activate factor 12 and/or prekallikrein in two purified systems. Hemostasis Laboratory, 4, 409-426.
- Stief, T.W. (2012) Zn2+, hexane, valproate, or glucose in two purified systems of F12-PK-HMWK. Hemostasis Laboratory, 5, 35-50.
- Hu, T. and Desai, J.P. (2004) Soft-tissue material properties under large deformation: Strain rate effect. Proceedings of the 26th Annual International Conference of the IEEE EMBS, San Francisco, 2758-2761.
- Liu, N., Mori, N., Iehara, N., Uemura, K., Fukastu, A., Kita, T., Matsuda, M. and Ono, T. (2007) Soluble fibrin formation in the mesangial area of IgA nephropathy. Clinical and Experimental Nephrology, 11, 71-76. doi:10.1007/s10157-006-0457-0
- Nomura, K., Liu, N., Nagai, K., Hasegawa, T., Kobayashi, I., Nogaki, F., Tanaka, M., Arai, H., Fukatsu, A., Kita, T. and Ono, T. (2007) Roles of coagulation pathway and factor Xa in rat mesangioproliferative glomerulonephritis. Laboratory Investigation, 87, 150-160. doi:10.1038/labinvest.3700502
- Frank, R.D., Schabbauer, G., Holscher, T., Sato, Y., Tencati, M., Pawlinski, R. and Mackman, N. (2005) The synthetic pentasaccharide fondaparinux reduces coagulation, inflammation and neutrophil accumulation in kidney ischemia-reperfusion injury. Journal of Thrombosis and Haemostasis, 3, 531-540. doi:10.1111/j.1538-7836.2005.01188.x
- Ayaka, S., Natsuko, Y.H., Fan, B., Toshiaki, M., Hajime, M. and Takahiko, O. (2011) Roles of Coagulation Pathway and Factor Xa in the Progression of Diabetic Nephropathy in db/db Mice. Biological & Pharmaceutical Bulletin, 34, 824-830. doi:10.1248/bpb.34.824
- Wiggins, R.C., Njoku, N. and Sedor, J.R. (1990) Tissue factor production by cultured rat mesangial cells. Stimulation by TNF alpha and lipopolysaccharide. Kidney International, 37, 1281-1285. doi:10.1038/ki.1990.112
- Ono, T., Liu, N., Kasuno, K., Kusano, H., Nogaki, F., Kamata, T., Suyama, K., Muso, E. and Sasayama, S. (2001) Coagulation process proceeds on cultured human mesangial cells via expression of factor V. Kidney International, 60, 1009-1017. doi:10.1046/j.1523-1755.2001.0600031009.x
- Mohrez, M., Alrifai, M. and Stief, T.W. (2011) Systemic thrombin generation by valproate. Hemostasis Laboratory, 4, 427-438.
- Stief, T.W. (2007) The fibrinogen antigenic turbidimetric assay (FIATA). The X2 test: The corrected chi-square comparison against the control-mean. Clinical and Applied Thrombosis/Hemostasis, 13, 73-100. http://cat.sagepub.com/content/13/1/73
- Stief, T.W. (2010) Drug-induced thrombin generation: The breakthrough. Hemostasis Laboratory, 3, 3-5. https://www.novapublishers.com/catalog/product_info.php?products_id=13774
- Stief, T.W. (2006) Specific determination of plasmatic thrombin activity. Clinical and Applied Thrombosis/Hemostasis, 12, 324-329. doi:10.1177/1076029606291381
- Stief, T.W. (2008) The laboratory diagnosis of the prephase of pathologic disseminated intravascular coagulation. Hemostasis Laboratory, 1, 3-19.
- Stief, T.W. (2010) Circulating thrombin activity in unselected routine plasmas. Hemostasis Laboratory, 3, 7-16.