Journal of Behavioral and Brain Science
Vol.2 No.3(2012), Article ID:22093,4 pages DOI:10.4236/jbbs.2012.23039
Prior Somatic Stimulation Improves Performance of Acquired Motor Skill by Facilitating Functional Connectivity in Cortico-Subcortical Motor Circuits
1Brain ICT Laboratory, Advanced ICT Research Institute, National Institute of Information and Communications Technology, Kyoto, Japan
2The Japan Society for the Promotion of Science, Kyoto, Japan
3Graduate School of Human and Environmental Studies, Kyoto University, Kyoto, Japan
4Tokyo Metropolitan Institute for Neuroscience, Tokyo, Japan
5Center for Information and Neural Networks (CiNet), National Institute of Information and Communications Technology, Kyoto, Japan
6Graduate School of Medicine, Osaka University, Osaka, Japan
Email: eiichi.naito@nict.go.jp
Received February 29, 2012; revised March 27, 2012; accepted April 9, 2012
Keywords: Cortico-Subcortical Motor Circuit; Primary Motor Cortex; Basal Ganglia; Cerebellum; Motor Skill Learning; Somatic Stimulation; Neuronal Plasticity; Functional Magnetic Resonance Imaging
ABSTRACT
Once people have a well-trained motor skill, their performance becomes stabilized and achieving substantial improvement is difficult. Recently, we have shown that even a plateaued hand motor skill can be upgraded with short-period electrical stimulation to the hand prior to the task. Here, we identify the neuronal substrates underlying the improvement of the plateaued skill by examining the enhanced functional connectivity in the sensory-motor regions that are associated with motor learning. We measured brain activity using functional magnetic resonance imaging and performed psychophysiological interaction analysis. We recruited seven right-handed very-well trained participants, whose motor performance of continuously rotating two balls with their right hands became stabilized at higher performance levels. We prepared two experiments, in each of which they repeated an experimental run 16 times. In each run, they performed this cyclic rotation as many times as possible in 16 s. In the thenar-stimulation experiment, we applied 60-s stimulation to the thenar muscle before each of the 5th - 12th runs, and the others were preceded by ineffective sham stimulation. In the control experiment, the sham was always provided. Thenar stimulation enabled the participants to perform the movements at higher cycles. In association with this performance improvement, we found enhanced activity couplings between the primary motor cortex and the sensorimotor territory of the putamen and between the cerebellum and the primary sensorimotor cortices, without any quantitative activity increase. Neither behavioral change nor these increased activity couplings were observed in the control. Thus, in contrast to the stable neuronal states in the cortico-subcortical motor circuits when the well-learned task is repeated at the later stages of motor skill learning, plastic changes in the motor circuits seem to be required when the plateaued skill is upgraded, and the stimulation may entail a state of readiness for the plastic change that allows subsequent performance improvement.
1. Introduction
Procedural motor skill learning includes a period when no substantial gain in performance improvement is obtained even with repeated, daily practice [1-3]. In this later learning stage, the spontaneous occurrence of substantial skill improvement is rarely seen within a single training session on an experimental day [3,4]. This is probably because the neuronal substrate that controls the motor skill is stabilized in the central nervous system
(CNS), and upgrading the execution mode pertaining to well-learned skills is difficult through normal physical training.
Recently, we showed that even a well-learned, plateaued motor skill can be rapidly upgraded with shortperiod somatic stimulation just prior to initiating the motor task [3]. In this previous study, we provided about one-minute transcutaneous electrical stimulation to the thenar muscles (thenar stimulation) before participants performed an acquired skillful hand motor task, and demonstrated that the thenar stimulation induced rapid improvement of the motor skill by promoting efficient control. Thus, improvement of a plateaued motor skill is possible with sensory intervention. However, the neuronal substrates underlying this behavioral change remain unclear.
In our series of studies, we have shown in humans that somatic stimulation, even for a short-period less than one minute, modulates the neuronal activities in a wide range of sensory-motor brain regions [ex., 5]. Thus, the present short-period somatic stimulation also likely modulates activity in the sensory-motor regions, so as to entail a state of readiness for subsequent plastic changes in these regions, which could be a key for improving well-learned motor skills.
In the present study, we recruited seven right-handed very-well trained participants, whose motor performance of continuously rotating two balls with their right hands stabilized at higher performance levels. We prepared two experiments, in each of which they repeated an experimental run 16 times. In each run, they performed the cyclic rotation as many times as possible in 16 s. In one experiment, we applied the thenar stimulation before each of the 5th - 12th runs. In the control experiment, ineffective sham stimulation was always provided in all runs. We expected that the thenar stimulation enables the participants to perform the movements at higher cycles, as we had observed in our previous study.
We measured the brain activity with functional magnetic resonance imaging (fMRI) and investigated enhanced activity coupling in association with the stimulation-induced improvement of the plateaued motor skill within the sensory-motor regions active during the motor task. We performed psychophysiological interaction (PPI) analysis. Because functional (effective) connectivity in analysis, general, has been widely used to reveal the modulation of activity coupling in brain networks that are associated with motor learning [6-9], and the PPI analysis has proven to be useful to detect plastic change in networks, even when no greater quantitative changes in brain activations are expected in the later stages of motor skill learning [8].
2. Materials and Methods
2.1. Participants
Seven (five males and two females; aged 22-41) righthanded volunteers participated in the present study. Their handedness was examined by the Oldfield handedness inventory [10]. They also participated in our previous study [3]. The Ethical Committee of the National Institute of Communications and Technology (NICT) approved the study. All participants provided written informed consent. The experiment was performed according to the principles and guidelines of the Declaration of Helsinki (1975).
2.2. Motor Task and Training
In an fMRI scanner, blindfolded participants continuously rotated two balls (diameter = 35 mm; 80 g each) on the palm of their right hand as many times as possible for 16 s in an experimental run (Figure 1(a)) [11,12]. They performed the run 16 times with about one-minute intervals for the stimulation application (Figure 1(b)).
The participants were already well trained because they participated in our previous behavioral study [3]. In addition, the present seven volunteers were recruited from 10 participants who received additional intensive training in the previous study, through daily training of this task combined with the thenar stimulation for two
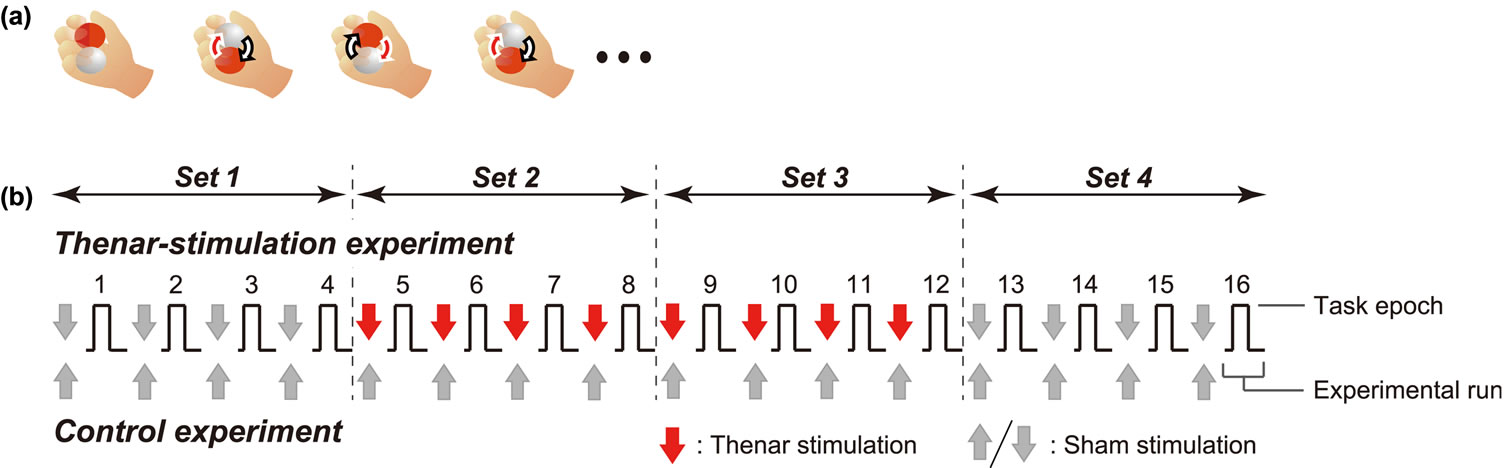
Figure 1. Motor task (a) and experimental protocol (b). (a) Participants rotated two balls on their right palm as many times as possible in 16 sec (=one task epoch); (b) An experimental run, which consisted of a pair of task and rest epochs, was repeated 16 times with about one-minute intervals. In thenar-stimulation experiment, 60-s thenar stimulation was applied during the interval before the 5th - 12th runs (red arrows). The remaining runs were preceded by the ineffective sham stimulation (gray down arrows). In the control experiment, the sham stimulation was always applied before all runs (gray up arrows). In the analyses, the 16 runs were subdivided into four subsets [Set 1 (1st - 4th runs), Set 2 (5th - 8th), Set 3 (9th - 12th), and Set 4 (13th - 16th)].
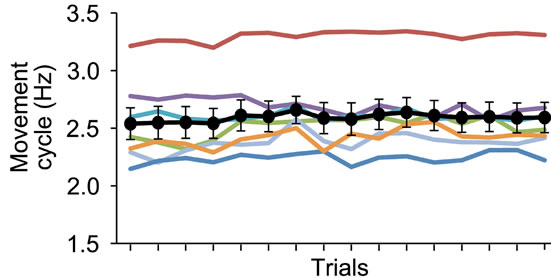
weeks (see details in the reference). When we evaluated their performance outside the scanner before we started the present study, we confirmed that their averaged movement cycle was 2.6 Hz and that their performance had absolutely stabilized at this higher cycle with no occurrence of spontaneous improvement within a training session of one experimental day when they repeated the run 16 times at 75-s intervals (Figures 2(a) and (b)). Thus, the participants were quite intensively trained volunteers, and we reported the results obtained from this limited sample of specially trained volunteers.
2.3. fMRI Measurement and Task Procedure
A 3.0-T SIEMENS scanner (Trio Tim) with a head-coil was used to obtain T1-weighted anatomical images (MPRAGE) and functional T2*-weighted echoplanar images (64 by 64 matrix; 3.0 by 3.0 mm; TE 30 ms). A functional image volume comprising 30 4-mm thick slices with a 1-mm slice gap was imaged to ensure that the whole brain was included within the 192-mm field of view. The participants rested comfortably in a supine position on a bed in the scanner. Their arms were oriented parallel to their torsos, and their forearms were supported by a cushion allowing them to relax com-
 (a)
(a)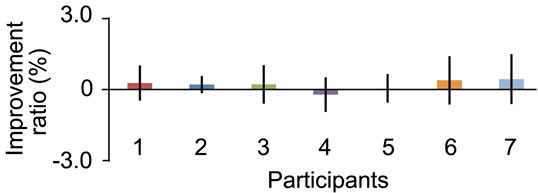 (b)
(b)
Figure 2. Stabilized motor performance of participants before fMRI experiment outside the scanner. (a) Movement cycle (y axis) in sequence of 16 trials (x axis) with an interval of 75 s. Data obtained from each participant are shown in different colored line. Black circles represent average movement cycle across participants. Bars indicate standard error of means across participants (SEM); (b) Average improvement ratio (%) across trials (y axis) in each participant (x axis). Bars indicate SEM across trials. We calculated improvement ratio in terms of movement cycle in a trial when compared with that in the previous trial, and computed the average improvement ratio across trials. Onesample t-test was performed for each participant to test if the improvement ratio was significantly greater than zero, and no significant improvement was observed in any of the participants (p > 0.5).
pletely. The participants were only allowed to move their fingers without moving their forearm. During the interrun interval, they were requested to remain immobilized and to relax their hands to avoid muscular thixotropy [13].
We conducted both thenar-stimulation and control experiments on separate days, and all seven volunteers participated in each one. On one experimental day, before we started the brain scanning, they practiced four warmup runs in the scanner.
In the thenar-stimulation experiment (Figure 1(b)), during the interval before each of the 5th - 12th runs, we applied 60-s stimulation to the skin surface over the abductor pollicis brevis (APB) muscle of the thumb. The stimulator and stimulus parameters used in the present study were the same as in our previous study [3]. The intensity was set just below the motor threshold, which elicited no visible thumb movements or muscle twitches. The intensity was determined prior to starting the experiment for each participant. The stimulation generally produced both tingling and muscle-stimulation sensations in the thumb without generating motor responses. The remainder of the runs (1st - 4th and 13th - 16th) was preceded by sham stimulation. The same stimulation was given to the same skin surface over the thenar muscle, but it was delivered only at the beginning of the interval and was terminated without informing the participants. The duration of the sham stimulation varied (from 5 to 11 s). The buzzing sound, which was normally accompanied by the stimulation, was maintained even after the termination of the electrical stimulation. Our previous study confirmed that the sham stimulation was ineffective without generating any skill improvement effects. Thus, with this experimental maneuver, we matched the participant’s attention to their hands and the experimental environments between the thenar and sham runs, while avoiding the improvement effect from the latter.
We also conducted a control experiment to examine the changes of motor performance and brain activation when the same participants performed the 16 runs by merely receiving sham stimulation before all runs.
In the thenar-stimulation experiment, brain scanning began immediately after the 60-s stimulation. Likewise, in the control experiment, scanning began at the timing that corresponded with the thenar-stimulation experiment. Each experimental run started with a 10-s pre-task resting period, followed by task (16 s) and rest (16 s) epochs (Figure 1(b)). The start and end of each task epoch was signaled by sounds from a computer in an operation room, and the start timing was counted from 3 s before each task epoch. The participants in the scanner heard these auditory instructions through head phones. We included an extra period of 6 s between the end of the task epoch and the start of the rest epoch. We collected 24 functional images in each run: five volumes for the pre-task resting period, eight for each of the task and rest epochs, and three for the extra period; TR = 2 s.
2.4. Behavioral Measurement and Analysis
To measure the motor performance in the scanner, a small sensor (0.2 g; Vibration Pickup Model 2351A; Showa Sokki Corporation, Tokyo, Japan) was mounted to the thumbnail. This was the same sensor used in our previous study [3]. The signals were amplified (Vibration Meter Model 1607A; Showa Sokki Corporation, Tokyo, Japan) and recorded in the displacement measurement mode. During the cyclic movements, the sensor provided a sinusoidal-like waveform, whose positive and negative peaks represented flexion or extension of the thumb movements. Thus, the data contained information regarding the movement cycle as well as the amplitude of the thumb displacement (extension-flexion) per cycle.
The kinematic signals were recorded on a PC for later offline analysis via an A/D converter (PowerLab 16/30; AD Instruments Japan Inc., Nagoya, Japan) and sampled at 2 kHz. The converter also received event signals that indicated the onset and offset of a task epoch from the computer. The duration of each task epoch was defined by these event signals. In the analysis, the data obtained from the sensor were first band-pass filtered (1 - 4 Hz).
2.5. Evaluation of Movement Cycle (in the Scanner)
In the scanner, we were unable to precisely measure the kinematic amplitude of the thumb movement due to the noisy magnetic environment. However, we confirmed that the number of positive peaks in the sensor signals within the duration of a task epoch matched the number of rotations when we directly counted them during the task performance. Thus, we counted the number of positive peaks in each task epoch for each participant and converted this value to hertz (=movement cycles). We only analyzed the movement cycles that represent the number of rotations in a task epoch to evaluate the behavioral changes in the scanner. In the statistical analyses, the 16 runs were subdivided into four subsets: Set 1 (1st - 4th runs), Set 2 (5th - 8th), Set 3 (9th - 12th), and Set 4 (13th - 16th). We separately calculated the average movement cycles for each of the four subsets in the thenar-stimulation and control experiments. A two-factorial [thenar-stimulation or control experiment (2) × subsets (4)] ANOVA (repeated measurement; n = 7) was performed for the statistical evaluation.
2.6. Evaluation of Amplitude of Finger Displacement (Compensatory Experiment outside the Scanner)
To compensate the limitation of behavioral measurement in the scanner, we conducted an additional behavioral experiment in each participant after the fMRI experiment. We replicated the same thenar-stimulation experiment outside the scanner room on another day to check if reducing the kinematic amplitude of the finger movement per cycle occurs in association with performance improvement, as we observed in our previous study [3]. We analyzed the amplitude of the thumb displacement per cycle in addition to the movement cycle (see method above). The amplitude of the thumb displacement was defined as the difference between the values of the positive and subsequent negative peaks in each cycle. We calculated the mean amplitude of the thumb displacement per cycle for each task epoch per participant. The amplitude varied across participants, probably due to individual differences of the physical length of the thumb and/or motor strategy to perform the task. Thus, the mean amplitude in each task epoch was converted to a z-score based on the data obtained from all epochs of each participant. We calculated z-score by subtracting the mean value of all epochs from individual raw value of each epoch and then dividing by the standard deviation of all epochs.
In this experiment, we also examined the relationship between the movement cycle and the amplitude of the thumb displacement per cycle across 16 task epochs. In this analysis, we also converted the movement cycle in each task epoch to a z-score on the basis of the data obtained from all epochs of each participant. Then, the average z-scores across participants were calculated for the movement cycle and for the thumb displacement per cycle in each task epoch (Figure 3(c)).
Finally, since we found that the thumb displacement per cycle decreased while the movement cycle increased in the thenar-stimulation epochs (Figure 3(c)), we wanted to know the change of the total amount of thumb displacement in one epoch. We calculated it in each epoch by multiplying the mean amplitude of the thumb displacement per cycle by the movement cycle in each epoch. Again, we converted the total amount of the thumb displacement in each task epoch to a z-score in the same way described above.
In the statistical analyses of the movement cycle, the thumb displacement per cycle, and for the total amount of thumb displacement per epoch, we calculated the average z-scores for each of the four subsets and performed a one-way ANOVA (repeated measurement; n = 7).
2.7. fMRI Data Analysis
The fMRI data were analyzed using Statistical Parametric Mapping software (SPM8; http://www.fil.ion.ucl.ac.uk/spm). The details of the image
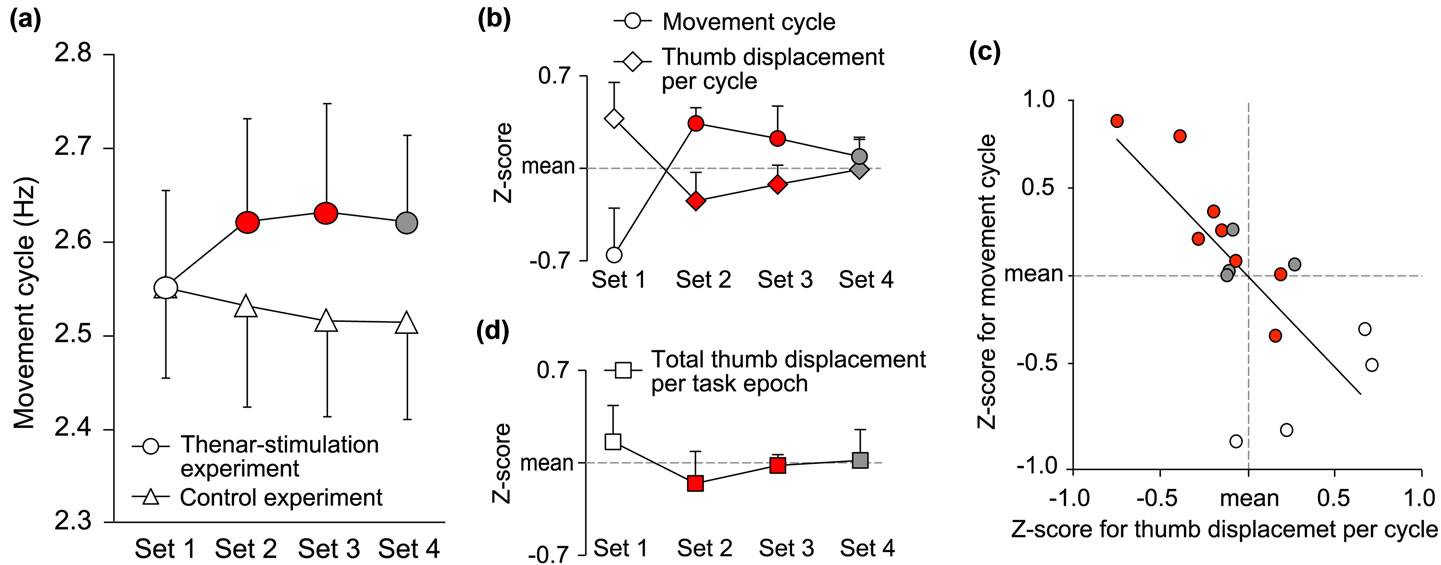
Figure 3. Behavioral change observed in and outside the scanner. (a) Change of movement cycle observed in thenar-stimulation (circles) and control (triangles) experiments in the scanner. Average movement cycles (y axis) in 4 subsets (x axis) are displayed. An open circle represents the data in Set 1, red represents those in Sets 2 and 3 (=thenar-stimulation subsets), and grey represents that for Set 4, respectively. Bars indicate SEM. Usages of colors and bars are consistent in panels b and d. (b)-(d) Behavioral results obtained in thenar-stimulation experiment performed outside the scanner after the fMRI experiment. (b) Changes of movement cycle (circles) and thumb displacement per cycle (diamonds). Average z-scores both for movement cycle and for thumb displacement per cycle (y axis) in 4 subsets (x axis) are displayed. (c) Relationship between movement cycle (y axis) and thumb displacement per cycle (x axis) across 16 task epochs. Average z-scores across participants were calculated for movement cycle and for thumb displacement per cycle in each task epoch. Open circles represent the data in Set 1, red represents those in Set 2 and Set 3, and grey represents those in Set 4. (d) Change of total amount of thumb displacement per task epoch (squares). Average z-scores (y axis) in 4 subsets (x axis) are displayed.
pre-processing using a different version of this software were described elsewhere [14]. The functional images were spatially smoothed with an 8-mm full-width at halfmaximum (FWHM) isotropic Gaussian kernel. We fit a linear regression model (general linear model) to the pooled data from all participants to increase the sensitiveity to detect changes in the brain signals (fixed-effect model) [14]. In terms of the consistency of effects across all participants in the group, we confirmed the validity of this approach by conducting single-participant analyses (see below). Each of the task and rest epochs was modeled with a boxcar function convoluted with the standard SPM8 hemodynamic response function. We defined the extra period as a condition of no interest in the model. The data from the thenar-stimulation and control experiments were separately analyzed.
First, to depict the brain regions active during execution of the task (main effect of the task), we made a contrast of task vs. rest (Figures 4(a) and (b)). A voxel-wise threshold of p < 0.001 uncorrected (T > 3.09) was used to generate the cluster images. The significance of the cluster size was determined at p < 0.05 with the family-wise error rate (FWE) correction in the entire brain space. This was done both in the thenar-stimulation and in the control experiments. As we found the stimulation-induced performance improvement (=increase of movement cycle) only in the thenar-stimulation experiment (Figure 3(a)), we checked the quantitative change of the brain activation, by comparing the brain activity in Sets 2,
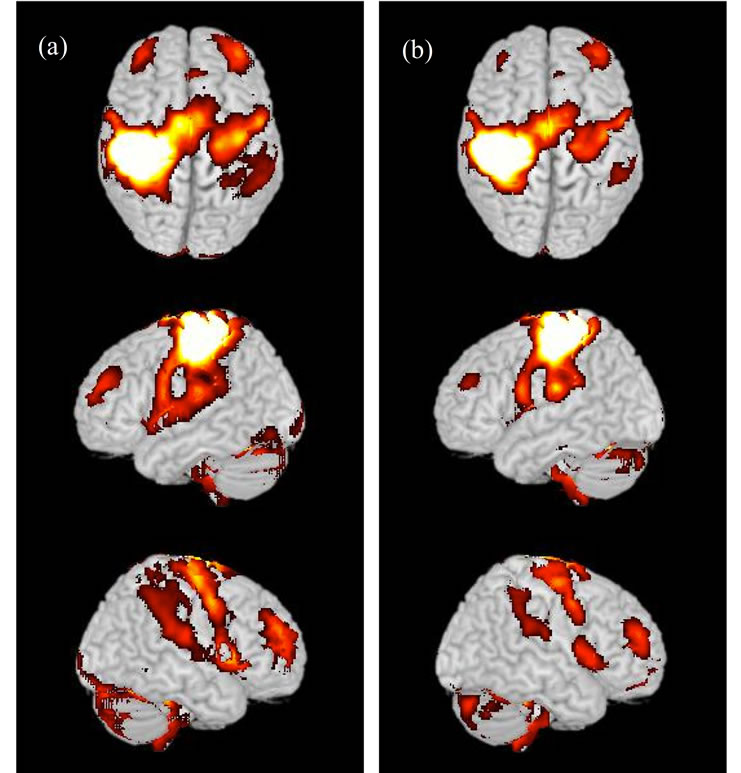
Figure 4. Active brain regions during execution of the present motor task. (a) Results from the thenar-stimulation experiment; (b) Results from the control experiment. Activations are superimposed on the MNI standard brain. Highly similar regions were activated in both (thenar-stimulation and control) experiments.
3 and 4 with that in Set 1.
Second, we performed PPI analysis [15] to assess the changes in the functional (effective) connectivity in association with the skill improvement assisted by the thenar stimulation. We basically followed the approach taken in a previous study [8], which exhaustively investigated enhanced activity coupling from all possible brain regions that are thought to be important in motor learning. But in the present study, within the regions tested in their study [8], we chose those where we identified peaks of activations during the present task (task vs. rest) as index areas. These regions included the left primary motor cortex (M1), the right lobule VI of the vermis, the bilateral cerebellar hemispheres (lobules VI and VIIIB), the left putamen, and the left medial-wall motor region (supplementary motor area; SMA) (Table 1). Except for M1, these regions corresponded to those that give greater influence to other brain regions during the performance of sequential finger movements at the automatic stage as compared with the novel stage [8].
By preparing these index areas, we performed the PPI analysis to identify brain regions in which the degree of coupling with an index area was significantly enhanced during the motor performance, when it was improved by the stimulation as compared with before. The details of the general procedures of the PPI analysis were described elsewhere [16,17]. Briefly, we extracted the time-course data from the 5-mm radius sphere around the activation peak in each index area for each participant. To precisely check the anatomical location of the peak in each participant, we visually inspected the individual anatomical MR images [18]. The peaks identified from all participants were located within a 12-mm radius sphere around the activation peak in each index area, which was identified as the main effect of the task (task vs. rest) in the group analysis. Based on the data, the PPI regressor was computed. We constructed a linear regression model (general linear model) using the PPI regressor as well as the task-related (boxcar × hemodynamic response) regressor used in the analysis for the main effect of the task. To capture the general features of the brain regions that enhance the activity coupling with each index area in association with the performance improvement in the thenar-stimulation experiment, we compared the enhanced connectivity through Sets 2, 3 and 4 with Set 1 by applying a t-contrast (1 to Sets 2, 3 and 4 and –3 for Set 1). The search space was the sensory-motor related regions identified as the main effect of the task (see above). The same voxel-wise threshold (p < 0.001 uncorrected) was used to generate the cluster images. Then, the significance of the cluster size was determined at p < 0.05 with the FWE correction in the search space. The same analysis was also done on the control experiment. For the anatomical identification of the depicted brain regions, we referred to Talairach and Tournoux [19] and Schmahmann et al. [20]. For the identification of the activity in the central sulcus regions, we particularly referred to the cytoarchitectonic probability maps (SPM Anatomy toolbox v1.8) [21].
From these analyses, we only found enhanced activity couplings when we chose M1 and vermis as index areas in the thenar-stimulation experiment (general features; Figures 5(b), 6(c) and (d)). Thus, to ensure that the increased activity couplings were consistently observed in each (Sets 2, 3 or 4) subset, we also compared the connectivity under each subset with Set 1 by applying a tcontrast (1 for Sets 2, 3 or 4 and –1 for Set 1; fixed-effect analysis). In this descriptive approach, we investigated the increase of activity coupling (T > 1.65, p < 0.05 uncorrected) within a 12-mm radius sphere around the peak of the coupled activity in each area detected in the above group analysis (Region of interest; ROI). The radius was determined by considering the final smoothness of the image. The results are summarized in Tables 2 and 3.

Table 1. Mean coordinates of individual index areas across participants.
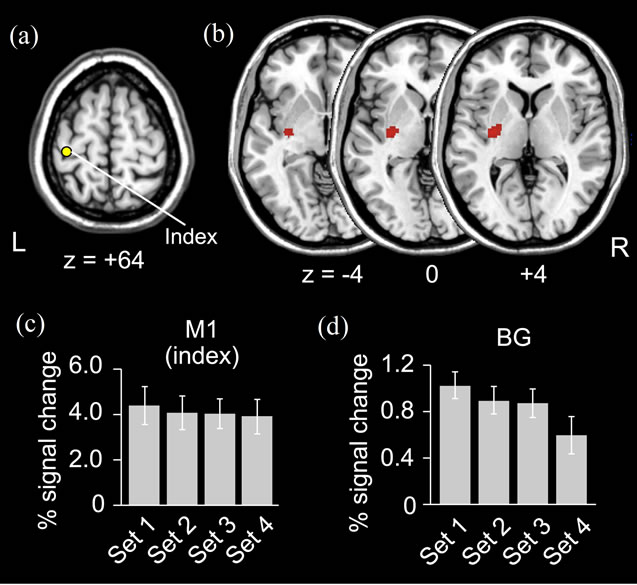
Figure 5. PPI results from left primary motor cortex (M1). (a) Index left M1 [mean coordinates across participants x, y, z = (–41, –27, +64)] for PPI analysis; (b) Basal ganglia (BG) region showing enhanced activity coupling with index M1 in association with performance improvement (general feature). Horizontal sections (from z = –4 to z = +4) are displayed; (c) and (d) Change of activity in index M1 and identified BG regions during the task in 4 subsets (x axis). Average percent increase of BOLD signal across participants (y axis) is shown. Bars indicate SEM.
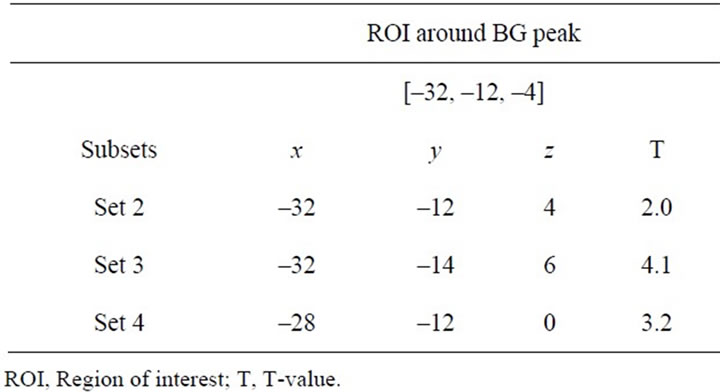
Table 2. Peak coordinates and T-values of coupled activity in basal ganglia (BG) in each subset.
2.8. Single-Participant Analysis
To make sure that the increased activity couplings detected in the group analysis were representative for the majority of seven participants and to refine the anatomical locations of the individually detected regions in the standard anatomical space (x, y, z), we performed the same PPI analysis on each participant. In this descriptive analysis [22], we again probed for the increase of activity coupling in each participant (T > 1.65, p < 0.05 uncorrected) within a 12-mm radius sphere around the peak of the coupled activity in each region detected in the group analysis (see above). By checking whether we can consistently find an increase of activity coupling across participants, we might confirm that the results in the group analysis represent those from the participants. The individual locations of the increased activity coupling are summarized in Tables 4 and 5.
2.9. Volume-of-Interest (VOI) Analysis
Finally, we carefully examined the quantitative changes of the local activities in the index and the identified areas during the task through all the runs in the thenar-stimulation experiment. This analysis was done to check the increase of the activity in these regions during the task, as this is often observed when people perform movements at higher frequency [23-25]. We extracted the time-course data from the index M1, the index vermis, and the other (identified) regions that showed enhanced activity couplings with these index areas in each participant in the same way described above (see single-participant analysis). In each run, we compared the percent increase of the average BOLD signal during a task epoch with that during the corresponding pre-task resting period (see above). For this calculation, we excluded the first 2 volumes during the task period, because they might not well reflect the increase of the BOLD signal in associa-
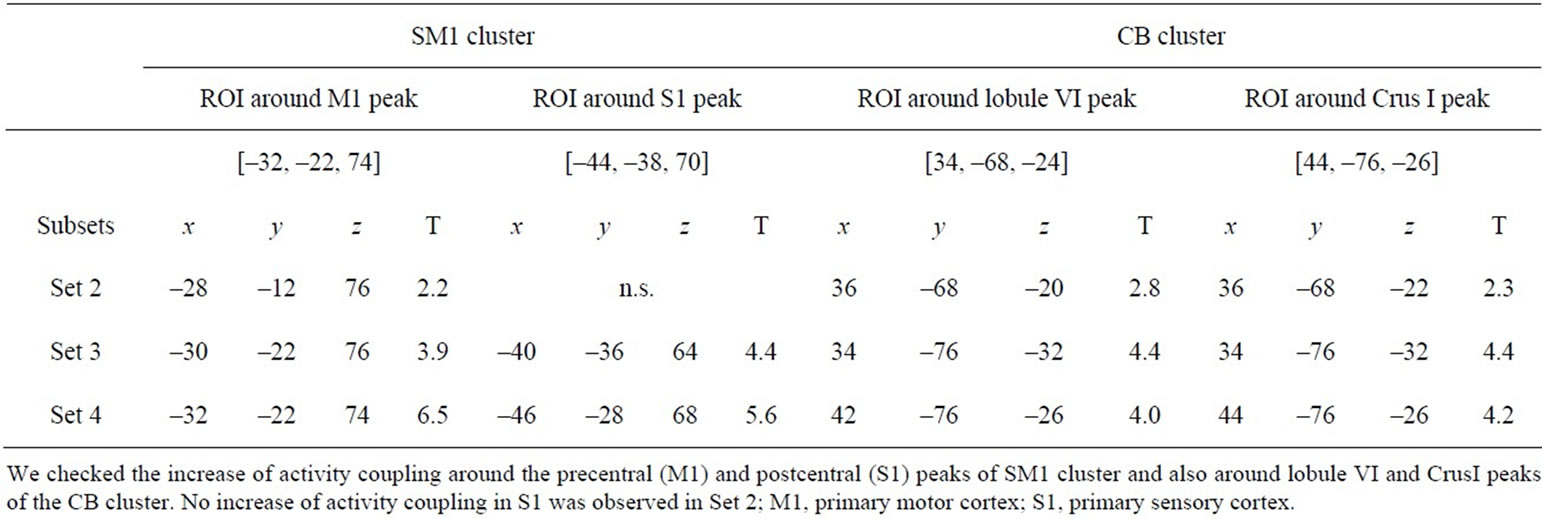
Table 3. Peak coordinates and T-values of coupled activity in clusters of sensorimotor cortices (SM1) and cerebellar hemisphere (CB) in each subset.
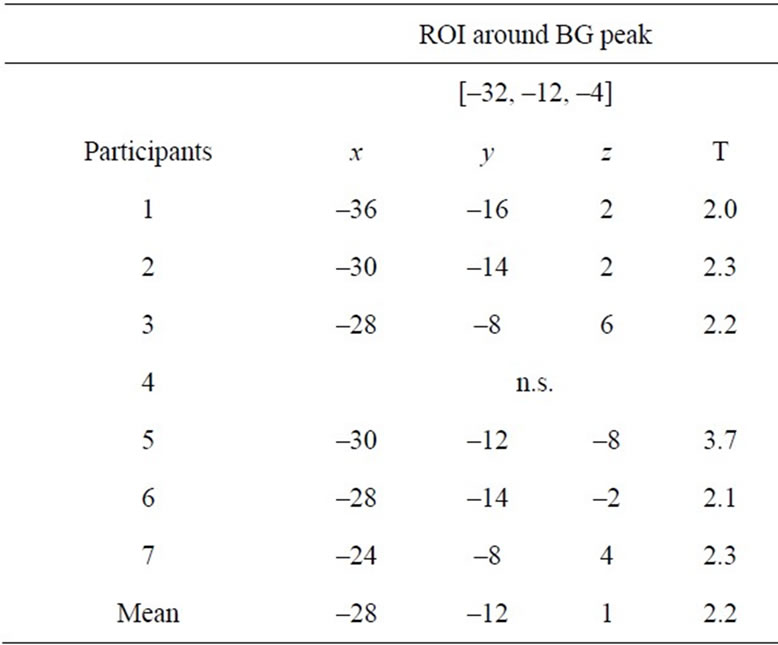
Table 4. Peak coordinates and T-values of individual coupled activity in basal ganglia (BG) through Sets 2, 3 and 4 compared with Set 1.
tion with the ongoing task performance due to the delay in the hemodynamic response. We calculated the average percent increase for each subset in each participant and the mean values of percent increase across participants for each subset (Figures 5(c),(d) and 6(b), (e)-(h)). To verify no significant increase of the local activities, we performed a one-way ANOVA (repeated measurement) among the subsets.
3. Results
3.1. Behavioral Change Observed in the Scanner
In the control experiment where we always provided the sham stimulation, the performance was stable and never improved, even though the participants repeated the experimental run by exerting maximum effort to rotate the balls as many times as possible. In contrast, they were able to perform the movements at higher cycles when we applied the 60-s thenar stimulation prior to each run in the Sets 2 and 3. This improved effect remained even in Set 4 after we stopped applying the stimulation (behavioral residual effect). These findings clearly contrasted those obtained from the control experiment [F(3, 18) = 4.1, p < 0.05; Figure 3(a)].
3.2. Behavioral Change Observed outside the Scanner
In the compensatory experiment outside the scanner, we confirmed that the stimulation allowed the participants to perform the task at higher cycles (p = 0.07; Figure 3(b)). In association with the performance improvement, the kinematic amplitude of the thumb movement per cycle decreased (Figure 3(b)). Although the difference of the thumb displacement across subsets did not reach significant levels, significant correlation was observed between the movement cycle and the thumb displacement per cycle across 16 task epochs (n = 16, r = –0.73, p < 0.01; Figure 3(c)), which was also found in our previous study [3]. The performance at higher cycles was associated with the smaller thumb displacement per cycle, and the relatively lower performance in Set 1 was accompanied by relatively greater thumb displacement per cycle (open circles in Figure 3(c)). Eventually, the total amount of thumb displacement in an epoch remained almost the same across subsets (p = 0.86; Figure 3(d)).
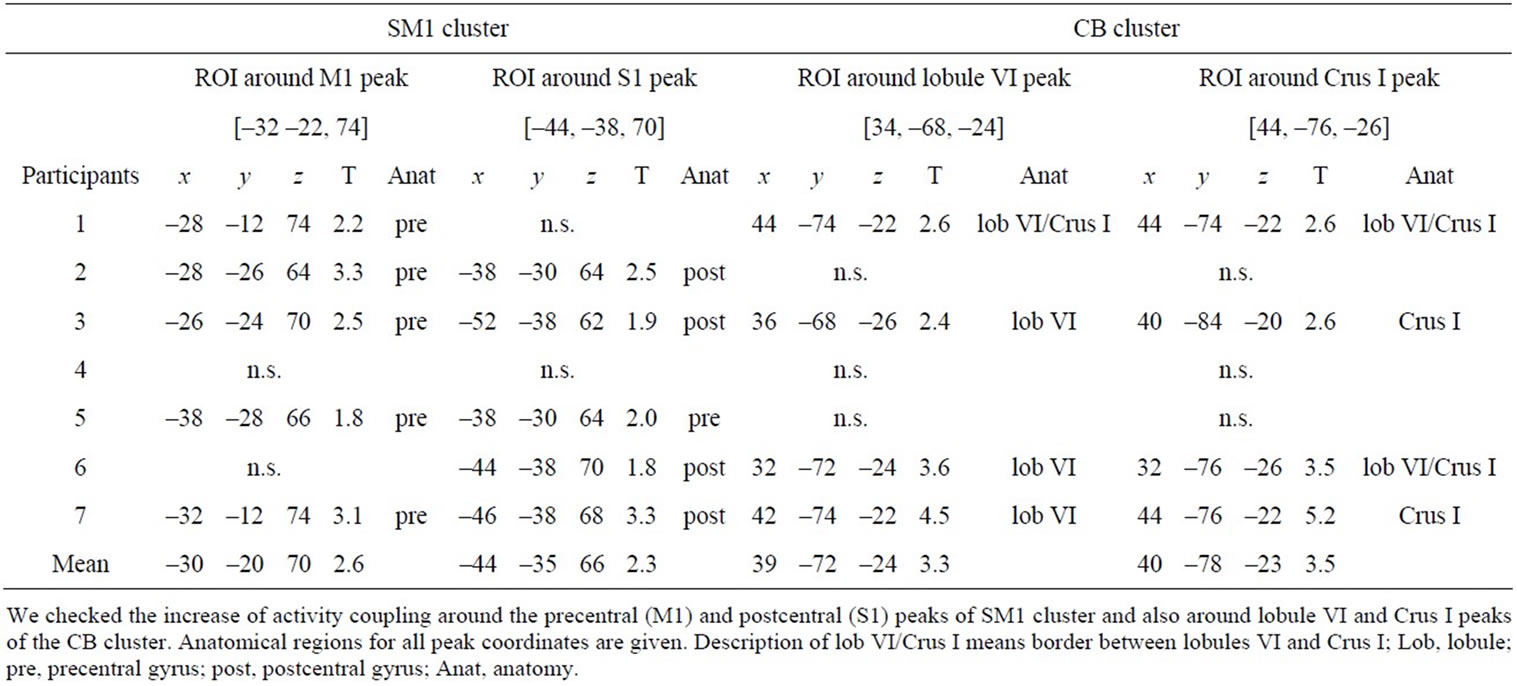
Table 5. Peak coordinates and T-values of individual coupled activity in sensorimotor cortices (SM1) and cerebellar hemisphere (CB) clusters through Sets 2, 3, and 4 compared with Set 1.
3.3. Brain Activity
The motor task activated a wide range of sensory-motor-related regions, including M1, the dorsal premotor cortex, the medial-wall motor regions, the primary somatosensory cortex, the inferior frontal cortices, the parietal operculum, the basal ganglia (BG), and the cerebellum (main effect of the task), which matched previous findings [11]. The brain regions active during the task were highly similar between the thenar-stimulation and control experiments (Figures 4(a) and (b)).
In the thenar-stimulation experiment, when we directly compared the activity in Sets 2, 3 and 4 with that in Set 1, we found no significant quantitative change of brain activation in association with the performance improvement. However, in the PPI analysis, we found that the left BG increased its activity coupling with M1 [mean coordinates across participants x, y, z = (–41, –27, +64), Figure 5(a)] as a general feature through Sets 2, 3 and 4 when compared with Set 1 (Figure 5(b)). The BG activity was located in the caudal portion of the putamen [peak coordinates of activity = (–32, –12, –4)]. This portion corresponded to the sensorimotor territory of the BG, which appears to form a cortico-striatal circuit with M1 within the same hemisphere in humans [26,27]. When we examined the influence from the vermis [mean coordinates across participants = (7, –64, –17), Figure 6(a)], we also found increased activity couplings in the left sensorimotor cortices (SM1; Figure 6(c)) and in the right cerebellar hemisphere (CB; Figure 6(d)). The left SM1 cluster was located in the precentral (primary motor cortex; M1) and postcentral (primary somatosensory cortex; S1) gyri and covered the index M1 area. In the cluster, we identified peaks in the precentral gyrus (–32, –22, 74) and in the postcentral gyrus (–44, –38, 70). The right CB cluster was located in lobule VI and Crus I, and we found peaks in lobule VI (34, –68, –24) and in Crus I (44, –76, –26). Importantly, among all the tested index areas, the left M1 and right vermis were the only regions that significantly influenced other brain regions and these enhanced activity couplings were not observed in the control experiment.
The increased activity coupling through the subsets of Sets 2, 3 and 4 (=general feature) was confirmed in six of seven participants in the BG region (Table 4) and in five and four participants in the SM1 and CB regions, respectively (Table 5). Thus, the increased activity couplings detected in the group analysis were representative for the majority of the participants. We also confirmed increased activity coupling of each region when we separately compared each subset (Sets 2, 3 and 4) with Set 1 (Tables 2 and 3). This means that the increased activity coupling of these regions remained even in Set 4 after we stopped the stimulation (neuronal residual effect).
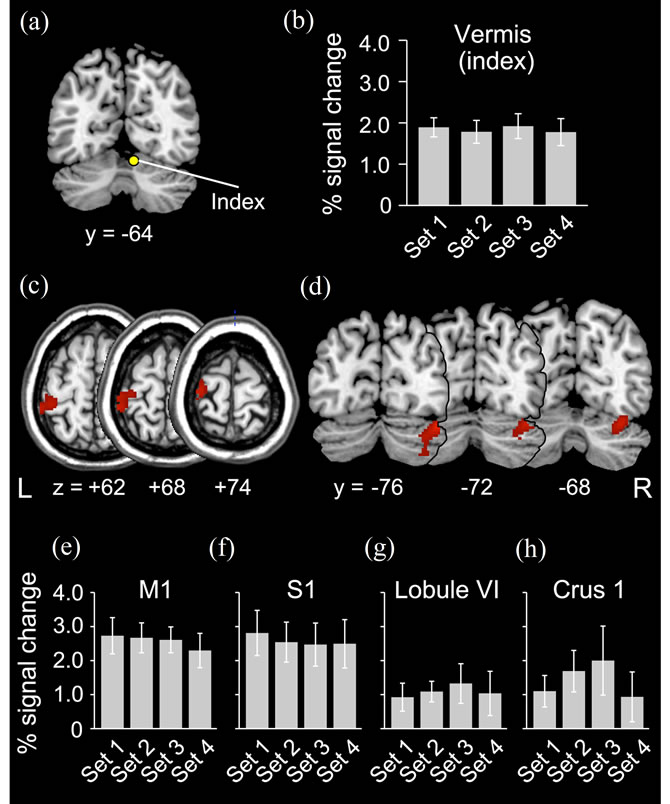
Figure 6. PPI results from vermis. (a) Index right vermis [mean coordinates across participants x, y, z = (7, –64, –17)] for PPI analysis; (b) Change of index vermis activity during the task in 4 subsets (x axis). Average percent increase of BOLD signal across participants (y axis) is shown. Bars indicate SEM. (c) and (d) Sensorimotor cortices (SM1) and cerebellar hemisphere (CB) regions showing enhanced activity coupling with the index vermis in association with performance improvement (general feature). Horizontal sections (from z = +62 to z = +74; SM1) and coronal sections (from y = –76 to y = –68; CB) are displayed. (e)-(h) Change of activity in left M1, S1, right lobule VI and Crus I during the task in 4 subsets (x axis). Average percent increase of BOLD signal across participants (y axis) is shown. Bars indicate SEM.
In the VOI analyses where we carefully looked at the local change of the brain activity in the index M1 and the identified BG region, we found that the M1 activity in the three (Sets 2, 3 and 4) subsets remained the same [F (3, 18) = 1.6, p = 0.23], and the BG activity gradually decreased [F(3, 15) = 5.6, p < 0.01] when compared with Set 1 (Figures 5(c) and (d)). When we performed these analyses for the index vermis, the identified SM1, and CB regions, we also found that the activities in these regions remained the same (p > 0.4, Figures 6(b), (e)-(h)). Thus, the enhanced activity couplings in the present study appeared to occur without activity increase of these regions. This clearly rejected the possibility that the enhanced coupling was merely due to the increase of brain activity in these regions, which is often observed in association with an increase of movement frequency.
4. Discussion
The short-period thenar stimulation just prior to initiating the motor task rapidly upgraded the well-learned hand motor skill, and the activity couplings in the cortico (M1)- subcortical motor circuits increased in association with the performance improvement with no quantitative increase of brain activities. These activity couplings were not observed in the control experiment, where no performance improvement was obtained even when the participants repeated the task. These evidences indicate that the plastic changes might occur in the cortico-subcortical motor circuits in association with the rapid improvement of the well-learned motor skill.
In our previous behavioral study [3], after conducting many control experiments, we showed that the behavioral improvement following the stimulation can be attributed neither to changes in the volitional effort (motivation) and in the motor strategy nor to placebo effects from the stimulation. Thus, the present performance improvement might reflect the net effect of the somatic stimulation, which can modulate neuronal activity in the CNS. In the present study, we were unable to elucidate the causal relationship between the behavioral and neuronal changes. However, since the present stimulation elicited clear tingling and muscle-stimulation sensations, it probably recruited the sensory afferents and these inputs reached the CNS and were distributed in the sensory-motor network [28]. Combined with the evidences that short-period muscle afferent stimulation modulates the activity in the human central motor network including the cortico-striatal and cortico-cerebellar motor circuits [5], and that short-period electrical afferent stimulation can modulate neuronal discharge in the cortico-striatal motor circuit of animals [29,30], it is hard to deny the possibility that the current stimulation modulated neuronal activity in the central cortico-subcortical motor circuits before the participants initiated the motor task. Indeed, BG cells exhibit short-latency neuronal responses to sensory signals transmitted through the cerebral cortices [31], and in animals sensory signals may modulate the neuronal activity of M1 via spinocerebellum [32]. Thus, we speculate that the neuronal modulation by artificial thenar stimulation might change the efficacy of the pre-existing synaptic connections in the cortico-subcortical motor circuits [c.f., 33-35], so as to entail a state of readiness for the subsequent performance improvement.
In the literature, greater modulation of the connectivity in the cortical motor network is reported during the early learning stage of a novel motor skill, but little change is observed once people have acquired a motor skill even when they repeat the learned task [7]. In addition, the progress of the automaticity of a motor skill is accompanied by increased connectivity, especially in brain networks that include subcortical structures, i.e., the BG and the cerebellum [8]. Thus, once a motor skill is acquired, it seems that the connectivity in the motor network that includes M1 does not substantially change in the natural learning process. The relatively stable connectivity in this network also appears to be confirmed in our control experiment. Hence, M1 seems to mainly act in the execution mode at the later stage of motor skill learning. This merely executive role of M1 at the later stage appears to be in contrast to the involvement of M1 in early motor learning and consolidation [36-40]. If one considers that a substantial gain in performance improvement is normally observed at an early stage of motor skill learning, M1’s merely executive role at the later stage might be related with the behavioral plateau in motor skill learning. In contrast to previous reports, we found in the present study that the connectivity in the M1 network (both cortico-striatal and cortico-cerebellar circuits) changed in association with the improvement of the welllearned motor skill. Our results suggest that, when the acquired motor skill improves, a plastic change in the M1 network may occur even at the later learning stage. Since no performance improvement was accompanied by stable connectivity in this network (see control experiment), the plastic change in the cortico-subcortical motor networks seems to be necessary for further upgrading of the welllearned motor skill.
In the compensatory experiment outside the scanner, we found that performance improvement (=increase of movement cycles) was associated with the reduction of the thumb displacement per cycle. Even though this finding belonged to another experiment outside the scanner, we believed that this is very likely the case in the scanner. Because in our previous behavioral study [3], we demonstrated that thenar stimulation reduces the kinematic amplitude and the muscular activity of the finger movement per cycle in subsequent motor performance and that this efficient control could be the key for the performance improvement. In this previous study, we measured the kinematic amplitude, not only from the thumb but also from the ring finger, and confirmed the reduction of kinematic amplitude per cycle in both fingers. Thus, the present reduction of thumb displacement per cycle might represent general kinematic changes across fingers. Importantly, despite the evidence that the movement cycle increased in Sets 2, 3 and 4 as compared with Set 1, we found that the total amount of thumb displacement in an epoch remained almost the same across subsets. Hence, it appeared that the stimulation enabled the participants to increase the movement cycle by scaling the kinematic amplitude of each component of the cyclic movements. If the same behavioral phenomenon occurred in the scanner, we expect that the M1 activity, which normally well reflects motor output [41,42], would remain unchanged, even when the stimulation increased the movement cycle. In support of this view, we found no quantitative change of M1 activation in Sets 2, 3 and 4 as compared with Set 1. Thus, the present plastic changes in the cortico-subcortical motor networks might be associated with the qualitative change in the style of the execution mode of M1 pertaining to the well-learned motor skill in a way that facilitates efficient motor control.
In the present study, we were unable to specify the exact effects of the plastic changes in the cortico-striatal and cortico-cerebellar circuits. However, one may presume slightly distinct roles between these two circuits, as suggested in previous studies [43-45].
BG, which is one of the key brain structures in motor skill learning [43,44,46], has clear functional segregation in its sub-regions. Rostrodorsal (associative) putamen involves the early stage of motor skill learning, but at the later stage where the learning is progressed, caudoventral (sensorimotor) putamen plays a dominant role in motor control both in humans [47,48] and animals [2,49]. Thus, the latter is thought to be associated with speedy and automatic control of an acquired motor skill at a later stage of motor skill learning [43,46,47]. Hence, we may also assume in the present study that the cortico-striatal circuit played important roles when the present very-well trained participants performed the well-learned motor skill. If one considers the general notion that BG can play bootstrapping roles to upand down-regulate M1 activity and may contribute to building a precise sequence of temporally ordered inhibition and activation of motor programs through its multiple-pathway organization in primates [50-52], the present plastic change in this circuit might affect the style of motor control, although this could also be due to the possible change in the influence of BG on the brainstem that may regulate muscle tone [53].
As for the cortico-cerebellar circuit, it is now anatomically shown in primates that the cerebellar vermis (VI) forms a motor circuit with M1, which also forms a motor loop with lobule VI of the cerebellar hemisphere [54,55]. Functionally, the vermis receives somatic (kinesthetic) inputs from the hand in humans [5] and thus can be considered the spinocerebellum, which receives rich sensory signals directly from the spinal cord. This is a striking difference between the cerebellum and BG, which suggests a slightly different role of the corticocerebellar circuit from the cortico-striatal one. By considering the above evidences, we speculate that the vermis plays important roles in the acquisition of sensory signals in the context of motor control [56]. If one relies on this view, the degree of sensory-motor coupling, i.e., how much the brain incorporates sensory signals into motor control, would be changed by the plastic change in the cortico-cerebellar circuit, which might also affect the style of motor control.
Another important finding in the current study was that the improved performance remained even after the application of the stimulation ended (behavioral residual effect). This seemed to be associated with the preservation of enhanced activity couplings in the cortico-subcortical motor circuits (neuronal residual effect). Thus, once the neuronal substrate was upgraded in association with the performance improvement, it might be preserved in the brain in a way that allows the improved performance to be sustained. In our previous study, we found that when people repeated daily training of this task combined with stimulation applications, the improved effect obtained in one experimental day partially carried over to the next day, thereby promoting daily improvement of the plateaued performance [3]. Thus, the routine use of the upgraded neuronal substrate when performing this task might reinforce its consolidation in the CNS through repetition of motor practice at higher performance levels. The present findings might also indicate that the preservation of enhanced activity couplings in the cortico-subcortical motor circuits might be part of the neuronal entity for the central consolidation that permits daily improvement of the plateaued performance.
In summary, the rapid improvement of well-learned hand motor skill was possible with the aid of sensory stimulation prior to the task, and the enhanced activity couplings in the cortico-subcortical motor circuits underlay this behavioral change. Thus, M1 not only contributes to early motor learning and consolidation but also involves upgrading of a well-learned motor skill by changing the functional connectivity in its cortico-subcortical motor circuits, which could be one key to overcome the learning plateau.
REFERENCES
- W. Bryan and N. Harter, “Studies in the Physiology and Psychology of Telegraphic Language,” Psychological Review, Vol. 4, No. 1, 1897, pp. 27-53. doi:10.1037/h0073806
- H. H. Yin, S. P. Mulcare, M. R. F. Hilario, E. Clouse, T. Holloway, M. I. Davis, A. C. Hansson, D. M. Lovinger and R. M. Costa, “Dynamic Reorganization of Striatal Circuits during the Acquisition and Consolidation of a Skill,” Nature Neuroscience, Vol. 12, No. 3, 2009, pp. 333-341. doi:10.1038/nn.2261
- S. Uehara, I. Nambu, S. Tomatsu, J. Lee, S. Kakei and E. Naito, “Improving Human Plateaued Motor Skill with Somatic Stimulation,” PLoS One, Vol. 6, No. 10, 2011, e25670. doi:10.1371/journal.pone.0025670
- L. G. Ungerleider, J. Doyon and A. Karni, “Imaging Brain Plasticity during Motor Skill Learning,” Neurobiology of Learning and Memory, Vol. 78, No. 3, 2002, pp. 553-564. doi:10.1006/nlme.2002.4091
- E. Naito, T. Nakashima, T. Kito, Y. Aramaki, T. Okada and N. Sadato, “Human Limb-Specific and Non-LimbSpecific Brain Representations during Kinesthetic Illusory Movements of the Upper and Lower Extremities,” European Journal of Neuroscience, Vol. 25, No. 11, 2007, pp. 3476-3487. doi:10.1111/j.1460-9568.2007.05587.x
- I. Toni, J. Rowe, K. E. Stephan and R. E. Passingham, “Changes of Cortico-Striatal Effective Connectivity during Visuomotor Learning,” Cerebral Cortex, Vol. 12, No. 10, 2002, pp. 1040-1047. doi:10.1093/cercor/12.10.1040
- F. T. Sun, L. M. Miller, A. A. Rao and M. D’Esposito, “Functional Connectivity of Cortical Networks Involved in Bimanual Motor Sequence Learning,” Cerebral Cortex, Vol. 17, No. 5, 2007, pp. 1227-1234. doi:10.1093/cercor/bhl033
- T. Wu, P. Chan and M. Hallett, “Modifications of the Interactions in the Motor Networks When a Movement Becomes Automatic,” Journal of Physiology, Vol. 586, No. 17, 2008, pp. 4295-4304. doi:10.1113/jphysiol.2008.153445
- T. Wu, P. Chan and M. Hallett, “Effective Connectivity of Neural Networks in Automatic Movements in Parkinson’s Disease,” NeuroImage, Vol. 49, No. 3, 2010, pp. 2581-2587. doi:10.1016/j.neuroimage.2009.10.051
- R. C. Oldfield, “The Assessment and Analysis of Handedness: The Edinburgh Inventory,” Neuropsychologia, Vol. 9, No. 1, 1971, pp. 97-113. doi:10.1016/0028-3932(71)90067-4
- R. Kawashima, M. Matsumura, N. Sadato, E. Naito, A. Waki, S. Nakamura, K. Matsunami, H. Fukuda and Y. Yonekura, “Regional Cerebral Blood Flow Changes in Human Brain Related to Ipsilateral and Contralateral Complex Hand Movements—A PET Study,” European Journal of Neuroscience, Vol. 10, No. 7, 1998, pp. 2254- 2260. doi:10.1046/j.1460-9568.1998.00237.x
- M. Matsumura, N. Sadato, T. Kochiyama, S. Nakamura, E. Naito, K. Matsunami, R. Kawashima, H. Fukuda and Y. Yonekura, “Role of the Cerebellum in Implicit Motor Skill Learning: A PET Study,” Brain Research Bulletin, Vol. 63, No. 6, 2004, pp. 471-483. doi:10.1016/j.brainresbull.2004.04.008
- U. Proske, D. L. Morgan and J. E. Gregory, “Thixotropy in Skeletal Muscle and in Muscle Spindles: A Review,” Progress in Neurobiology, Vol. 41, No. 6, 1993, pp. 705- 721. doi:10.1016/0301-0082(93)90032-N
- E. Naito, F. Scheperjans, S. B. Eickhoff, K. Amunts, P. E. Roland, K. Zilles and H. H. Ehrsson, “Human Superior Parietal Lobule Is Involved in Somatic Perception of Bimanual Interaction with an External Object,” Journal of Neurophysiology, Vol. 99, No. 2, 2008, pp. 695-703. doi:10.1152/jn.00529.2007
- K. J. Friston, C. Buechel, G. R. Fink, J. Morris, E. Rolls and R. J. Dolan, “Psychophysiological and Modulatory Interactions in Neuroimaging,” NeuroImage, Vol. 6, No. 3, 1997, pp. 218-229. doi:10.1006/nimg.1997.0291
- N. Hagura, Y. Oouchida, Y. Aramaki, T. Okada, M. Matsumura, N. Sadato and E. Naito, “Visuokinesthetic Perception of Hand Movement Is Mediated by CerebroCerebellar Interaction between the Left Cerebellum and Right Parietal Cortex,” Cerebral Cortex, Vol. 19, No. 1, 2009, pp. 176-186. doi:10.1093/cercor/bhn068
- Y. Yamakawa, R. Kanai, M. Matsumura and E. Naito, “Social Distance Evaluation in Human Parietal Cortex,” PLoS One, Vol. 4, No. 2, 2009, e4360. doi:10.1371/journal.pone.0004360
- E. Naito, P. E. Roland and H. H. Ehrsson, “I Feel My Hand Moving: A New Role of the Primary Motor Cortex in Somatic Perception of Limb Movement,” Neuron, Vol. 36, No. 36, 2002, pp. 979-988. doi:10.1016/S0896-6273(02)00980-7
- T. Talairach and P. Tournoux, “Co-Planar Stereotaxic Atlas of the Human Brain,” Thieme, New York, 1988.
- J. D. Schmahmann, J. Doyon, A. W. Toga, M. Petrides and A. C. Evans, “MRI Atlas of the Human Cerebellum,” Academic Press, San Diego, 2000.
- S. B. Eickhoff, K. E. Stephan, H. Mohlberg, C. Grefkes, G. R. Fink, K. Amunts and K. Zilles, “A New SPM Toolbox for Combining Probabilistic Cytoarchitectonic Maps and Functional Imaging Data,” NeuroImage, Vol. 25, No. 4, 2005, pp. 1325-1335. doi:10.1016/j.neuroimage.2004.12.034
- E. Naito and H. H. Ehrsson, “Somatic Sensation of HandObject Interactive Movement Is Associated with Activity in the Left Inferior Parietal Cortex,” Journal of Neuroscience, Vol. 26, No. 14, 2006, pp. 3783-3790. doi:10.1523/JNEUROSCI.4835-05.2006
- N. Sadato, V. Ibanez, M. P. Deiber, G. Campbell, M. Leonardo and M. Hallett, ”Frequency-Dependent Changes of Regional Cerebral Blood Flow during Finger Movements,” Journal of Cerebral Blood Flow & Metabolism, Vol. 16, No. 1, 1996, pp. 23-33. doi:10.1097/00004647-199601000-00003
- R. S. Turner, S. T. Grafton, J. R. Votaw, M. R. Delong and J. M. Hoffman, “Motor Subcircuits Mediating the Control of Movement Velocity: A PET Study,” Journal of Neurophysiology, Vol. 80, No. 4, 1998, pp. 2162-2176.
- S. Lehericy, E. Bardinet, L. Tremblay, P. F. Van de Moortele, J. B. Pochon, D. Dormont, D. S. Kim, J. Yelnik and K. Ugurbil, “Motor Control in Basal Ganglia Circuits Using fMRI and Brain Atlas Approaches,” Cerebral Cortex, Vol. 16, No. 2, 2006, pp. 149-161. doi:10.1093/cercor/bhi089
- S. Lehericy, M. Ducros, A. Krainik, C. Francois, P. F. Van de Moortele, K. Ugurbil and D. S. Kim, “3-D Diffusion Tensor Axonal Tracking Shows Distinct SMA and Pre-SMA Projections to the Human Striatum,” Cerebral Cortex, Vol. 14, No. 12, 2004, pp. 1302-1309. doi:10.1093/cercor/bhh091
- S. Lehericy, M. Ducros, P. F. Van de Moortele, C. Francois, L. Thivard, C. Poupon, N. Swindale, K. Ugurbil and D. S. Kim, “Diffusion Tensor Fiber Tracking Shows Distinct Corticostriatal Circuits in Humans,” Annals of Neurology, Vol. 55, No. 4, 2004, pp. 522-529. doi:10.1002/ana.20030
- E. Naito, “Sensing Limb Movements in the Motor Cortex: How Humans Sense Limb Movement,” Neuroscientist, Vol. 10, No. 1, 2004, pp. 73-82. doi:10.1177/1073858403259628
- R. Fuentes, P. Petersson, W. B. Siesser, M. G. Caron and M. A. Nicolelis, “Spinal Cord Stimulation Restores Locomotion in Animal Models of Parkinson’s Disease,” Science, Vol. 323, No. 5921, 2009, pp. 1578-1582. doi:10.1126/science.1164901
- R. Fuentes, P. Petersson and M. A. Nicolelis, “Restoration of Locomotive Function in Parkinson’s Disease by Spinal Cord Stimulation: Mechanistic Approach,” European Journal of Neuroscience, Vol. 32, No. 7, 2010, pp. 1100-1108. doi:10.1111/j.1460-9568.2010.07417.x
- M. R. De Long, M. D. Crutcher and A. P. Georgopoulous, “Primate Globus Pallidus and Subthalamic Nucleus: Functional Organization,” Journal of Neurophysiology, Vol. 53, No. 2, 1985, pp. 530-543.
- A. R. Luft, M. U. Manto and N. O. B. Taib, “Modulation of Motor Cortex Excitability by Sustained Peripheral Stimulation: The Interaction between the Motor Cortex and the Cerebellum,” Cerebellum, Vol. 4, No. 2, 2005, pp. 90-96. doi:10.1080/14734220410019084
- J. A. Kleim, T. M. Hogg, P. M. VandenBerg, N. R. Cooper, R. Bruneau and M. Remple, “Cortical Synaptogenesis and Motor Map Reorganization Occur during Late, But Not Early, Phase of Motor Skill Learning,” The Journal of Neuroscience, Vol. 24, No. 3, 2004, pp. 628- 633. doi:10.1523/JNEUROSCI.3440-03.2004
- K. Rosenkranz, A. Kacar and J. C. Rothwell, “Differential Modulation of Motor Cortical Plasticity and Excitability in Early and Late Phases of Human Motor Learning,” Journal of Neuroscience, Vol. 27, No. 44, 2007, pp. 12058-12066. doi:10.1523/JNEUROSCI.2663-07.2007
- T. H. Xu, X. Z. Yu, A. J. Perlik, W. F. Tobin, J. A. Zweig, K. Tennant, T. Jones and Y. Zuo, “Rapid Formation and Selective Stabilization of Synapses for Enduring Motor Memories,” Nature, Vol. 462, No. 7275, 2009, pp. 915- 919. doi:10.1038/nature08389
- A. Pascual-Leone, J. Grafman and M. Hallett, “Modulation of Motor Output Maps during Development of Implicit and Explicit Knowledge,” Science, Vol. 263, No. 5151, 1994, pp. 1287-1289. doi:10.1126/science.8122113
- A. Pascual-Leone, N. Dang, L. G. Cohen, J. P. BrasilNeto, A. Cammarota and M. Hallett, “Modulation of Muscle Responses Evoked by Transcranial Magnetic Stimulation during the Acquisition of New Fine Motor Skills,” Journal of Neurophysiology, Vol. 74, No. 3, 1995, pp. 1037-1045.
- A. Karni, G. Meyer, P. Jezzard, M. M. Adams, R. Turner and L. G. Ungerleider, “Functional MRI Evidence for Adult Motor Cortex Plasticity during Motor Skill Learning,” Nature, Vol. 377, No. 6545, 1995, pp. 155-158. doi:10.1038/377155a0
- W. Muellbacher, U. Ziemann, J. Wissel, N. Dang, M. Kofler, S. Facchini, B. Boroojerdi, W. Poewe and M. Hallett, “Early Consolidation in Human Primary Motor Cortex,” Nature, Vol. 415, No. 6872, 2002, pp. 640-644. doi:10.1038/nature712
- J. Reis, H. M. Schambra, L. G. Cohen, E. R. Buch, B. Fritsch, E. Zarahn, P. A. Celnik and J. W. Krakauer, “Noninvasive Cortical Stimulation Enhances Motor Skill Acquisition over Multiple Days through and Effect on Consolidataion,” Proceedings of the National Academy of Sciences of USA, Vol. 106, No. 5, 2009, pp. 1290-1295. doi:10.1073/pnas.0805413106
- P. D. Cheney and E. E. Fetz, “Functional Classes of Primate Corticomotoneuronal Cells and Their Relation to Active Force,” Journal of Neurophysiology, Vol. 44, No. 4, 1980, pp. 773-791.
- C. Dettmers, G. R. Fink, R. N. Lemon, K. M. Stephan, R. E. Passingham, D. Silbersweig, A. Holmes, M. C. Ridding, D. J. Brooks and R. S. Frackowiak, “Relation between Cerebral Activity and Force in the Motor Areas of the Human Brain,” Journal of Neurophysiology, Vol. 74, No. 2, 1995, pp. 802-815.
- O. Hikosaka, K. Nakamura, K. Sakai and H. Nakahara, “Central Mechanisms of Motor Skill Learning,” Current Opinion in Neurobiology, Vol. 12, No. 2, 2002, pp. 217- 222. doi:10.1016/S0959-4388(02)00307-0
- J. Doyon and H. Benali, “Reorganization and Plasticity in the Adult Brain during Learning of Motor Skills,” Current Opinion in Neurobiology, Vol. 15, No. 2, 2005, pp. 161-167. doi:10.1016/j.conb.2005.03.004
- K. Debas, J. Carrier, P. Orban, M. Barakat, O. Lungu, G. Vandewalle, A. H. Tahar, P. Bellec, A. Karni, L. G. Ungerleider, H. Benali and J. Doyon, “Brain Plasticity Related to the Consolidation of Motor Sequence Learning and Motor Adaptation,” Proceedings of the National Academy of Sciences of USA, Vol. 107, No. 41, 2010, pp. 17839-17844. doi:10.1073/pnas.1013176107
- O. Hikosaka, H. Nakahara, M. K. Rand, K. Sakai K, X. F. Lu, K. Nakamura, S. Miyachi and K. Doya, “Parallel Neural Networks for Learning Sequential Procedures,” Trends in Neurosciences, Vol. 22, No. 10, 1999, pp. 464-471. doi:10.1016/S0166-2236(99)01439-3
- S. Lehericy, H. Benali, P. F. Van de Moortele, M. Pelegrini-Issac, T. Waechter, K. Ugurbil and J. Doyon, “Distinct Basal Ganglia Territories Are Engaged in Early and Advanced Motor Sequence Learning,” Proceedings of the National Academy of Sciences of USA, Vol. 102, No. 35, 2005, pp. 12566-12571. doi:10.1073/pnas.0502762102
- D. Coynel, G. Marrelec, V. Perlbarq, M. Peleqrini-Issac, P. F. Van de Moortele, K. Ugurbil, J. Doyon, H. Benali and S. Lehericy, “Dynamics of Motor-Related Functional Integration during Motor Sequence Learning,” NeuroImage, Vol. 49, No. 1, 2010, pp. 759-766. doi:10.1016/j.neuroimage.2009.08.048
- S. Miyachi, O. Hikosaka, K. Miyashita, Z. Karadi and M. K. Rand, “Differential Roles of Monkey Striatum in Learning of Sequential Hand Movement,” Experimental Brain Research, Vol. 115, No. 1, 1997, pp. 1-5. doi:10.1007/PL00005669
- G. E. Alexander and M. D. Crutcher, “Functional Architecture of Basal Ganglia Circuits: Neural Substrates of Parallel Processing,” Trends in Neurosciences, Vol. 13, No. 7, 1990, pp. 266-271. doi:10.1016/0166-2236(90)90107-L
- J. W. Mink, “The Basal Ganglia: Focused Selection and Inhibition of Competing Motor Programs,” Progress in Neurobiology, Vol. 50, No. 4, 1996, pp. 381-425. doi:10.1016/S0301-0082(96)00042-1
- L. A. Boyd, J. D. Edwards, C. S. Sienqsukon, E. D. Vidoni, B. D. Wessel and M. A. Linsdell, “Motor Sequence Chunking Is Impaired by Basal Ganglia Stroke,” Neurobiology of Learning and Memory, Vol. 92, No. 1, 2009, pp. 35-44. doi:10.1016/j.nlm.2009.02.009
- K. Takakusaki, K. Saitoh, H. Harada and M. Kashiwayanagi, “Role of Basal Ganglia-Brainstem Pathways in the Control of Motor Behaviors,” Neuroscience Research, Vol. 50, No. 2, 2004, pp. 137-151. doi:10.1016/j.neures.2004.06.015
- P. L. Strick, R. P. Dum and J. A. Fiez, “Cerebellum and Nonmotor Function,” Annual Review of Neuroscience, Vol. 32, 2009, pp. 413-434. doi:10.1146/annurev.neuro.31.060407.125606
- K. A. Coffman, R. P. Dum and P. L. Strick, “Cerebellar Vermis Is a Target of Projections from the Motor Areas in the Cerebral Cortex,” Proceedings of the National Academy of Sciences of USA, Vol. 108, No. 38, 2011, pp. 16068-16073. doi:10.1073/pnas.1107904108
- M. Manto, J. M. Bower, A. B. Conforto, J. M. DelgadoGarcia, S. N. da Guarda, M. Gerwig, C. Habas, N. Hagura, R. B. Ivry, P. Marien, M. Molinari, E. Naito, D. A. Nowak, N. O. B. Taib, D. Pelisson, C. D. Tesche, C. Tilikete and D. Timmann, “Roles of the Cerebellum in Motor Control—The Diversity of Ideas on Cerebellar Involvement in Movement,” Cerebellum, Vol. 11, No. 2, 2012, pp. 457-487.
NOTES
*These authors contributed equally to this work.