International Journal of Geosciences
Vol.07 No.03(2016), Article ID:64968,10 pages
10.4236/ijg.2016.73026
Assessment of Hydrocarbon Potential in Owem Field in Niger Delta, Nigeria
Godwin Omokenu Emujakporue
Department of Physics, University of Port Harcourt, Port Harcourt, Nigeria
![]()
Copyright © 2016 by author and Scientific Research Publishing Inc.
This work is licensed under the Creative Commons Attribution International License (CC BY).
http://creativecommons.org/licenses/by/4.0/


Received 27 January 2016; accepted 21 March 2016; published 24 March 2016
ABSTRACT
Seismic data were integrated with well log to define the subsurface geometry and hydrocarbon trapping potential of Owem field, onshore Niger Delta. The research methodology involved horizon and fault interpretation to produce subsurface structural map. Wireline logs signatures were employed to identify hydrocarbon bearing sand and compute reservoir petrophysical parameters for hydrocarbon reservoir analysis. Two horizons HA and HB were identified and mapped and a time structural map was produced. Two reservoirs R1 and R2 were delineated in the wells A and B. The computed petrophysical parameters for well A showed that the thickness of Reservoir R1 and R2 are 11.5 and 12.5 meters respectively while the porosity and hydrocarbon saturation varies between 0.16 - 0.24 and 0.6 - 0.8 respectively. Similarly the average thickness and porosity of R1 and R2 for well B is about 18.0 meters and 0.12 while the hydrocarbon saturation varies between 0.7 - 0.8. The integration of seismic and well logs data has proved to be a useful tool in the reservoir analysis of hydrocarbon.
Keywords:
Seismic, Well Logs, Structural Map and Hydrocarbon

1. Introduction
The Niger Delta is ranked among the major prolific deltaic hydrocarbon provinces in the world and is the most significant in the West African continental margin [1] . In Nigeria, hydrocarbon is the major revenue base for national development and as such it demands greater efforts from both the government and the research institutions that this non-renewable energy source be adequately and optimally tapped [2] .
Hydrocarbon in the Niger Delta is mainly produced from sandstones and unconsolidated sands predominantly in the Agbada Formation. The objectives of hydrocarbon exploration are to identify and delineate structural and stratigraphic traps suitable for economically exploitable accumulations and to delineate the extent of discoveries in field appraisals and development. These traps could be very subtle and complex and are therefore, difficult to map accurately. Significant advances in seismic and borehole geophysics has made it possible to map such structural and stratigraphic configurations with high degree of reliability and precision [3] .
Seismic and well log data are widely used in hydrocarbon exploration to map the subsurface and to evaluate the hydrocarbon potential in the reservoir. The two data sources are complementary; seismic profiles provide an almost continuous lateral view of the subsurface by defining its geometry and providing an estimate of the acoustic impedance which is related to the formation densities and velocities whereas well logs yield fine vertical resolution of the geology at the borehole. Seismic profiles can resolve, with relatively high precision, the structural and stratigraphic changes from the arrival times and amplitudes of the reflection events. The bandwidth of seismic data constrains the vertical resolution of the subsurface. High frequency data are essential for delineating subtle traps. Also, the seismic expression of anomalies cannot be interpreted uniquely in terms of the geologic variables. Well logs can be helpful in the interpretation of seismic profiles.
The combination of well log and seismic data would provide a high degree of reliability in providing insight to reservoir hydrocarbon volume which may be utilized in exploration evaluations and well bore planning [4] [5] . In addition, the risk associated with finding oil and gas in subtle and complex structural/stratigraphic places would be greatly minimized because such integration will help to discriminate between poor and rich reservoirs. The knowledge of the properties and extent of a hydrocarbon reservoir are important factors in estimating the hydrocarbon in place. In the present work, 2D seismic reflection data were integrated with well logs so as to define the subsurface geometry and the petrophysical parameters. This study is aimed at imaging the detail subsurface with a view to analyzing the hydrocarbon reservoir in place which may provide an insight in hydrocarbon evaluation.
2. Summary of the Geology of Niger Delta
The study area is located within the Niger Delta, Nigeria. The Niger Delta sedimentary basin is a product of triple junction phenomenon comprising the Gulf of Guinea, South Atlantic Ocean and Benue depression. It is situated in the Gulf of Guinea on the West Coast of Southern Nigeria between latitude 3˚N and 6˚N and longitudes 5˚E and 8˚E. The Niger Delta is bounded on the Northwest by a subsurface continuation of the West African shield, the Benin Flank. The Eastern edge of the basin coincides with the Calabar Flank to the south of the Oban Masif. The Niger Delta developed in late Jurassic along the failed arm during the separation process between South American and African plate [6] . The two rift arms that followed the South-Western and south- Eastern coast of Nigeria and Cameron developed into passive continental margin of West Africa while the third arm formed the Benue Trough in the Gulf of Guinea. During the rifting process in the late Mesozoic, the elastic wedge gradually progrades into the Gulf of Guinea and advanced over 200 km southwards and broadens from less than 300 km [7] .
Well sections through the Niger Delta generally display three vertical lithostratigraphic sub-divisions. These lithostratigraphic units are the Benin Formation (Oligocene-Recent), Agbada Formation (Eocene-Recent) and Akata Formation (Paleocene-Recent) [8] as shown in Figure 1. The Benin Formation is a continental deposit of alluvial and upper coastal plain sands. Itconsists predominantly of freshwater bearing massive continental sands and gravels deposited in an upper deltaic plain environment.
The Agbada Formation underlies the Benin Formation. The Agbada Formation consists of fluvial-marine sands, siltstones and shale. The sandy parts constitute the main hydrocarbon reservoirs. The grain sizes of these reservoirs range from very coarse to fine. The Formation is of a marine origin and is composed of thick shale sequences (potential source rock), turbid sand (potential reservoirs) in deep water and minor amount of clay and silt. The thickness of the Formation is over 3,700 meters [6] . The Agbada Formation is the major petroleum bearing units in the Niger delta.
The Akata Formation is formed the base of the Niger Delta lithostratigraphy. It is composed mainly of marine shale, with sandy and silky beds which are thought to have been laid down as turbidities and continental slope channel fills. It is estimated that the Formation is up to 7000 m thick. The Formation is a continuous shale unit consisting of massive dark grey uniform shale especially in the upper part. The Akata Formation is the hydrocarbon source rock in Niger delta. Since its formation, the delta has prograded southwestwards forming depobelts which are the active portion of the Niger delta. These depobelts are regarded as one of the largest regressive deltas in the world with an area of 300,000 km2 [9] .
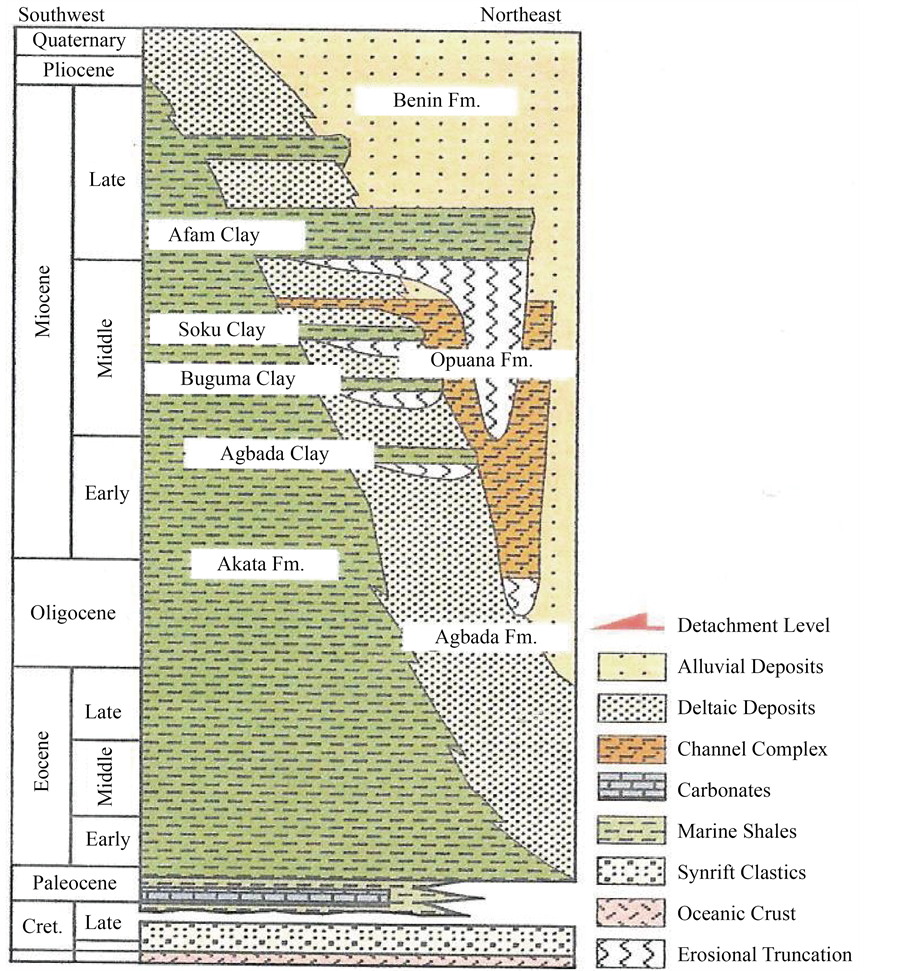
Figure 1. Stratigraphic column showing the three formation of Niger delta, modified from [7] [10] .
Most of the traps in Niger delta fields are structural although stratigraphic traps are not uncommon. The structural traps developed during synsedimentary deformation of the Agbadaparalic sequence. Structural complexity increases from the North (earlier formed depobelts) to the South in response to increasing instability of the undercompacted, over pressured shale. The primary seal rock in the Niger Delta is the interbedded shale within the Agbada Formation. The shale provides three types of seals―clays smears along faults, interbedded sealing units against which reservoir sands are juxtaposed due to faulting and vertical seals. On the flanks of the delta, major erosion events of early to middle Miocene formed canyons that are now clay filled. These clays form the top seal for some important offshore field location.
The Niger delta province is generally adjudged to contain only one identified petroleum system referred to as the Tertiary Niger Delta (Akata-Agbada) petroleum system. The Niger Delta basin to date is the prolific and economic sedimentary basin in Nigeria by virtue of the size of petroleum accumulation, discovered and produced as well as the spatial distribution of the petroleum resources to the onshore continental shelf through deep water terrains.
3. Materials and Methods
The data used for this work are composite geophysical well logs, seismic sections, base map and check shot data. The suit of geophysical logs comprised of gamma ray, resistivity, spontaneous potential, neutron and density log while the seismic sections are inline and cross-lines. These data were obtained from Total Exploration & Production Company, Nigeria limited. The data were obtained from an onshore field in the Niger Delta. The logs were obtained from two oil wells, A and B. The following steps were adopted in this work;
3.1. Lithology and Reservoir Delineation from Well Logs
The gamma ray and spontaneous logs were used in identifying the lithologies penetrated by the wells. A sharp deflection to the left side of the logs is an indication of a sand unit while deflection to the right side indicate shale unit.
The reservoir identification was carried out based on the response of the resistivity and lithology logs signature. It was observed that low gamma ray log signature with corresponding high resistivity is an indication of a hydrocarbon bearing reservoir.
3.2. Porosity Determination
The porosity of a rock is defined as the fraction or percentage of voids to the total volume of rock. Porosity of the rock formation was estimated from the density log [11] with the aid of the equation
 (1)
(1)
where
 = density of rock matrix given as 2.65 g/cm3,
 = bulk density obtained from the density log
![]() = density of water given as 1 g/cm3.
= density of water given as 1 g/cm3.
3.3. Determination of Water and Hydrocarbon Saturation
The water saturation (Sw) was estimated from the deep resitivity log. The relationship between the resistivity log and the water saturation [12] is given as;
![]() (2)
(2)
where,
Sw = water saturation,
R0 = Resistivity of rock that is 100 percent saturated with water,
Rt = True resistivity in reservoir.
The Hydrocarbon saturation of the reservoir was obtained from the water saturation by using the equation [13]
![]() (3)
(3)
where
SH = hydrocarbon saturation,
SW = water saturation.
3.4. Seismic Horizon and Fault Mapping
The preliminary seismic interpretation involved horizons and faults identification and mapping. Horizon mapping involves the picking of series of time corresponding to the depth of reservoir top in the wells on the seismic section. This process was achieved by tracking the series of time corresponding to the top of the reservoirs in the wells on the seismic section. The picked times were latter posted on the base map and then contoured by joining posted time of equal values.
Identification of faults was carried out in the seismic sections to identify areas of faulting which can acts as hydrocarbon traps. Faults were identified on the seismic section based on reflection discontinuity at fault plane. Colour pencil was used to trace the visible breaks in the seismic sections that form fault.
4. Results and Discussion
The major lithologies delineated from the gamma ray and spontaneous potential logs are sand and shale as shown in Figure 2(a) and Figure 2(b). The shale (dark colour) is associated with maximum deflection of the lithology logs while the sand (yellow) is obtained from the minimum deflection of the logs. Two reservoirs R1 and R2 were delineated from the lithology and resistivity logs in Well A and B.
![]() (a)
(a)![]() (b)
(b)
Figure 2. (a) Geophysical composite logs for well A; (b) geophysical composite logs for well B.
The computed petrophysical parameters for reservoirs in well A and B are shown in Table 1 and Table 2 respectively. The thickness of R1 and R2 for well A is 11.5 and 12.5 meters respectively. The porosity and and hydrocarbon saturation varies between 0.16 - 0.24 and 0.2 - 0.4. The hydrocarbon saturation ranges from 0.6 to 0.8.
Similarly the average thickness and porosity of R1 and R2 for well B is about 18.0 meters and 0.12. The hydrocarbon saturation varies between 0.7 - 0.8.
Two seismic horizons (HA and HB) were delineated in both the inline and cross line seismic sections based on the seismic to well ties (Figure 3 and Figure 4). The top of the reservoirs in the wells corresponds to the delineated horizons. The events were generally poor to fair but can be interpreted across the seismic sections. One growth fault was identified on the seismic section. The character of the seismic sections change with depth.

Table 1. Petrophysical parameters for well A.
Table 2. Petrophysical parameters for well B.
![]()
Figure 3. Interpreted seismic section of inline.
![]()
Figure 4. Interpreted seismic section of cross line.
The two way travel time obtained from the in-line and cross line seismic sections were posted on the base map and contoured resulting to the time structural maps of the field. The time maps of the two horizons are presented in Figure 5 and Figure 6 respectively. They show a system of rollover anticlines associated with a growth fault.
The integration of the well logs and seismic data provides insight to reservoir hydrocarbon volume which may be utilized in exploration evaluations and in well bore planning. From the well logs interpretation, two lithologies (sand and shale) were identified. These lithologies were alternated which is typical of the Agbada Formation in the Niger Delta. Two reservoirs R1 and R2 were also delineated from the resistivity and lithology logs in the two wells. The depths to top of reservoirs RI and R2 are approximately 2463 and 2500 metres. The average thicknesses of the reservoirs R1 in well A and B are 11.5 and 18.0 while that of R2 are 12.5 and 18.0 metres for well A and B respectively. The computed average porosity for R1 and R2 are 0.18 and 0.14. These values of porosity are within the range of porosity in the Niger Delta and are fairly good. The average hydrocarbon saturation values is about 0.8 and 0.65 for reservoirs A and B. The values of the hydrocarbon saturation show that the reservoirs are good. Two horizons (HA and HB) were identified in the seismic sections. The listic fault observed in the seismic section is acting as a seal to the hydrocarbon migration from the reservoirs. The time structural maps for horizons HA and HB show that the reservoirs are anticlinial structures. This type of structure is usually associated with growth faults in the Niger Delta, The volume of the reservoir was not computed because of the
![]()
Figure 5. Time structural map for horizon HA.
![]()
Figure 6. Time structural map for horizon HB.
lack of information on the dimension of the base map and seismic sections.
5. Conclusion
The integration of seismic data and well logs proved to be useful and valid tool in structure and stratigraphic mapping. These stratigraphic pays may not be effectively mapped with manual interpretation. The result of the seismic interpretation shows that, the horizons are laterally continuous. The horizons mapped are all within the Agbada Formation where most of the hydrocarbon is believed to be trapped in the Niger Delta. The result of the qualitative and quantitative interpretation of the geophysical logs show that the two observed reservoirs have appreciable thickness and porosity. The major structure responsible for the hydrocarbon entrapment in the field is an anticlinal structure and a growth fault. The geometry of the trapping system of the field and average values of the computed petrophysical data are good indicators of favourable hydrocarbon potential. Information extracted from the integration of the seismic and well logs data have resulted in more understanding of the structure, stratigraphy and hydrocarbon potentials of the Owem field, onshore Niger Delta.
Cite this paper
Godwin OmokenuEmujakporue, (2016) Assessment of Hydrocarbon Potential in Owem Field in Niger Delta, Nigeria. International Journal of Geosciences,07,335-344. doi: 10.4236/ijg.2016.73026
References
- 1. Emujakporue, G., Nwankwo, C. and Nwosu, L. (2012) Integration of Well Logs Data and Seismic Data for Prospects Evaluation of an X Field, Onshore Niger Delta, Nigeria. International Journal of Geosciences, 2, 872-877. http://dx.doi.org/10.4236/ijg.2012.324088
- 2. Oyedele, K.F., Ogagarue, D.O. and Mohammed, D.U. (2013) Integration of 3D Seismic and Well Log Data in the Optimal Reservoir Characterisation of EMI Field, Offshore Niger Delta Oil Province, Nigeria. American Journal of Scientific and Industrial Research, 4, 11-21.
- 3. Dobrin, M. (1976) Introduction to Geopghysical Prospecting. 2nd Edition, Mc-Graw Hill Books Company, New York.
- 4. Barde, J.P., Chambertain, P., Gralla, P., Harwijanto, J., Marsky, J. and Schroeter, T. (2000) Explaining a Complex Hydrocarbon System in the Permo-Triassic of the Precaspian Basin by Integration of Independent Models. Abstracts, 62nd European Association of Geoscientists ad Engineers Conference and Technical Exhibition, 2: (P.021), P.4.
- 5. Adejobi, A.R. and Olayinka, A.I. (1997) Stratigraphy and Hydrocarbon Potential of the Opuama Channel Complex Area, Western Niger Delta. Nigeria Association of Petroleum Exploration (NAPE) Bull, 12, 1-10.
- 6. Whiteman, A. (1982) Nigeria: Its Geology, Resources and Potential. Vol. 2, Graham and Trotman, London, 25-276.
- 7. Doust, H. and Omatsola, E. (1990) Niger Delta in, Divergent/Passive Margin Basin, AAPG Memoi 48; Tulsa, American Association Petroleum Geologist, 239-248.
- 8. Short, K.C. and Stauble, A.J. (1967) Outline of Geology of Niger Delta. AAPG Bulletin, 51, 761-779.
- 9. Kulke, H. (1995) Nigeria. In Kulke, H., Ed., Regional Petroleum Geology of the World, Part 11, Africa, America, Australia and Antarctica: Berlin, Gebrüder Borntraeger, 143-172.
- 10. Shannon, P.M. and Naylon, N. (1985) Petroleum Basin Studies. Graham and Trotman Limited, London, 153-169.
- 11. Schlumberger (1989) Log Interpretation, Principles and Application. Schlumberger Wireline and Testing, Houston.
- 12. Asquith, G. and Krygowski, D. (2004) Basic Well Log Analysis. AAPG Methods in Exploration Series, No. 16, 2004.
- 13. Amigun, J.O. and Odole, O.A. (2013) Petrophysical Properties Evaluation for Reservoir Characterisation of SEYI Oil Field (Niger-Delta).