International Journal of Geosciences
Vol. 3 No. 4A (2012) , Article ID: 23246 , 6 pages DOI:10.4236/ijg.2012.324088
Integration of Well Logs and Seismic Data for Prospects Evaluation of an X Field, Onshore Niger Delta, Nigeria
Department of Physics, University of Port Harcourt, Port Harcourt, Nigeria
Email: Owin2009@yahoo.com, cyrilnn@yahoo.com
Received July 10, 2012; revised August 25, 2012; accepted September 3, 2012
Keywords: Seismic Data; Well Logs; Prospect; Niger Delta
ABSTRACT
Hydrocarbon reservoir beds have been delineated using direct hydrocarbon indicator on seismic sections as well as well logs data in X field, Onshore Niger Delta. The research methodology involved horizon interpretation to produce subsurface structure map. Geophysical well log signatures were employed in identifying hydrocarbon bearing sand. The well-to-seismic tie revealed that the reservoir tied directly with hydrocarbon indicator (bright spot) on the seismic sections. The major structure responsible for the hydrocarbon entrapment is anticline. The crest of the anticline from the depth structural map occurs at 3450 metres.
1. Introduction
The Niger Delta is a proven prolific hydrocarbon system with a number of world-class oil discoveries. Hydrocarbon in the delta is mainly produced from sandstones and unconsolidated sands in the Agbada Formation. The objective of hydrocarbon exploration is to identify and delineate structural and stratigraphic traps suitable for economically exploitable accumulations and delineate the extent of discoveries in field appraisals and development. These traps could be very subtle and complex and are therefore difficult to be mapped accurately [1].
Seismic and well log data are widely used in petroleum exploration to map the subsurface. The two data sources are complementary: seismic profiles provide an almost continuous lateral view of subsurface, whereas well logs yield fine vertical resolution of the geology at the borehole. Seismic profiles can resolve, with relatively high precision, the structural and stratigraphic changes from the arrival times and amplitudes of the reflection events.
The bandwidth of seismic data constrains the vertical resolution of the subsurface. High frequency data are essential for delineating subtle traps. Also, the seismic expressions of anomalies cannot be interpreted uniquely in terms of the geologic variables. Well logs can be helpful in the interpretation of seismic profiles in both respects, viz., they can unambiguously provide, at borehole, a high-resolution estimate of many essential geologic variables. Therefore, the integration of well log and seismic data would provide a high degree of reliability in mapping subsurface structural and stratigraphic plays. It will also provide insight to reservoir hydrocarbon volume which may be utilized in exploration evaluations and in well bore planning [2,3].
The primary geophysical seismic data are often recorded in time. However, meaningful interpretation need be displayed in depth. The primary objective of geophysical seismic interpretation is to prepare contour seismic maps showing the two way time to a reflector as picked on the seismic sections. This time map must be converted to depth map through seismic time-depth conversion process. The depth conversion process is usually carried out using average velocity information obtained from well logs and check shot data. The integration of geological data with 3D seismic may lead to solving some of the problems of identifying facies and structural details [4].
Exploration and Asset development teams are composed of multiple disciplines which use different tools to analyse different data types in different disciplines. This means seismic data has not been readily available to petrophysicists and that geologic cross sections have been unavailable to seismic interpreters. Display of seismic and well data together can strengthen the interpretation of both. This research is part of the effort to use seismic and well logs data to indicate favourable areas in which exploration can be concentrated especially at deeper levels. Therefore the aims of this study are to pick key horizons, identify and map prospects and to ascertain if the structures and their closures are favourable for hydrocarbon accumulation in this onshore block using integrated geophysical approach.
Geology of the Niger Delta
The study area is located within the Niger Delta, Nigeria (Figure 1). The Niger Delta sedimentary basin is a product of triple junction phenomenon comprising the Gulf of Guinea, South Atlantic Ocean and Benue depression. It developed in late Jurassic along the failed arm during the separation process between South American and African plates [5]. The two rift arms that followed the southwestern and south-eastern coast of Nigeria and Cameroon developed into passive continental margin of West Africa while the third arm formed the Benue Trough in the Gulf of Guinea. During the rifting process in the late Mesozoic, the clastic wedge gradually progrades into the Gulf of Guinea and advanced over 200 km southwards and broadens from less than 300 km to about 500 km [6].
The geology of the Tertiary section of the Niger Delta is divided into three formations, representing prograding depositional facies distinguished mostly on the basis of sand-shale ratio [7]. They are namely Benin Formation, the Paralic Agbada Formation and Prodelta Marine Akata Formation. They range in age from Paleocene to Recent. The Benin Formation is a continental latest Eocene to recent deposit of alluvial and upper coastal plain sands. It consists predominantly of freshwater baring massive continental sands and gravels deposited in an upper deltaic plain environment. The Agbada Formation which consists of paralic Siliciclastics underlies the Benin Formation.
The Agbada Formation consists of fluvio-marine sands, siltstones and shales. The sandy parts constitute the main hydrocarbon reservoirs. The grain sizes of these reservoirs range from very coarse to fine. The Niger Delta province is generally adjudged to contain only one identified petroleum system referred to as the tertiary Niger delta (Akata-Agbada) petroleum system [8]. The Agbada Formation is of marine origin and composed of thick shale sequences (potential source rock), turbidites sand (potential reservoirs in deep water and minor amount of clay and silt. Beginning in the Paleocene and through the Recent, the Akata Formation formed during low stands, when terrestrial organic matter and clays were transported to deep-sea water areas characterized by low energy conditions and oxygen deficiency [9]. It is the major source rock in the Niger Delta.

Figure 1. Map of Niger Delta showing the location of the study area.
Most of the traps in Niger delta fields are structural although stratigraphic traps are not uncommon. The structural traps developed during synsedimentary deformation of the Agbada paralic sequence [9,10]. Structural complexity increases from the north (earlier formed depobelts) to the south in response to increasing instability of the under-compacted, over-pressured shale. [6], described a variety of structural trapping elements, including those associated with simple rollover structures clayfilled channels, structures with multiple growth faults, structures with antithetic faults and collapsed crest structures. On the flanks of the delta, stratigraphic traps are likely as important as structural traps. In this region, pockets of sandstone occur between diaperic structures. Towards the delta toe (base of distal slope) this alternating sandstone-shale sequence gradually grades to essentially sandstone. The primary seal rock in the Niger Delta is the interbedded shale within the Agbada Formation. The shale provides three types of seals—clay smears along faults, interbedded sealing units against which reservoir sands are juxtaposed due to faulting and vertical seals. On the flanks of the delta, major erosion events of early to middle Miocene formed canyons that are now clay-filled. These clays form the top seal for some important offshore field locations.
2. Materials and Methods
The data used for this study are composite geophysical well logs, seismic sections, check shot data and base map of the seismic lines which were obtained from Nigeria Agip Oil Company Limited. The geophysical logs include gamma ray, resistivity and sonic logs from four oil wells. Two seismic profiles, an arbitrary line in NW-SE direction and the other, an inline in E-W direction were interpreted. The base map of the seismic lines and the well locations are shown in Figure 2. The gamma ray and resistivity logs were used for the identification of lithologies and hydrocarbon-bearing reservoirs. The logs were also used for well correlation. The identified reservoir tops in the wells were tied to the seismic sections for horizon identification and mapping with the aid of the check shot data from the wells. The checkshot data was used for the well-to-seismic tie of the hydrocarbon reservoirs and displayed on the seismic lines they intersected. Horizons were tracked on these reflections, on both inline and crossline seismic sections across the field to produce the time structure (isochron) map. The depth structure map was produced from the time structure map using velocity information derived from check shot data.
3. Results and Discussion
Preliminary study on the well logs revealed one major hydrocarbon bearing reservoir. The results of the well logs correlation connecting the four wells in the survey area is shown in Figure 3. The gamma ray, resistivity and sonic logs characteristics were employed in the correlation analysis. The well logs correlation show a good agreement. The entire formations were considered and a
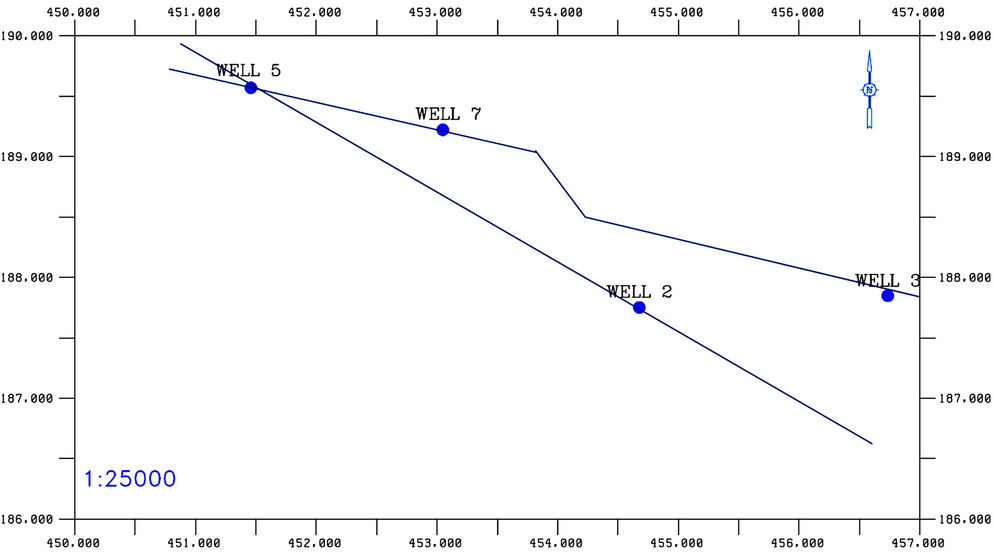
Figure 2. Base map of the study area showing well locations and seismic lines.

Figure 3. Correlation of the wells in the X field.
good agreement was observed of their continuity within the extent of the well location. Hydrocarbon reservoir was delineated on the well logs with the aid of the gamma-ray and deep resistivity logs. The top of the identified reservoir is shown in the correlation panel.
Quantitative evaluation of the well logs was not carried out because of insufficient information.
The seismic sections extend to 4.0 seconds two way travel time (Figures 4(a) and (b)). The reflection continuity below 3.2 seconds is generally poor. The character of the seismic record changes with depth. The study focuses on reflections between 1.0 second and 3.5 seconds. Reflection within this interval has good continuity and high to moderate amplitude variation. Reflections in the shallowest part of the seismic sections are parallel and nearly horizontal.
The well-to-seismic tie revealed that the hydrocarbon bearing reservoir is associated with direct hydrocarbon indicator (Bright spot) on the seismic sections. The horizon picking was initiated on the bright spot. The top of the reservoir in the wells was delineated and mapped using adequate seismic to well correlation and their seismic continuity. The depth structure map of the top of the reservoir is shown in Figure 5. Analysis of the depth structure map shows that closure exists at well 3. The contours have a perfect closure implying an anticline structure whose crest occurred at 2405 milliseconds (3450 metres).
 (a)
(a) (b)
(b)
Figure 4. (a) Interpreted inline seismic section; (b) Interpreted seismic in the NW-SE direction.
 Ɨ,–Well position
Figure 5. Depth structural map of the top of the reservoir.
4. Conclusion
The integration of seismic data and well logs proved to be a useful and valid tool in structure and stratigraphic mapping. From the well logs analysis one major reservoir was identified. The result of the qualitative interpretation of the gamma ray and resistivity logs shows that the reservoir contains hydrocarbon of appreciable thickness. The well-to-seismic tie revealed that the hydrocarbon bearing reservoir is associated with direct hydrocarbon indicator on the seismic sections. The major structure responsible for the hydrocarbon entrapment in the field is an anticlinal structure. The crest of the anticline from the depth structural map occurs at 3450 metres. Information extracted from the integration of the seismic and well logs data have resulted in more understanding of the structure, stratigraphy and hydrocarbon potentials of the “X” field, onshore Niger delta. The result suggests more development opportunities at deeper levels.
5. Acknowledgements
The authors are grateful to the Department of Petroleum Resources and Nigeria Agip Oil Company Limited for granting our request for data with which the research was accomplished.
REFERENCES
- A. P. Aizebeokhai and I. Olayinka, “Structural and Stratigraphic Mapping of Emi Field, Offshore Niger Delta,” Journal of Geology and Mining Research, Vol. 3, No. 2, 2011, pp. 25-38.
- J. P. Barde, P. Gralla, J. Haiwijano and J. Marsky, “Exploration at the Eastern Edge of the Prescapian Basin: Impact of Data Integration on upper Permian and Trasic Prospectivity,” Bulletin of the American Association of Petroleum Geologists, Vol. 86, 2002, pp. 399-415.
- A. R. Adejobi and A. I. Olayinka, “Stratigraphy and Hydrodrocarbon Potential of the Opuama Channel Complex Area, Western Niger Delta,” Nigeria Association of Petroleum Explorationists (NAPE) Bulletin, Vol. 12, 1997, pp. 1-10.
- R. J. Singh, H. L. Kharo, P Saha, S, N. Singh and M. Chandra, “Integration of Well and 3D Seismic Data for Prospect Evaluation. A Case Study,” Geohorizons, Vol. 11, 1997, pp. 1-9.
- A. Whiteman, “Nigeria: Its Geology, Resources and Potential,” Vol. 2, Graham and Trotman, London, 1982, pp. 25-276.
- H. Doust and E. M. Omatsola, “The Niger Delta,” In: J. D. Edwards and P. A. Sentugross, Eds., Divergent/Passive Margin Basins, AAPG Memoirs 45, Devon, 1990, pp. 201-238.
- H. Kulke, “Nigeria,” In: H., Kulke, Ed., Regional Petroleum Geology of the World Part, 11, Gebruder Bornbraeger, Berlin, Africa, American, Australia and Antarctica, 1995, pp. 143-172.
- L. W. T. Michele, R. C. Ronald and E. B. Michael, “The Niger Delta Petroleum System: Niger Delta Province, Nigeria, Cameroon, and Equatorial Guinea, Africa,” Open-File Report 99-50-H, United States Geological Survey, 1999.
- P. Stacher, “Present Understanding of the Niger Delta Hydrocarbon Habitat,” In: M. N. Oti and G. Postma, Eds., Geology of Deltas, FRotterdam A. A, Bakkema, 1995, pp. 57-267.
- D. D. Evamy, J. Harcmboure, P. Karmmerling, W. A. Kossp, F. A. Molloy and P. H. Rowland, “Hydrocarbon Habitat of Tertiary Niger Delta,” AAPG Bulletin, Vol. 62, No. 1, 1978, pp. 1-39.