Journal of Minerals and Materials Characterization and Engineering
Vol.1 No.2(2013), Article ID:29599,7 pages DOI:10.4236/jmmce.2013.12013
Characterization of Egyptian Manganese Ores for Production of High Carbon Ferromanganese
1Department of Steel and Ferroalloys Technology, Central Metallurgical Research and Development Institute (CMRDI), Cairo, Egypt.
2Department of Chemistry, Faculty of Science, Helwan University, Cairo, Egypt
Email: mohammedsalah2020@gmail.com
Received January 23, 2012; revised February 25, 2013; accepted March 7, 2013
Keywords: High Carbon Ferromanganese; Manganese Ores; Ore Reactivity; CO Reduction; Porosity
ABSTRACT
This work aims at studying the reactivity of Egyptian manganese ores to be used in the production of ferromanganese alloys in submerged electric arc furnace. Ores with different manganese content (high-medium and low) were selected and characterized by X-Ray Fluorescence (XRF), X-Ray Diffraction (XRD) and Scanning Electron Microscope (SEM). The main mineralogical compositions in the three ores are pyrolusite (MnO2) and hematite (Fe2O3). Porosity of selected Mn ores was determined. The reactivity of the different ores was carried out through pre-reduction of the selected ores using thermobalance at 900˚C and 1100˚C and mixture of CO and CO2 gases. The reduction process was done until steady weight. The reduced ores were examined using XRD and SEM. The results showed that pyrolusite in high and medium ores are converted completely to MnO at 1100˚C. However, the ore with low manganese content was converted to MnO and Mn3O4. Consequently, it is clear from the results that Mn ores with high and medium MnO2 content are more reactive than those with low MnO2. Therefore, high MnO2 content Mn ores are preferable to get good economic impact during the production of high carbon ferromanganese.
1. Introduction
Manganese is an essential alloying element in nearly all types of steel and is used to increase strength, toughness, hardness and hardenability. It is used for deoxidation and desulphurization of ferrous metals and alloys. Manganese is also important in the production of cast iron. Manganese is added to steel or cast iron in the form of manganese ferroalloys such as ferromanganese or silicomanganese alloys [1]. The rapid expansion in the world and Egyptian steel industry in recent years and consequently the increasing demand on the essential ferromanganese necessitated the domestic production of this ferroalloy.
Egyptian Manganese ores are located in Egypt in two major localities beside other several small occurrences. The economic deposits of manganese are Um Bogma in Central Western Sinai and Elba in South Eastern Desert. The reserve of these ores in Um Bogma is about 1.7 million tons. The only processing steps carried out on the manganese ores are crushing and screening [2].
Manganese oxides in manganese ores are reduced to manganese (ferromanganese) by carbon with heat supplied by carbon combustion in Blast Furnace (BF) and electric power in Submerged Electric Arc Furnaces (SAF) [3]. Manganese ore reduction occurs in two stages in the first stage (pre-reduction), gaseous reduction of iron and manganese oxides to FeO and MnO by CO in the solid state. In the second stage, direct reduction of MnO, FeO and SiO2 occurs by carbon producing work has been carried out a metallic Mn, Fe and Si. The completeness of the gaseous reduction, therefore, affects directly the economics of the production process through increasing the efficiency of carbonaceous reducer and decreasing the electric power consumption [1].
As the efficiency of these reactions affects the coke and the energy consumption, the ore reactivity can be considered as the most important parameter during production of ferromanganese [4,5].
There are three main parameters affecting on the manganese ore reactivity [6]:
1) The efficiency of the solid/gas exchange so that the higher the ore porosity the more complete reactions between higher manganese oxides and CO gas.
2) The available oxygen (Av Ox) which is the percentage of oxygen in ore bound to manganese above that associated with MnO and FeO, i.e. the maximum quantity that could be released from reaction with CO gas. As the pre-reduction reactions being exothermic, the higher the available oxygen, the higher the energy will be released. This contributes to heat the burden in the pre-reduction zone and thus favors the reactions occurring in the second stage.
3) Particle size.
The pre-reduction process of manganese oxides in manganese ore i.e. gaseous reduction can occur according to the following equations [6-8]:
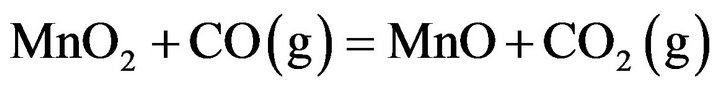 (1)
(1)
 (2)
(2)
 (3)
(3)
Iron is always present in manganese ores, and the reduction of iron oxides present in manganese ores runs parallel to reduction of the higher manganese oxides. According to the equations:
 (4)
(4)
However, the most possible reaction is the indirect reduction of higher iron oxides in the solid state by CO to FeO:
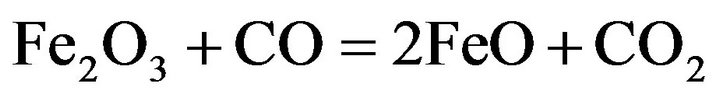 (5)
(5)
 (6)
(6)
This work aims at characterization of three grades of Egyptian manganese ores located in Um Bogma in Central Western Sinai, Egypt through studying the reactivity of these ores in the region of the gaseous reduction.
2. Material and Methods
Three grades of manganese ores with different chemical composition from Um Bogma mines were supplied by Sinai Manganese Company. These ores were crushed to small sizes (<25 mm). Representative samples of Mn ores for determination of chemical composition were analyzed by XRF method. Table 1 shows chemical composition of the representative samples of Mn ores.
2.1. X-Ray Diffraction
X-ray diffraction was done to determine the mineralogycal composition of the prepared samples at room temperature and diffraction patterns were obtained by means of a chart recording Philips PW (1790) X-ray diffracttometer using copper (Kα) radiation. The instrument was properly calibrated and adjusted with respect to the X-ray source. A high voltage of 40 kV and a node current of 30 mA were chosen. The connected Geiger Muller tube detector was adjusted to the order of one degree/cm for identification purposes.
2.2. Scanning Electron Microscope
JEOL, JSM-5410 Scanning Microscope was used to ex-
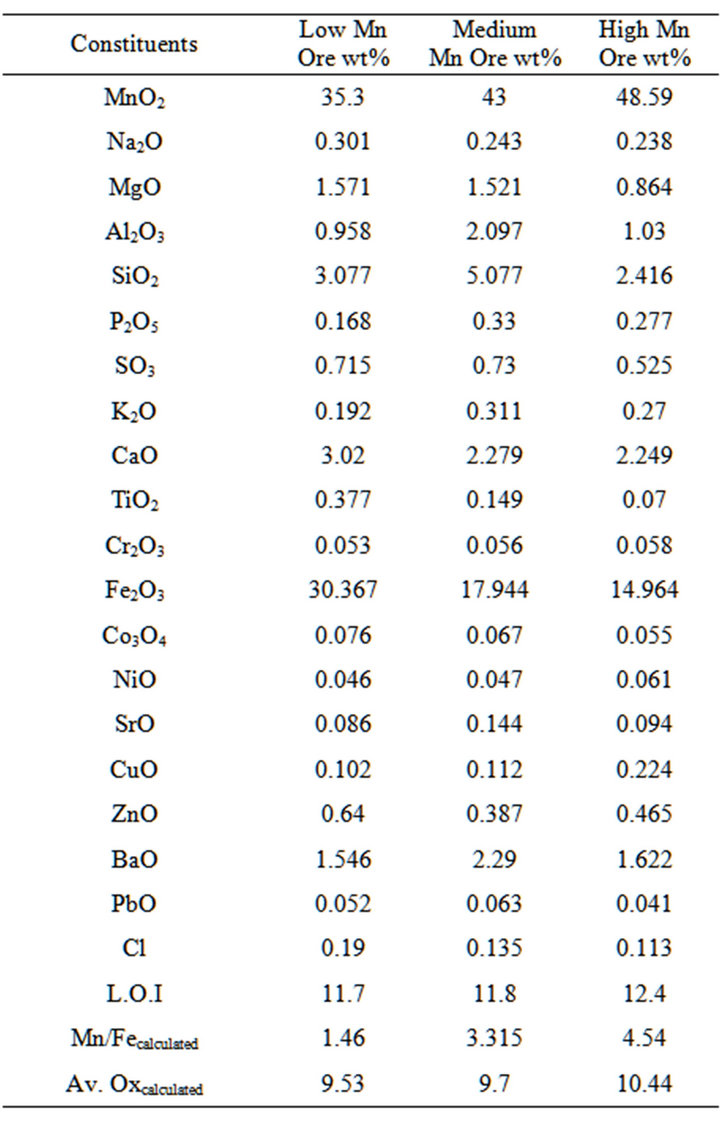
Table 1. Chemical composition of um bogma manganese ores.
amine the morphological structure of the ores before and after the reduction process. The sample to be examined was fixed into an epoxy resin mould, and then examined under JEOL, JSM-5410 Scanning Microscope.
2.3. Density and Porosity
Boiling water method was used to determine sealed pore, true and apparent porosity. Specific gravity bottle method (pycnometer) was used to determine true density for each ores.
2.4. Reactivity Test
The reactivity tests were carried out by gaseous reduction of manganese ores using 60% CO - 40% CO2 gas mixture and the experiments were carried out at temperatures of 900˚C and 1100˚C in a vertical furnace. Nitrogen gas used for removing any gas found in the furnace at the beginning of the experiment and after the experiment also nitrogen gas pass through the furnace to remove CO and CO2 gasses as the sample must be introduced and taken from the furnace in the presence of nitrogen gas.
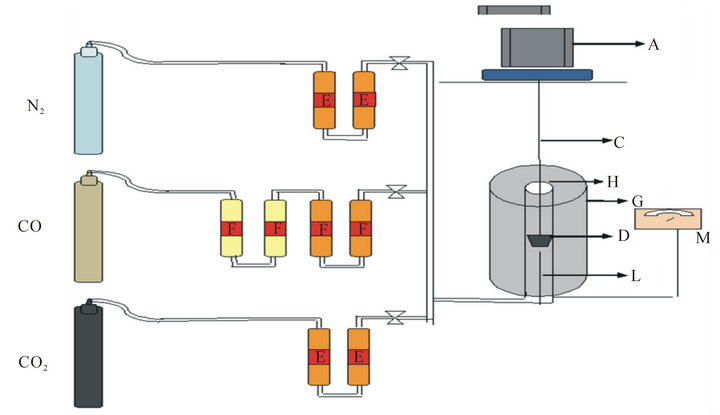
Figure 1. Schematic diagram of reactivity apparatus.
Reactivity of different Mn ores was measured using the system given in Figure 1. The system mainly consists of three parts. The first part is carbon monoxide, carbon dioxide and nitrogen gas cylinders. The second one is purification unit to purify the gases before their use (E) anhydrous silica gel towers and (F) soda lime granules towers. The third part is the thermo balance which consists of vertical tube furnace (G) wounded by a kanthal wire for attaining a maximum temperature of 1200˚C, a Ni/Ni-Cr thermocouple (L) and the reaction tube (H), which is a fused alumina tube. The samples were placed inside a kanthal wire basket (D) suspended by a kanthal wire (C) attached to the pan of a fully automatic sensitive (0.1 mg) balance (A).
The furnace was heated to the required reduction temperature. After reaching this temperature, oxygen free nitrogen gas was flushed into the furnace to remove any contaminants gas in the reaction tube by rate flow 1liter /min.
A kanthal wire basket (D) was placed in the furnace and was weighed as empty then taken from the furnace and was leaved to be cooled then the sample put in it and then the basket (D) with the sample were introduced into the furnace (G) so as to be in the middle of its constant hot zone, in presence of nitrogen gas flushing, Then the mixture of CO and CO2 gases was flushed into the reaction tube by flow rate 600 ml/min and 400 ml/min, respectively. The weight loss due to oxygen removal from the samples was intervally recorded with time until the weight of the sample becomes constant. At the end of the experiment, the basket and the sample were dropped into pure acetone to save the phases that formed in the reduced sample.
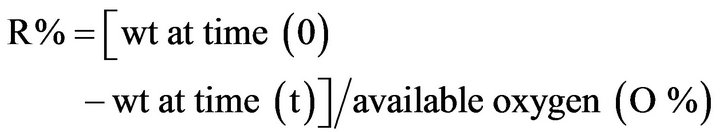
The reduction rate (R%) can be calculated by the following equation:
The available oxygen calculated in this work as the excess or removable oxygen that can be reduced from pyrolusite to reach Manganosite and hematite to reach wustite according to the following equations:
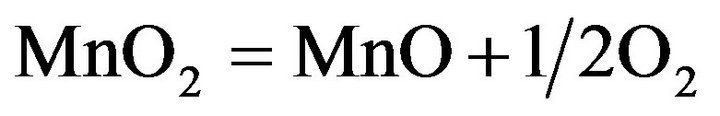 (7)
(7)
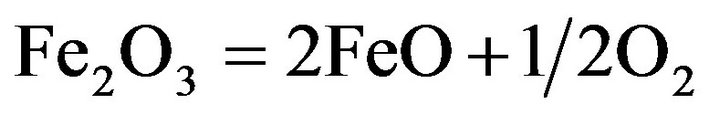 (8)
(8)
3. Result and Discussion
The chemical composition of the three selected manganese ores, given in Table 1, indicates that increasing the percentage of manganese in the manganese ore, the iron content decreases and consequently it’s available oxygen for pre-reduction increases. However as the manganese in the high manganese ore highly oxidized, which could lead to an important exothermic effect in the pre-reduction zone of the furnace which will lead to lower electric power consumption.
The examination of the selected ores by XRD showed that, as it is clear from Figure 2, manganese oxide in the ores is mainly in the form of pyrolusite (MnO2) and iron is present as hematite (Fe2O3). It is also clear that with the decrease of the manganese content, the iron content increases.
The results of porosities determination for different ores are given in Table 2. It is clear from the results that the porosity of medium and low manganese ores is nearly similar. The results of measuring densities of ore size of 1mm given in Table 2.
Photos of the three prepared samples of Mn ores examined by SEM are shown in Figure 3. It can be ob-
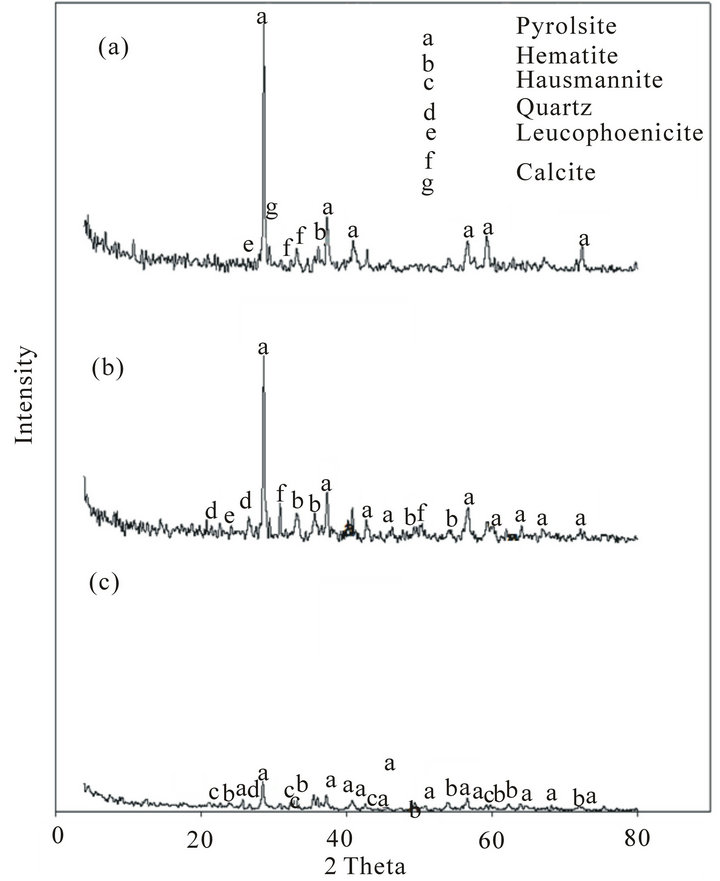
Figure 2. XRD of Mn ores: (a) High Mn ore; (b) Medium Mn ore; (c) Low Mn ore.
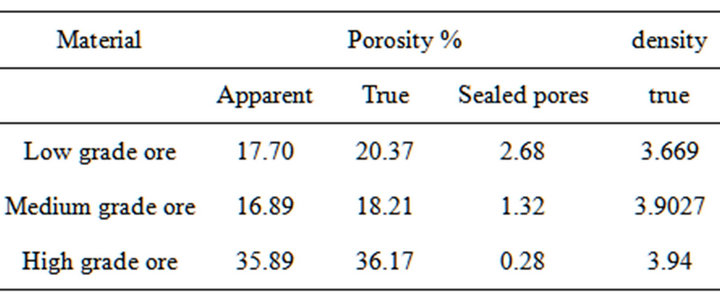
Table 2. True porosity, apparent porosity and sealed pores and true density of the three investigated Mn ores.
served from the examination of the different ores, that the ores particles are agglomerated forming dense grains.
The results obtained from the reduction experiments are represented in Figure 4.
Figure 4(a) indicates that the pre-reduction process of low, medium and high grade Mn ores at 900˚C increases sharply with time at the first stages of reduction for the three ores, then the reduction rate tends to be steady at a certain time. The reduction rate for high grade ore is higher than medium and low grade ores. This may be attributed to the effect of available oxygen as the high grade ore have high available oxygen than the other two grades which significantly affects on the pre-reduction and reactivity. Figure 4(b) indicates that the pre-reduction process of low, medium and high grade Mn ores at 1100˚C has the same behavior as at 900˚C. However, there are small increases in the reduction rate for the
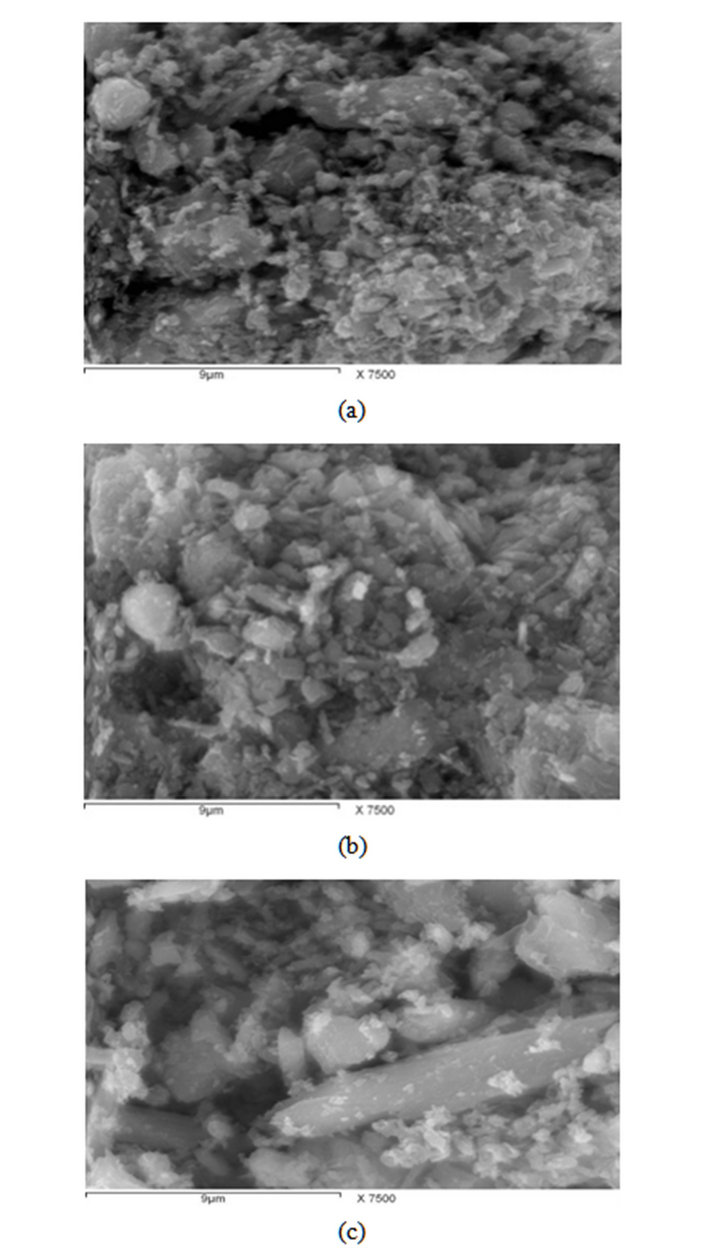
Figure 3. SEM for Manganese ores: (a) Low Mn ore; (b) Medium Mn ore; (c) High Mn ore.
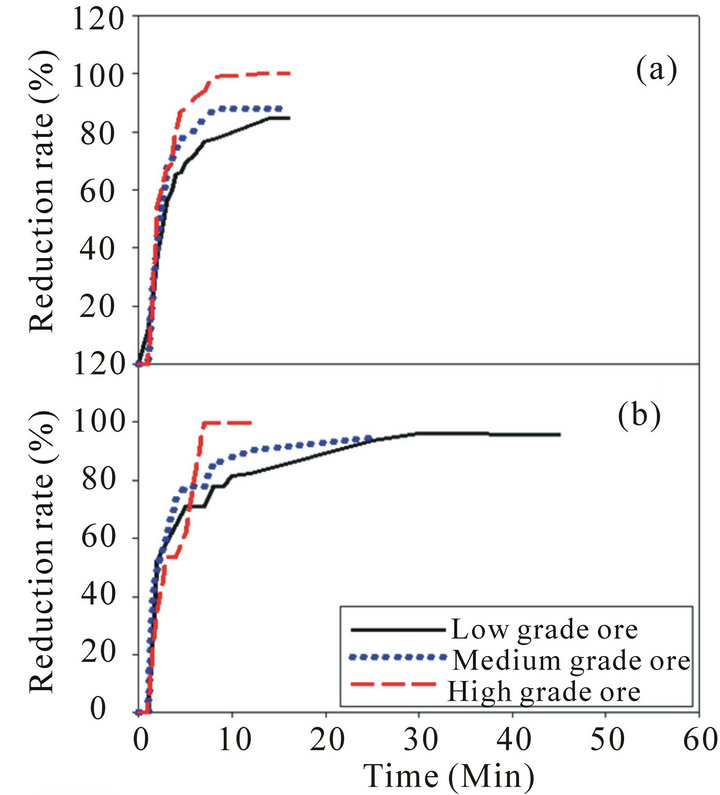
Figure 4. Reduction rate for low, medium and high grade manganese ore: (a) Reduction rate at 900˚C; (b) Reduction rate at 1100˚C.
three manganese ores at 1100˚C than the reduction rate at 900˚C and this increase is more remarkable for the low grade ore than the other two ores. To explain the main differences between the pre-reduction at 900˚C and 1100˚C XRD examination was done for the samples after reduction.
The mineralogical composition determined using XRD
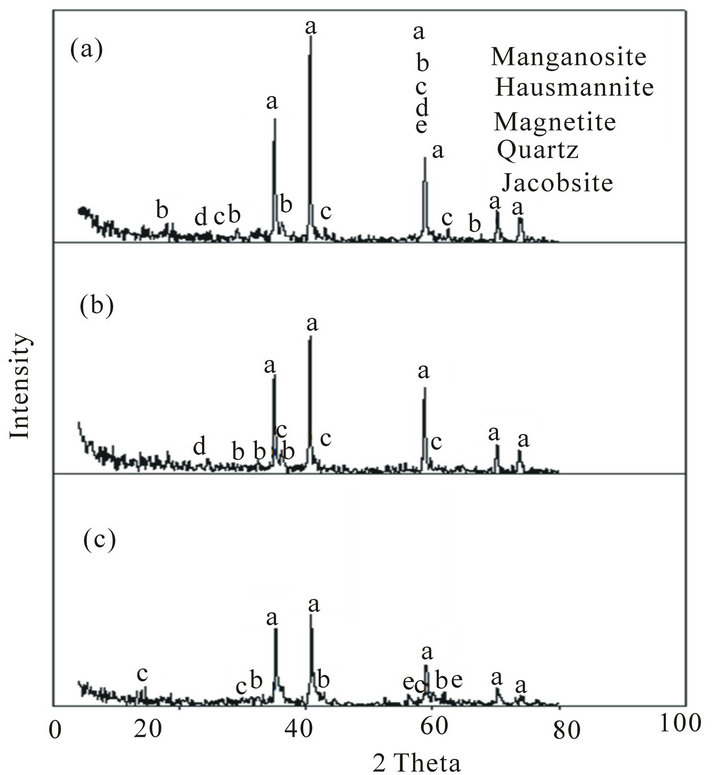
Figure 5. XRD of Mn ores after reduction tests at 900˚C: (a) High Mn ore; (b) Medium Mn ore; (c) Low Mn ore.
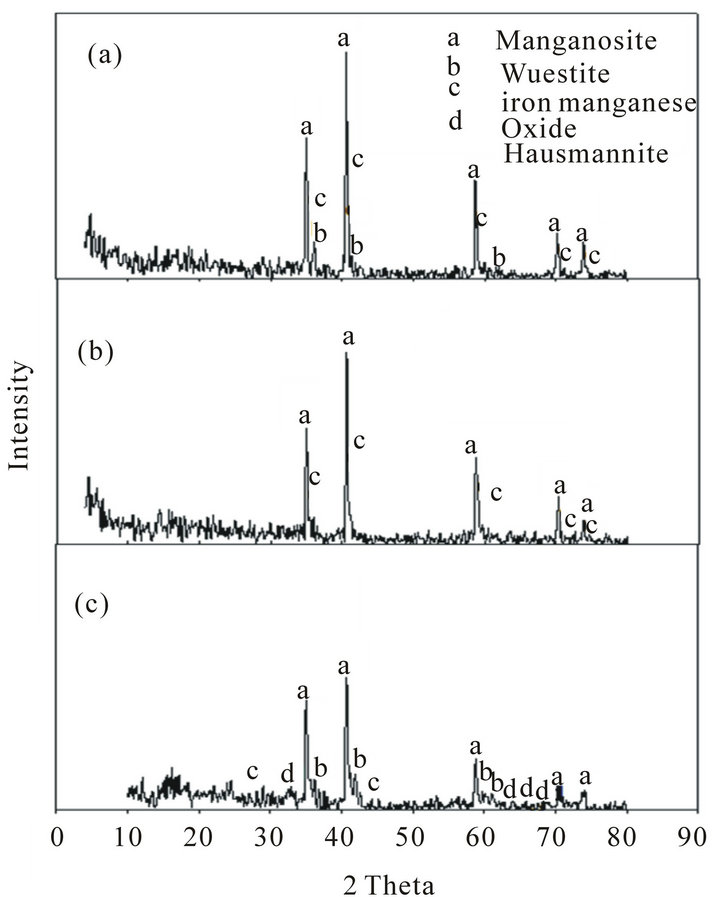
Figure 6. XRD of Mn ores after reduction tests at 1100˚C: (a) High Mn ore; (b) Medium Mn ore; (c) Low Mn ore.
of the reduced ores is indicated in Figures 5 and 6. These figures show that the highest reduction degree of Pyrolusite MnO2 to Manganosite MnO was achieved at 1100˚C.
Comparison of the mineralogical compositions of Low grade ore before and after the reduction can be indicated in Figures 2, 5 and 6 respectively.
It can be observed that after reduction test at 900˚C Pyrolusite MnO2 is reduced to Hausmannite Mn3O4, and Hausmannite Mn3O4 is reduced to Manganosite MnO. Hematite Fe2O3 is reduced to Magnetite Fe3O4. After reduction at 1100˚C the mineralogical composition changed from magnetite Fe3O4 to Wustite FeO, iron manganese oxide, and part of Hausmannite Mn3O4 to Manganosite MnO.
When comparing between the mineralogical composition of medium grade ore before and after reduction test at 900˚C, it can be observed that Pyrolusite MnO2 is reduced to Hausmannite Mn3O4, Hausmannite Mn3O4 is reduced to Manganosite MnO, and Hematite Fe2O3 is reduced to Magnetite Fe3O4. After reduction at 1100˚C the mineralogical composition changed from Fe3O4 and Hausmannite Mn3O4 to iron manganese oxide and Manganosite.
When comparing between the mineralogical composition of high manganese ore before and after reduction test at 900˚C it can be observed that Pyrolusite MnO2 is reduced to Hausmannite Mn3O4, Hausmannite Mn3O4 is reduced to Manganosite MnO, Hematite Fe2O3 is reduced to Magnetite Fe3O4. After reduction at 1100˚C the mineralogical composition changed from Fe3O4 and Hausmannite Mn3O4 to Wustite FeO, iron manganese oxide and Manganosite.
By comparing the phases present after reduction at 900˚C and 1100˚C. It can be observed that:
1) Most of hausmannite, Mn3O4 observed at 900˚C turned into MnO at 1100˚C.
2) Magnetite, Fe2O3 appeared at 900˚C turned into FeO at 1100˚C.
3) Iron manganese oxide phase complex formed at 1100˚C The first and the second observation leads to increase in the reduction rate while the third one leads to decrease in the reduction rate [8]. It seems that the effect of the first and second observation is stronger than the third one, and this explains why the reduction rate increases by increasing temperature from 900˚C to 1100˚C. At the same time, the formation of iron manganese oxides phase complex in the three ores retards the reduction process. The retardation is clearly noticeable in the low grade Mn ore due to the high percentage of iron oxide .It seems that this increase in iron oxides leads to increase of iron manganese oxide complex which is a hardly reducible one and its formation will lead to retardation of the reduction process. This is clear from the composition of the low grade ore after reduction which showed that the Mn3O4 did not converted to MnO while for the other two grade ores i.e. medium and high has been reduced to MnO.
The reactivity of manganese ores in the pre-reduction is highly affected by the efficiency of the solid/gas exchange [9].
Thus, the higher the ore porosity the more complete reactions between higher manganese oxides and CO gas. A higher porosity leads to a high exchange surface with CO gas. The high reactivity of the ore with high manganese content can be due to its higher porosity compared with that containing lower content of manganese as seen in Table 2.
The morphological observations of reduced samples at 900˚C and 1100˚C reduction temperatures are shown in Figure 7. It can be seen that the reduced product at the higher temperature 1100˚C is more homogenous. SEM analysis detected two phases in the ore matrix; the major light phase has higher manganese content, while the second dark phase has higher iron, silicon and aluminum.
From the preceding results of pre-reduction experiments and examination of the produced products by XRD and SEM, it is clear that the pre-reduction of MnO2 to MnO was happened which is in agreement with other works [6-8]. The highest reduction degree of MnO2 to MnO was achieved at 1100˚C for high and medium Mn ore.
The advantage of operating with Egyptian high and medium manganese ores is that it will give low power consumption and thus a high tonnage for the same power input. The main reasons for this are first, the high oxygen content, and next, the good reactivity of these ores. As the reduction of the higher manganese oxides are all exothermic, when reduced with CO gas, higher oxygen content in the ore will lead to lower power consumption.

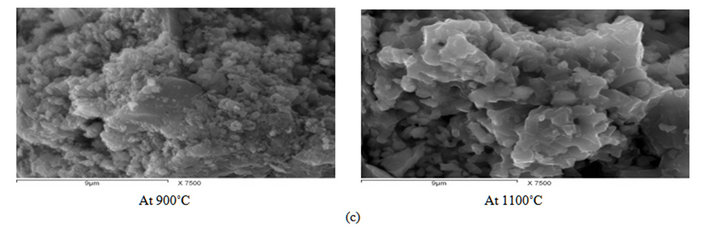
Figure 7. SEM for Manganese ores after reactivity test 900 and 1100˚C: (a) Low Mn ore; (b) Medium Mn ore; (c) High Mn ore.
4. Conclusions
From the obtained results it can be concluded that:
1) The Egyptian manganese ore of the three grades examined constituents mainly of pyrolusite MnO2 and Hematite Fe2O3, which refer to the high percent of removable oxygen which can save energy in the production of high carbon ferromanganese.
2) The porosity of high Mn ore is higher than low and medium Mn ores which increases the ability to use high and medium Mn ores for the production process of HC-Fe Mn as the increase of the ores porosity leads to increase of permeability and consequently sustainability for reduction.
3) The reduction rate for high Mn ore is more than medium Mn ore more than low Mn ore at 900˚C 4) Small increases in the reduction rate at 1100˚C of the three manganese ore. But the increase in reduction rate of low grade manganese ores higher than the increases in the reduction rate for the medium and high grade manganese ore may be due to high percentage of iron oxide in the low grade ore.
5) The formation of iron manganese oxide phase complex in the three ores retards the pre-reduction process. But the effect of retardation is clearly noticeable in the low grade Mn ore due to high percentage of iron oxide which can be explained by the conversion of all pyrolusite to MnO at 1100˚C in the medium and high grade but in the low grade pyrolusite converted to Mn3O4 due to the higher percent of Fe in the low grade than in the other two grade ores.
REFERENCES
- G. Pochart, L. Joncourt, N. Touchard and C. Perdon, “Metallurgical Benefit Of Reactive High Grade Ore in Manganese Alloys Manufacturing,” INFACON XI, 2007, pp. 217-230.
- A.-Z. M. Abouzeid1 and A.-A. M. Khalid, “Mineral Industry in Egypt-Part I: Metallic Mineral Commodities,” Natural Resources, Vol. 2, No. 1, 2011, pp. 35-53. doi:10.4236/nr.2011.21006
- E. C. Vanderstaay, D. R. Swinbourne and M. Monteiro, “A Computational Thermodynamics Model of Submerged Arc Electric Furnace Ferromanganese Smelting,” Mineral Processing and Extractive Metallurgy, Vol. 113, No. 1, 2004, pp. 38-44. doi:10.1179/037195504225004706
- M. Tangstad, S. Wasb and R. Tronstad, “Kinetics of the Pre-reduction of Manganese Ores,” INFACON 9, Quebec City, 2001.
- M. Tangstad and S. Olsen, “The Ferromanganese Process —Material and Energy Balance,” INFACON 7, Trondheim, 1995, pp. 621-630.
- M. Tangstad P. Calvert, H. Brun1 and A. G. Lindseth, “Use of Comilog Ore in Ferromanganese Production,” Proceedings of Tenth International Ferroalloys Congress, Cape Town, 1-4 February 2004, pp. 213-222.
- K. L. Berg, “Gaseous Reduction of Manganese Ores,” Ph.D. Thesis, Faculty of Information Technology, Mathematics and Electrical Engineering, The Norwegian University of Science and Technology, Trondheim, 1998, p. 72.
- A. A. El-Geassy, M. I. Nasr, A. A. Omar and E. A. Mousa, “Isothermal Reduction Behavior of MnO2 Doped Fe2O3 Compacts with H2 at 1073 - 1373 K,” Ironmaking and Steelmaking, Vol. 35, No. 7, 2008 pp. 531-538. doi:10.1179/174328108X58532
- R. Ishak and M. Tangstad, “Degree of Prereduction without Coke Consumption in Industrial Furnaces,” INFACON XI, 2007, pp. 268-279.