Food and Nutrition Sciences
Vol.4 No.5(2013), Article ID:31236,9 pages DOI:10.4236/fns.2013.45069
Development and Evaluation of Shelf Stability of Flaxoat Nutty Bar in Different Packaging Materials
![]()
Department of Cereals and Pulses Technology, Defence Food Research Laboratory, Mysore, India.
Email: *gksdfrl@yahoo.co.in
Copyright © 2013 Ananthan Padmashree et al. This is an open access article distributed under the Creative Commons Attribution License, which permits unrestricted use, distribution, and reproduction in any medium, provided the original work is properly cited.
Received December 12th, 2012; revised February 17th, 2013; accepted February 24th, 2013
Keywords: Cereal Bar; Packaging; Water Activity; Chemical Changes; Shelf Life
ABSTRACT
Flaxoat nutty bar, a granola cereal bar was developed using oat and wheat as major cereal ingredients and their shelf life was assessed in polypropylene (PP 75 µ), paper (42 GSM) aluminium foil (20 µ) polyethylene (PFP, 37.5 µ) and metallised polyester (MP, 12 µ) low density/linear low density (150 µ) (with and without vacuum) films and stored under ambient temperature conditions and 37˚C. Chemical changes in bar under different packaging materials during storage revealed that, the bar remained stable and acceptable for 12 months at ambient conditions irrespective of the packaging materials used, while at 37˚C, the bar packed in PP films remained stable for 6 months only and rest of the bars packed in PFP, MP and MP (vacuum) films found stable and acceptable for the entire storage period of 12 months. The effect of aw on lipid peroxidation established the maximum stability of the bar at 0.33 aw. Fourteen fatty acids were identified in which oleic (50.91%), linoleic (22.50%) and palmitic (12.63%) acids were found to be the major fatty acids. Fortification of a bar with vitamin C, B1 and B2 contents to meet 50% RDA enhanced vitamin contents and the maximum retention was observed in bars packed under vacuum in MP films.
1. Introduction
Consumption of cereals especially oat, wheat, barley plays a major role in the prevention of chronic diseases such as coronary heart diseases, diabetes, colorectal cancer and is regarded as major functional ingredients in the cereal food industry [1,2]. Ready-to-eat breakfast cereals and their product play an important role in the human diet with a specific function and physiological benefits to the human being [3] and are considered as the economically competitive source of nutrients [4]. Cereal bars are one of the ready-to-eat convenient products occupying larger space in the consumer market which not only satisfy the hunger, but prove as a quality source of nutrients and a convenient means of replacement of a meal [5]. These ready-to-eat foods are most susceptible to lipid oxidation, irrespective of lipid content, acquire considerable flavour and odour, reduce sensory perception, nutritional quality and safety of foods during storage, [6-8] and make the food unpalatable. Therefore extension of shelf life and preservation of ready-to-eat foods is of utmost importance. Food packaging plays a vital role in determining the shelf life of foods as they act as a barrier for oxygen and loss or gain of moisture in foods [9,10]. Selection of a proper packaging material is most essential to ensure maximum product quality during storage to prevent oxidation of lipids [11]. In the present study, flaxoat nutty bar containing wheat and oat as main cereal ingredients was developed and shelf stability was evaluated in polypropylene (PP), paperal foil-polyethylene (PFP) and metallised polyester films (MP, with and with out vacuum packing) under ambient and 37˚C temperature conditions.
2. Materials and Methods
The raw materials such as wheat semolina, oat flakes (Avena sativa), Baggery brand, puffed wheat (Triticum aestivum), cashewnuts (Anacardium occidentale L.), Achal brand, pista (Pistacio vera), flax seed (Linum usitatissimum), almond (Prunus dulcis), dairy whitner (Everyday), salt (Annapoorna brand) jaggery (round), date syrup (Lion brand), honey (Dabur brand) and refined rice bran oil (Dhara brand) were procured locally from commercial market of Mysore. All the chemicals used for the study were of analytical reagent grade.
2.1. Processing Methods and Preparation of Flaxoat Nutty Bar
Puffed wheat was thoroughly cleaned and dried in a hot air oven at 70˚C to a moisture content of 4% - 6%. Oat flakes were dried in a hot air oven at 70˚C for 1 hr, coarsely powdered and seived in a 700 µ seive to obtain uniform size particles. Cashewnuts, pista, almond were cut in to small pieces and dried in a hot air oven at 70˚C to a moisture level of 3% - 5%. Flax seed was thoroughly cleaned to remove foreign materials, roasted up to 120˚C and coarsely powdered.
2.2. Roasting of Ingredients
Rice bran oil (75 g), oat flakes (700 µ, 325 g), wheat semolina (500 µ, 88 g), flax seed (137 g), almond (175 g), cashewnuts (225 g), pista (88 g), dairy whitener (175 g) were mixed well and roasted in an indigenously made roasting equipment (Model Janata 10, Sri Venkateshwara Industries, Mysore, India) up to 110˚C and cooled to room temperature. To this mixture, 125 g of puffed wheat and 75 g of maltodextrin were added and mixed thoroughly.
2.3. Preparation of Jaggery Syrup
To 875 g of Jaggery, 1750 ml of water and 112 g of honey were added and heated continuously to a temperature of 105˚C to get thick consistant syrup with 90˚ - 92˚ brix. Glycerol (25 g) was added to it and mixed well.
2.4. Preparation of Flaxoat Nutty Bar
The roasted mix of ingredients were added to the hot binder syrup and mixed well. The mixture was fed into a semi-automatic tablet making machine (Model 90, M/s Sumukhi Associates, Mysore, India) consisting of a square mould (480 mm × 480 mm) having 90 equal sized blocks (75 mm × 25mm × 40 mm) and compressed to obtain 90 bars of approximate size (30 mm × 10 mm × 10 mm) by applying a pressure of 8500 pounds. Four batches (10 kg) of flaxoat nutty bar consisting of a total weight of 2.5 kg for each batch was made, packed in PP, PFP MP and also under vacuum in MP, stored under ambient conditions and 37˚C for shelf life evalvuation.
2.5. Sensory Evaluation
Sensory evaluation of flaxoat nutty bar was carried out by serving bars to 20 trained panel of judges for evaluating different sensory attributes like colour, aroma, taste, texture and overall acceptability on a 9-point Hedonic scale grading 9 for excellent and 1 for highly disliked samples.
2.6. Analysis
Moisture, total protein, total fat and total ash contents were estimated by AOAC (1984) methods [12]. Crude fibre was estimated as per AOAC (1984) methods [12] using Fibra plus equipment (M/s Pelican Instruments, Chennai, India). Total sugar was estimated using the method [10], described by Khan et al. (2008). Peroxide and free fatty acid values were determined by AOCS (1973) methods [13]. The mineral content in energy bars was determined as per the method [14], of Semwal et al. (2001). Thiobarbituric acid values were estimated as per the method [15], of Tarledgis et al. (1960). Fatty acid profile was determined as per AOCS (1990) methods [16], while vitamin B1 and B2 contents were determined by AOAC (1997) methods [17]. Vitamin C content was estimated using the method [18], of Ranganna (1986) and microbiological analysis was carried out as per the method [19], of Harrigan and McCance (1976).
For the measurement of browning index, 4 g of sample was treated with 50 ml of distilled water. Shaken vigorously in a mechanical shaker for 2 hr, followed by the addition of 5 ml 45% lead acetate solution. The shaking was presumed for another 5 min. Filtered and the absorbance of the supernatent was measured at 420 nm in a spectrophotometer (Model UV 1601, Shimadzu, Japan).
2.7. Fortification with Vitamins and Minerals
Vitamins such as vitamin C (as Ascorbic acid, 750 mg), vitamin B1 (as thiamin hydrochloride, 18 mg), vitamin B2 (as riboflavin, 20 mg) and minerals like calcium (as elemental calcium, 10 g), iron (as elemental Iron, 350 mg) and zinc (as zinc sulphate, 188 mg) were accurately weighed per batch of 2.5 kg and incorporated into a dairy whitener, thoroughly mixed with dry ingredients in a stainless steel vessel to meet 50% RDA requirements approximately, as recommended by ICMR. The bars were made as described above. Initially and periodically after fortification, bars were analysed for vitamin C, B1 & B2 contents.
2.8. Effect of aw on Lipid Peroxidation
To study the effect of water activity on lipid peroxidation of flaxoat nutty bar, 100 g samples of bar were stored in desiccators for 45 days at ambient temperature (15˚C - 34˚C) containing phosphorous pentoxide to obtain 0.0 water activity (aw) and saturated solutions of magnesium chloride, sodium bromide and sodium nitrate to obtain water activities (aw) of 0.33, 0.57 and 0.73 respectively. Initially and periodically at an interval of 15 days, stored bar samples were analysed for moisture, peroxide and free fatty acid values.
2.9. Statistical Analysis
All the reported values are the mean of three replicates each and statistical analysis was carried out by using statistical software (Statistica, Ver 7.0 of Stat Soft Incorporation, Tulsa OK, USA). Experimental results were subjected to two way analysis of variance for significance (p < 0.05) using Duncan’s multiple range tests. Correlation between chemical parameters and over all acceptability scores were evaluated for significance (p < 0.05).
3. Results and Discussion
A 10 kg batch of flaxoat nutty bar was prepared and the various ingredients used were in the range of 10% - 15% oat flakes, 3% - 6% puffed wheat, 2% - 5% wheat semolina 3% - 7% flax seed, 6% - 10% cashew nuts, 2% - 6% pista, 5% - 10% almond, 3% - 6% honey, 5% - 10% dairy whitener, 2% - 6% rice bran oil, 0% - 2% glycerol, 1% - 4% maltodextrin, 32% - 40% jaggery. For making a bar of acceptable texture, it is essential that brix of the binder composition to be made 90˚ - 92˚. Below and above this brix, the prepared bar had either soggy or hard texture which was not liked by the taste panel members. Roasting of ingredients also enhanced aroma, taste and overall acceptability of the product. Sensory attributes like colour, aroma, taste, texture and overall acceptability scores of all these bars revealed that bar prepared by using 13% oat flakes, 5% puffed wheat, 3.5% wheat semolina, 5.5% flax seed, 9% cashew nuts, 3.5% pista, 7% almond, 4.5% honey, 7.0% dairy whitener, 3.0% rice bran oil, 1.0% glycerol, 3.0% maltodextrin and 35% jaggery were highly liked as it received an overall acceptability score of 8.41 on 9-point Hedonic scale.
The proximate composition of optimized flaxoat nutty bar had 2.52% moisture, 10.49% total protein, 19.44% total fat, 46.15% total sugar, 2.34% total ash, 2.33% crude fiber and 16.73% carbohydrate (by difference). Flaxoat nutty bar provides 468.44 K cal of energy.
Initially flaxoat nutty bar contained 7.29 mg/100g of vitamin C, 0.4 mg/100g of vitamin B1 and 0.21 mg/100g of vitamin B2 (Table 1). The corresponding vitamin values after fortification of flaxoat nutty bar were 28.73, 0.72 and 1.08 mg/100g respectively. During storage of fortified flaxoat nutty bar, there were significant (p < 0.05) loss in the vitamin contents irrespective of packaging material, duration and storage temperature. However difference in vitamin loss between PFP and MP stored samples were not significant (p > 0.05). After 12 months of storage at ambient temperature and 37˚C, the retention of vitamin C in polypropylene (PP), paper aluminum foil laminate (PFP), metallized polyester (MP) and metallized polyester (MP, Vac) packed flaxoat nutty bar was 23.98% and 19.07%, 32.33% and 27.98%, 32.47% and 27.98% and 40.06% and 36.33% respectively. The retention of vitamin B1 and vitamin B2 in different packaging materials ranged from 15.28% to 54.16% and 18.52% to 40.74% respectively after 12 months of storage. The results are in conformity with the published literature [20- 22]. The oxygen permeability rate of the packaging material, the intensity of light that reaches the food through the packaging system and the heat penetration rate through the packaging greatly influences the stability of vitamins as these micronutrients are highly sensitive to oxygen, light and heat.
Flaxoat nutty bar had 68.34 ppm of calcium, 6.0 ppm of iron and 2.48 ppm of zinc before fortification, but after fortification of the bar with mineral content to meet 50% RDA, calcium, iron and zinc were increased to 4517,
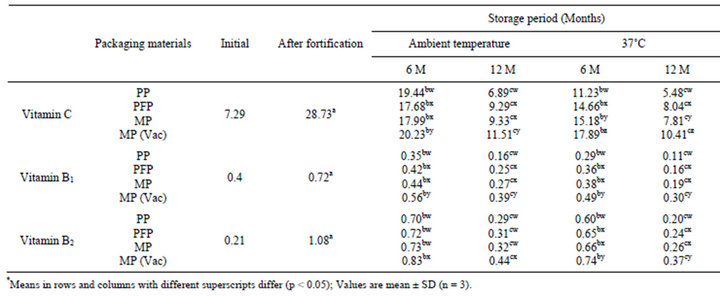
Table 1. Changes* in vitamin “C” (mg/100g), vitamin “B1” (mg/100g) and vitamin “B2” (mg/100g) contents of fortified flaxoat nutty bar during storage at ambient temperature (15˚C - 34˚C) and 37˚C.
108.92 and 74.81 ppm respectively.
3.1. Effect of Water Activity
Sorption isotherm of flaxoat nutty bar and changes in moisture, PV and FFA values during storage under different water activity for 45 days are shown in Figure 1. The product equilibrated to 0.69%, 3.47%, 6.93% and 12.09% moisture levels at 0.0, 0.33, 0.57 and 0.73 aw respectively after 45 days of storage. No visible microbial spoilage was observed upto 0.73 aw for 45 days. The gradual increase in PV and FFA values were observed at all aw during storage but values were least at 0.33 aw suggesting the maximum stability of the product at monolayer value. The rate of increase of PV and FFA values were more both below and above 0.33 aw. The results are in conformity with the published data [23] as water forms hydrogen bonds with hydroperoxides and stabilizes the hydroproxide for decomposition and arrest their activity for enhancing the decomposition of peroxides. The similar results were also obtained previously for ground nut burfi [10] and instant kadhi [24].
3.2. Changes in Chemical Parameters
Development of off flavour due to lipid peroxidation in low moisture foods is the major cause of rejection of processed foods by the consumer. Development of off flavour results due to the decomposition of peroxides and formation of volatile adehydes, ketones, esters etc. having low flavour threshold values. Therefore, the rate of lipid peroxidation was monitored by following changes in peroxide value, free fatty acids, thiobarbituric acid value and browning index in flaxoat nutty bar packed in different packaging materials in order to assess their shelf-life and correlation with sensory attributes.
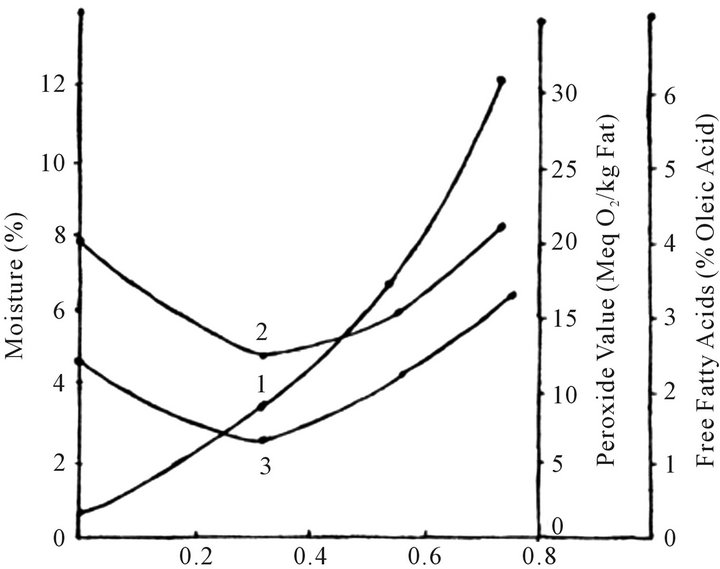
Figure 1. The effect of water activity on moisture (1), peroxide value (2), and free fatty acid contents of flaxoat tasty bar during storage at ambient temperature (15˚C - 34˚C).
Effect of various packaging materials on the chemical changes in the flaxoat nutty bar at ambient temperature and 37˚C are given in Tables 2 and 3. It is evident from the data that the rate of peroxidation was highest at 37˚C as compared to samples stored at ambient temperature. Packaging material played a significant role on the changes of chemical parameters like PV, FFA, TBA and browning index. After 12 months of storage at ambient temperature, peroxide value increased significantly (p < 0.05) from 6.99 to 14.24, 12.88, 12.68 and 10.41 meq O2/kg fat in PP, PFP, MP and MP vacuum packed samples, while corresponding values at 37˚C were 18.16, 15.86, 15.60 and 12.01 respectively. The changes in TBA, FFA and browning index also followed the same trend. The higher rate of peroxidation in PP samples can be attributed to the higher oxygen permeability as compared to PFP and MP.
3.3. Changes in Fatty Acid Profile
Fatty acid profile of flaxoat nutty bar as determined by gas chromatograph is reported in Tables 4 and 5. Initially 14 fatty acids were identified. The major fatty acid found in flaxoat nutty bar was oleic acid (50.91%) followed by linoleic acid (22.50%), palmitic acid (12.63%), linolenic acid (6.20%) and stearic acid (3.69%). Other fatty acids like capric, lauric, myristic, behenic and lignoceric acids were present less than 1%. In general, flaxoat nutty bar contained 17.79% saturated (SFA), 51.34% monounsaturated (MUFA) and 28.70% polyunsaturated fatty acids (PUFA). After 12 months of storage at ambient temperature and 37˚C, there was a significant (p < 0.05) loss in MUFA and PUFA content of flaxoat nutty bar. The maximum loss in MUFA and PUFA contents occurred at 37˚C and the losses were 2.10 and 3.56, 1.68 and 2.60, 1.71 and 2.41 and 1.11 and 1.73 units in PP, PFP, MP and vacuum packed samples in MP respectively with concomitant increase in SFA.
3.4. Changes in Sensory Attributes
The increase in PV, FFA, TBA and browning index have been found to affect sensory scores significantly (p < 0.05) and correlated (r ≥ −0.62) to the overall acceptability score during storage of flaxoat nutty bar in different packaging materials at ambient temperature and 37˚C. The overall acceptability scores based on colour, aroma, taste and texture was 8.41 on a 9-point Hedonic scale (Tables 6 and 7). For assessing the shelf-life of a bar, an overall acceptability score of 7.0 as a threshold value on 9 point Hedonic scale was taken. Based on this criterion, it was found that bar remained acceptable during the entire storage period irrespective of packaging material at ambient temperature. At 37˚C, the bar packed in PP film remained acceptable up to 6 months only, while rest of
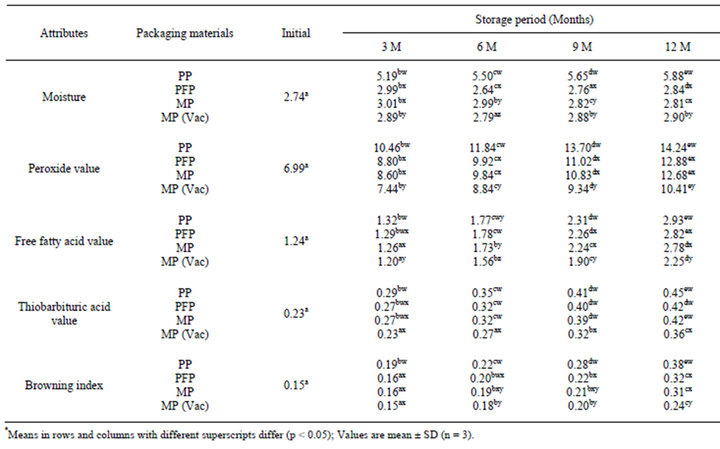
Table 2. Changes* in moisture (%), peroxide value (meq O2/kg oil), free fatty acids, (% oleic acid), thiobarbituric acid value (mg MA/kg sample) and browning index (OD) in flaxoat nutty bar during storage at ambient temperature (15˚C - 34˚C).
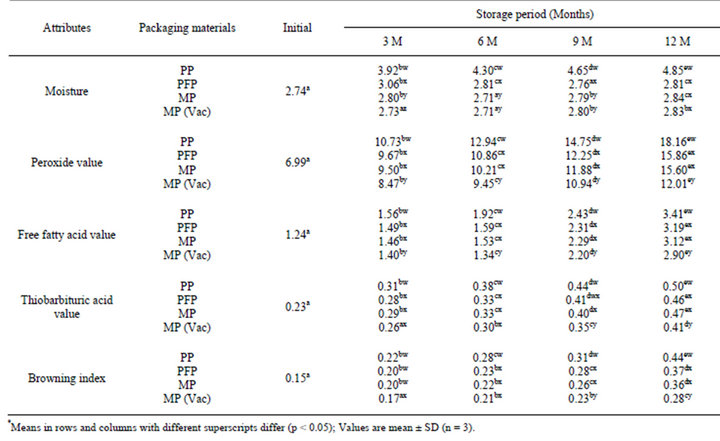
Table 3. Changes* in moisture (%), peroxide value (meq O2/kg oil), free fatty acids (% oleic acid), thiobarbituric acid value (mg MA/kg sample) and browning index (OD) in flaxoat nutty bar during storage at 37˚C.
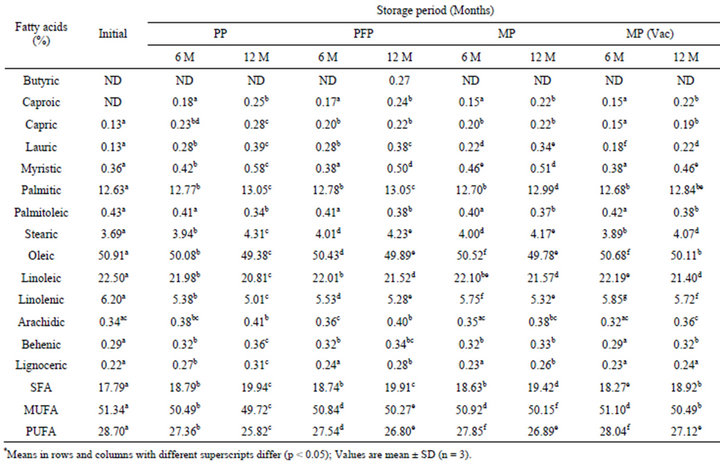
Table 4. Changes in fatty acid profile* of flaxoat nutty bar during storage at ambient temperature (15˚C - 34˚C).
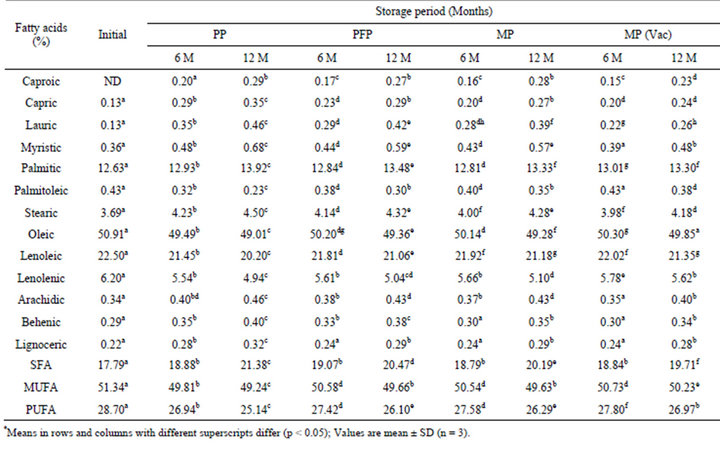
Table 5. Changes in fatty acid profile* of flaxoat nutty bar during storage at 37˚C.

Table 6. Changes in sensory scores* of flaxoat nutty bar during storage at ambient temperature (15˚C - 34˚C).
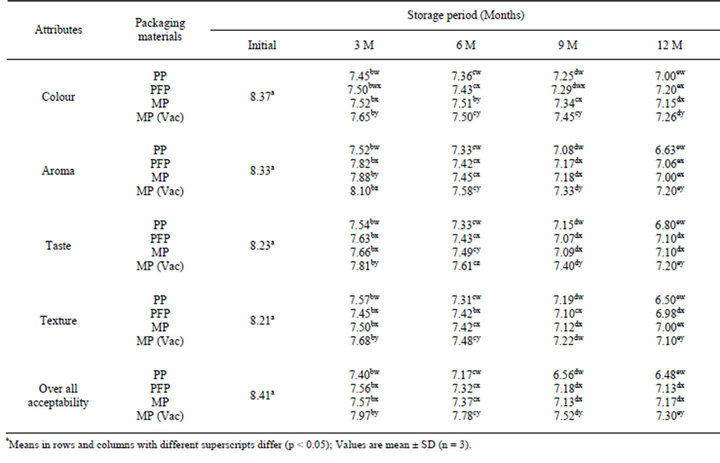
Table 7. Changes in sensory scores* of Flaxoat nutty bar during storage at 37˚C.
the bar packed in PFP, MP and MP vacuum remained stable and acceptable during the entire storage period of 12 months. The chemical changes in the bar was found to be negatively correlated with the over all acceptability scores. The correlation between PV & OAA, FFA & OAA, TBA & OAA and BI & OAA were −0.63, −0.90, −0.84 and −0.99; −0.83, −0.77, −0.74 and −0.86; −0.95, −0.91, −0.78, and −0.95; −0.86, −0.84, −0.73 and −0.96 in PP, PFP, MP and MP vacuum packed samples respectively. At 37˚C, the correlation between PV & OAA, FFA & OAA, TBA & OAA and BI & OAA were ranged from −0.84 to −0.99, −0.84 to −0.92, −0.88 to –0.98 and −0.83 to −0.96 respectively.
4. Conclusion
The flaxoat nutty bar remained microbiologically safe during the entire storage period, and the changes in the rate of peroxidation in different packaging materials significantly (p < 0.05) affected the shelf-stability of a bar thus restricting its shelf life for 6 months in PP at 37˚C as compared to 12 months in PFP and MP packed samples. Vacuum packing of a bar has been proved quite beneficial in retaining the sensory attributes with least chemical changes occurred during storage. .
5. Acknowledgement
Authors express sincere thanks to Director, DFRL for providing necessary facilities and guidance during the course of investigation.
REFERENCES
- B. Mckevith, “Nutritional Aspects of Cereals,” Nutrition Bulletin, Vol. 29, No. 2, 2004, pp. 111-192. doi:10.1111/j.1467-3010.2004.00418.x
- S. B. Charles and J. C. Louise, “The Potential Use of Cereal 1→3, 1→4 β –D Glucans as Functional Food Ingredients,” Journal of Cereal Science, Vol. 42, No. 1, 2005, pp. 1-13. doi:10.1016/j.jcs.2005.01.002
- L. Paul, J. Walton, S. Bartlett, A. Hackett and L. Stevenson, “Regular Consumption of Cereal Breakfast. Effects on Mood and Body Image Satisfaction in Adult Non Obese Women,” Appetite, Vol. 55, No. 3, 2010, pp. 512- 521. doi:10.1016/j.appet.2010.08.019
- M. H. Gretchmen, “The Impact of Breakfast Especially Ready-to-Eat Cereals, Nutrient Intake and Health of Children,” Nutrition Research, Vol. 15, No. 4, 1995, pp. 595- 613. doi:10.1016/S0271-5317(95)80003-4
- M. T. Catherine and C. M. Johnston, “Ingestion of Nutrition Bars High in Protein and Carbohydrates Does Not Impact 24 h Energy Intake in Healthy Young Adults,” Appetite, Vol. 59, No. 3, 2012, pp. 778-781. doi:10.1016/j.appet.2012.08.012
- Esterbaur, “Cytotoxicity and Genotoxicity of Lipid Oxidation Products,” American Journal of Clinical Nutrition, Vol. 57, No. 5, 1993, pp. 7795-7855.
- D. A. Forss, “Odour and Flavour Compounds from Lipids,” Progress of Chemical Fat and Other Lipids, Vol. 15, No. 4, 1995, pp. 177-258.
- S. Kubow, “Routes of Formation and Toxic Consequences of Lipid Oxidation Products in Foods,” Free Radical Biology and Medicine, Vol. 12, No. 1, 1992, pp. 63-81. doi:10.1016/0891-5849(92)90059-P
- G. K. Sharma, C. V. Madhura and S. S. Arya, “Interaction of Plastic Films with Foods, II Effect of Polyethylene and Polypropylene Films on the Stability of Vegetable Oils,” Journal of Food Science and Technology, Vol. 27, No. 6, 1990, pp. 328-331.
- M. A. Khan, A. D. Semwal, G. K. Sharma, D. N. Yadav and K. A. Srihari, “Studies on the Development and Shelf Stability of Groundnut (Arachis hypogea) Burfi,” Journal of Food Quality, Vol. 31, No. 6, 2008, pp. 612-626. doi:10.1111/j.1745-4557.2008.00224.x
- M. Seacheol and Q. H. Zhang. “Packaging for Non Thermal Food Processing,” In: J. H. Haan, Ed., Innovation in Food Packaging, 2005, p. 482.
- “Official Methods of Analysis,” 14th Edition, Association of Official Analytical Chemists, Arlington, 1984.
- “Official and Tentative Methods,” 3rd Edition, American Oil Chemical Society, Chicago, 1973.
- A. D. Semwal, G. K. Sharma, P. E. Patki, A. Padmashree and S. S. Arya, “Studies on the Development and Storage Stability of Instant Vegetable Pulav Mix,” Journal of Food Science and Technology, Vol. 38, No. 3, pp. 231-234.
- B. G. Tarledgis, B. M. Watts, M. E. Younathan and L. Dugan Jr., “A Distillation Method for the Qualitative Determination of Malonaldehyde in Rancid Food,” Journal of American Oil Chemical Society, Vol. 37, No. 1, 1960, pp. 44-47.
- “Official Methods and Recommended Practices of American Oil Chemical Society,” 4th Edition, American Oil Chemical Society, Champaign, 1990.
- “Official Methods of Analysis,” 16th Edition, Association of Official Analytical Chemists, Gaitherburg, 1997.
- S. Ranganna, “Hand Book of Analysis and Quality Control for Fruits and Vegetable Products,” Tata McGraw Hill Publishing Company Limited, New Delhi, 1986.
- W. F. Harrigan, and H. B. McCance, “Laboratory Methods of Food Microbiology,” Academic Press, London, 1976.
- E. M. Furuya and J. J Warthesen, “Packaging Effects on Riboflavin Contents of Pasta Products in Retail Markets,” Cereal Chemistry, Vol. 61, No. 5, 1984, pp. 399-402.
- C. Renata, “Micronutrient Fortification of Foods: Technology and Quality Control,” Food Fortification Technology and Control, Rome, 1996,
- A. Hussein, J. A. Odumeru, T. Ayanbadejo, H. Faulkner, W. B. McNab, H. Hager and L. Szijarto, “Effect of Processing and Packaging on Vitamin ‘C’ and β-Carotene Content of Ready-to-Use Vegetables,” Food Research International, Vol. 33, No. 2, 2000, pp. 131-136. doi:10.1016/S0963-9969(00)00027-2
- T. P. Labuza, “Oxidative Changes in Food at Low and Intermediate Moisture Foods,” In: R. B. Duckworth, Ed., Water Relation of Foods, Academic Press, London, 1978, pp. 455-474.
- G. K. Sharma, A. D. Semwal and S. S. Arya, “Development of Instant Kadhi Mix,” Journal of Food Science and Technology, Vol. 32, No. 3, 1995, pp. 206-210.
NOTES
*Corresponding author.