Graphene
Vol.05 No.02(2016), Article ID:66126,47 pages
10.4236/graphene.2016.52011
Modeling and Simulation of Graphene Based Polymer Nanocomposites: Advances in the Last Decade
Rasheed Atif, Fawad Inam*
Department of Mechanical and Construction Engineering, Faculty of Engineering and Environment, Northumbria University, Newcastle, UK

Copyright © 2016 by authors and Scientific Research Publishing Inc.
This work is licensed under the Creative Commons Attribution International License (CC BY).
http://creativecommons.org/licenses/by/4.0/


Received 11 March 2016; accepted 26 April 2016; published 29 April 2016
ABSTRACT
Modeling and simulation allow methodical variation of material properties beyond the capacity of experimental methods. The polymers are one of the most commonly used matrices of choice for composites and have found applications in numerous fields. The stiff and fragile structure of monolithic polymers leads to the innate cracks to cause fracture and therefore the engineering applications of monolithic polymers, requiring robust damage tolerance and high fracture toughness, are not ubiquitous. In addition, when “many-parts” cling together to form polymers, a labyrinth of molecules results, which does not offer to electrons and phonons a smooth and continuous passageway. Therefore, the monolithic polymers are bad conductors of heat and electricity. However, it is well established that when polymers are embedded with suitable entities especially nano-fillers, such as metallic oxides, clays, carbon nanotubes, and other carbonaceous materials, their performance is propitiously improved. Among various additives, graphene has recently been employed as nano-filler to enhance mechanical, thermal, electrical, and functional properties of polymers. In this review, advances in the modeling and simulation of grapheme based polymer nanocomposites will be discussed in terms of graphene structure, topographical features, interfacial interactions, dispersion state, aspect ratio, weight fraction, and trade-off between variables and overall performance.
Keywords:
Graphene, Polymer, Nanocomposites, Modeling, Simulation

1. Introduction
A comparison of the properties of polymers with other materials is shown in Figure 1. The polymers show relatively lower values of strength, stiffness, and fracture toughness. Therefore, the applications of monolithic polymers are not that common due to these limitations. However, it was realized that by the time polymers are reinforced, they show a propitious flexibility to manipulate their properties. The Polymer Matrix Composites (PMCs) were the first manufactured composite materials during World War II [1] . The applications of PMCs started on larger scale during 1950s while during 1960s, the applications in consumer sporting equipment extensively increased their market. During the energy crises in 1970s, the demand for PMCs further increased due to their relatively lower cost. During this period, the properties of PMCs, the design methodologies, and manufacturing capabilities were further modified. With the improvement in other properties, the maximum service temperature for PMCs was also increased. The PMCs have replaced aerospace structural alloys such as aluminum alloys as the latter are prone to corrosion and fatigue failure [1] . The high-performance PMCs are increasingly finding demand in the infrastructure commodity market.
Some of the most commonly used polymers include epoxy, polycarbonate, polyester, Polymethyl Methacrylate (PMMA), polyethylene, polypropylene, polyvinyl chloride, Polystyrene (PS), nylon, and teflon etc. The epoxies are most commonly used to produce PMCs. The polymers are reinforced with various kinds of reinforcements. The first manufactured PMCs used glass fibers as reinforcement. Besides glass fibers, some frequently used reinforcements include metallic oxides [2] - [4] , clays [5] - [7] , Carbon Nanotubes (CNTs) [8] - [10] , and other carbonaceous materials [11] - [13] . The trends of the use of various reinforcements in the last decade are shown in Figure 2. The use of titania (TiO2) is on rise because of its applications in paints, varnishes, and paper industry [14] [15] . However, the number of publications in 2014 with other reinforcements is decreased. Even the state-of-the-art CNTs are being relinquished by the researchers in 2014. It might be suspected that either the global recession has hit the worldwide research or the research has reached its limits. However, Figure 3 provides a quantitative assessment on the popularity of graphene among researchers.

Figure 1. Comparison of the fracture toughness and Young’s modulus values of polymers with other materials.

Figure 2. Number of yearly publications of various reinforcing materials during 2005-20014 (Thomson Reuters).

Figure 3. Number of yearly publications of graphene during 2005-2014 (Thomson Reuters).
There is an exponential rise in the use of graphene in the last decade. Novoselov et al. [16] experimentally produced Single Layer Graphene (SLG) using scotch-tape method and a low cost method to synthesize graphene on large scale was presented by Stankovich et al. [17] allowing the extension of the applications of graphene to industrial scale. After the groundbreaking experiments on the two-dimensional material graphene by Nobel Laureates, Sir Andre Geim and Konstantin Novoselov [16] from the University of Manchester, graphene came into limelight in research field mainly because of its excellent electrical [18] , thermal [19] , and mechanical properties [20] . Graphene found widespread applications in electronics [21] , bio-electric sensors [22] , energy technology [23] , lithium batteries [24] , aerospace [25] , bio-engineering [26] , and various other fields of nanotechnology [27] . In 2014, 2009 research papers were published on graphene in which about 830 papers were on graphene-epoxy nanocomposites produced using solution casting technique. It shows that epoxy and solution casting technique are still preferred choices as polymer matrix and production method, respectively. It can also be deduced that the researchers are at the moment not interested in introducing some new polymer matrix or to invent a new production method to produce Graphene Based Polymer Nanocomposites (GBPNCs). Instead, research has been carried out to explore the role of graphene in influencing the polymer properties both theoretically and experimentally. To the best of the authors’ knowledge, no article is yet published in which SLG was used in polymer matrices to produce nanocomposites. One reason could be that the SLG is not yet at everyone’s disposal. However, the trends indicate that the graphene would surpass other reinforcements no sooner it becomes easily available. Therefore, extensive theoretical research has been carried out in the last decade to justify the use of graphene as reinforcement in polymers. Although various reviews are available on graphene and polymers, however, no article is yet published which delineates the advances in the theoretical studies of GBPNCs. Therefore, this review article discusses various modeling and simulation approaches employed to correlate between graphene structure, topography, weight fraction, dispersion state, interfacial interactions, and overall performance of GBPNCs.
2. Modeling of Graphene Based Polymer Nanocomposites
Various theoretical and computational approaches have been employed to explore the effect of graphene as reinforcement on the performance of polymer nanocomposites including but not limited to, quantum mechanical-based methods [28] , Continuum Mechanics (CM) [29] , Molecular Mechanics (MM) [30] , Molecular Dynamics (MD) [31] , atomistic modeling [32] , Density Functional Theory (DFT) [33] , and multiscale modeling [34] . The mechanical, thermal, and electrical properties of GBPNCs have widely been studied. Cao [35] has reviewed the atomistic studies on the mechanical properties of graphene and Allegra et al. [36] have reviewedthe modeling of polymer nanocomposites reinforced with spherical nanoparticles or statistically isotropic aggregates. The high strength and stiffness of graphene significantly improve the mechanical properties of polymer nanocomposites. Cho et al. studied the mechanical properties of graphene-epoxy nanocomposites with a combination of MM and Mori-Tanaka Method (MTM) [37] . The properties of nanocomposites are also dependent on the polymer chain networking. Yarovsky and Evans studied the structure and properties of crosslinked polymers using computer simulations [38] . Awasthi et al. used MD simulation to study the load-transfer mechanism at nanoscale in graphene-polyethylene nanocomposites [39] . Due to the semblance of graphene, it is considered as frame-like structure. In the frame, covalent C-C bonds are taken as beams joined together with carbon atoms placed at the joints. Uniaxial beam elements, defined by their cross-sectional area, material properties, and moment of inertia represent the covalent bonds. The parameters of the beam elements are determined by establishing equivalence between structural mechanics and computational chemistry. To generalize the models for GBPNCs, graphene can be wrapped within a “model material” which represents various kinds of polymer matrices as shown in Figure 4. The model material allows systematic manipulation of influencing factors, and accordingly, it provides a tunable elastic platform to determine the overall performance of GBPNCs. The model material allows methodical variation of material properties beyond the capacity of experimental methods.
3. Atomic Structure
A schematic diagram of a hexagonal unit cell of graphene structure is shown in Figure 5. As graphene is a two- dimensional structure, each carbon atom can undergo chemical reaction from the sides. It is one of the reasons for high chemical reactivity of graphene. The carbon atoms on the edge of SLG have three incomplete bonds that impart especially high chemical reactivity to edge carbon atoms. In addition, defects within graphene sheet

Figure 4. (a) Model polymer material with flexible properties in which (b) graphene can be wrapped for simulation purposes.

Figure 5. Schematic diagram of hexagonal unit cell of graphene structure.
are high energy sites and preferable localities for chemical reactants to attack. All these factors make graphene a very highly chemically reactive entity. The carbon atoms are connected through strong covalent bonds. There is sp2 orbital hybridization between Px and Py that forms σ-bond [40] . The orbital Pz forms π-bond with half-filled band that allows free motion of electrons. These interatomic forces play a crucial part in defining the proficiency of graphene as reinforcement in polymers.
As atoms keep oscillating with characteristic oscillating frequencies, the oscillatory period of carbon atoms for some bounded trajectories reaches terahertz frequencies [41] . To define the trajectory of atoms, Newton’s equation of motion in MD can be used as given in Equation (1) and the relation between force f1 and potential
energy E is given in Equation (2), where mI, rI, and fI are mass of, position of, and force on Ith atom, respectively, and  is potential energy of the N-atom system. The potential energy arises from the bonded
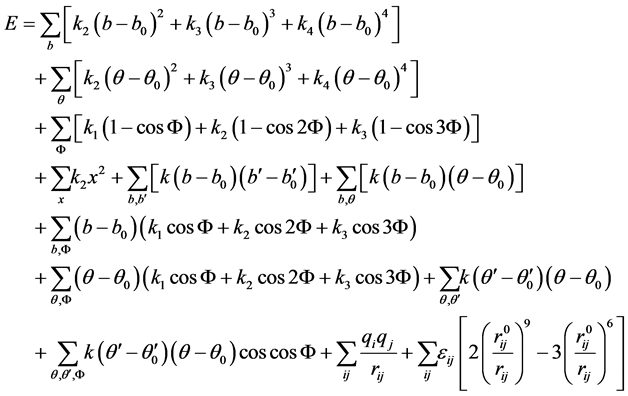
and non-bonded interactions among atoms and molecules. Polymer Consistent Force Field (PCFF) can be used to specify such interactions [42] . The PCFF defines the potential energy components as given in Equation (3) [43] . The first four terms of Equation (3) represent bond, angle, torsion, and dihedral energy, respectively. The other six terms represent cross-terms among various valance energy components, mainly bond and angle. The last two terms define energy arising from Columbic and Van der Walls interactions, respectively. The influence of thermal vibrations on potential energy is addressed by the cross-terms. The total energy of N atoms is represented by Hamiltonian function (H) which can be defined in terms of potential energy (Equation (3)) and is given in Equation (4) while the kinetic energy component is given in Equation (5) [43]
 (1)
(1)
 (2)
(2)
 (3)
(3)
 (4)
(4)
 (5)
(5)
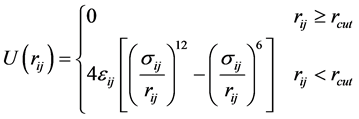
where PI and MI are momentum and mass of Ith atom, respectively. The energetics of the non-bonding interactions between all pairs of atoms can be defined using Lennard Jones potential (LJ-potential) as given in Equation (6) [44] [45] ,
 (6)
(6)
where rij is the separation distance between atoms i and j, and rcut is the cut-off distance. For bonding interactions, the bond-stretch and bond-bending potentials are given by Equation (7) and Equation (8), respectively, and the dihedral potential is given by Equation (9) where Qijkl is the angle formed by i, j, k, and ℓ bonds [45] .
 (7)
(7)
 (8)
(8)
 (9)
(9)
In continuum-nanoscopic approach, also known as quasi-continuum method, every point in the continuum is considered as an extensive region wherein atomistic degrees of freedom are explicitly taken into account [45] . Therefore, when subjected to deformation, that nanoscopic atomistic structure provides the constitutive response of the material. This nanoscopic atomistic structure is also termed as Nanoscopic Representative Volume Element (NRVE). The standard kinematic assumption to relate the atomistic and continuum deformations is the Cauchy-Born rule [46] [47] as expressed in Equation (10) [48] ,
 (10)
(10)
where  and
and  are the distance vectors before and after deformation between the pair of atoms i and j, respectively. The deformation gradient tensor is given by Equation (11) [49] ,
 (11)
(11)
where xij, yij, and zij are the displacements of the local nodes in an arbitrary tetrahedral element. The bond length rij is given by Equation (12) [45] ,
 (12)
(12)
where FT is the transpose of F-matrix. The Green-Lagrange strain tensor E is given by Equation (13) [50] ,
 (13)
(13)
where I is the identity tensor. From Equation (10) and Equation (12), the bond length in terms of Green-La- grange strain tensor is given by Equation (14) and Equation (15) [50] ,
 (14)
(14)
 (15)
(15)
where  is the unit vector in the initial bond orientation between atoms i and j. The relationships for non- bonding pair distance are given by Equations (16)-(18) [45] ,
 (16)
(16)
 (17)
(17)
 (18)
(18)
where rL, r0L, and  are the stretched and un-stretched nonbonding length, and unit vector in the initial bond orientation for bond L, respectively. The cosine of the bond-angle can be written as Equation (19) and Equation (20) [45] ,
 (19)
(19)
 (20)
(20)
where θijk is the angle between triplet of atoms i, j, and k. The consine of dihedral can also be written as Equation (21) where rij, rjk, and rkl are the distances between atoms i and j, j and k, and k and ℓ, respectively, and Qijkl is the dihedral angle between the quartet of i, j, k, and ℓ atoms. Equation (21) can take the form of Equation (22) where the values of α, β, M, and N are defined in Equations (23)-(26), respectively [45] .
 (21)
(21)
 (22)
(22)
 (23)
(23)
 (24)
(24)
 (25)
(25)
 (26)
(26)
The graphene has many other stable configurations apart from honeycomb hexagonal lattice structure. For example, different chemisorbed configurations of epitaxial graphene coexist on single crystal Ni (111) such as top-fcc, top-hcp, and top-bridge [51] . In addition, there are structural defects [52] [53] in graphene which significantly influence its physical and chemical properties [54] . Some of the atomic scale defects are schematically shown in Figure 6, which include atomic vacancies, heptagon-pentagon topological defects, adatoms, and dopants. These defects can be inherited by graphene during growth [55] and can be introduced advertently by resonance plasma [56] , chemical treatment [57] , and irradiation [58] . Surface defects are also introduced during functionalization, oxidation, and reduction [59] . For example, in reduced graphene oxide, the graphene layers are found to comprise of a few nanometers interspersed defect areas dominated by clustered heptagons and pentagons [59] . The first-principles calculations show that atomic-scale defects result in both intravelley and intervalley scattering of graphene and Fermi velocity is decreased in the vicinity of the defects due to enhanced scattering [60] . The electronic properties of graphene are strongly influenced by structural defects that deform the original honeycomb lattice [61] [62] .
4. Topographical Features
The exploitation of topographically modified geometries in synthetic and bio-inspired materials is a novel area of research [63] - [66] . The topographically modified carbonaceous materials are produced by various methods and have found numerous applications [67] - [70] . It was shown that the superior electronic properties of graphene are sensitive to topography [71] . Through their crack deflection modeling, Faber and Evans showed that maximum improvement in fracture toughness, among all other nano-reinforcements, can be obtained using graphene mainly because of its better capability of deflecting the propagating cracks [72] [73] . The schematics of various topographies of graphene are shown in Figure 7 [74] . The graphene sheets have coiled structure that helps them to store sufficient amount of energy [75] [76] . The individual sheet and chunk of sheets together are subjected to plastic deformation at the application of external load. The applied energy is utilized in undertaking plastic work that enhances the ability of graphene to absorb more energy [77] . Graphene has shown inclination

Figure 6. Structural defects in graphene: (a) vacancy; (b) pentagon-heptagon; (c) adatom; and (d) dopant.

Figure 7. Various graphene surface geometries: (a) interior folding; (b) self-contact; (c) maximum confinement; and (d) released and equilibrated. From left to right the structures are (i) pristine graphene, (ii) 8 nm grain size, (iii) 4 nm grain size, and (iv) 2 nm grain size [74] .
for stable folding and bending energy at folds is compensated by intersheet adhesion (Van der Waals interactions) [78] [79] . The individual layers of graphene, under external loadings and thermal stresses, undergo out-of- plane wrapping [80] [81] , rippling [82] [83] , folding [84] [85] , scrolling [86] [87] , and crumpling [88] [89] , making graphene suitable to enhance the toughness of polymers. Wang et al. showed that wrinkle’s wavelength and amplitude are directly proportional to volumetric dimensions of graphene as evident from Equation (27) and eq.(28), where λ is wrinkle wavelength, ν is Poisson’s ratio, L is the length of graphene sheet, t is thickness of graphene sheet, ε is edge contraction on a suspended graphene sheet, and A is wrinkle amplitude [90] .
 (27)
(27)
 (28)
(28)
The topographical features of graphene can be observed experimentally and explored using computer simulations [91] - [96] . Abedpour et al. used both analytical and MD-based numerical simulations and correlated the surface topography of graphene with thermal fluctuations [97] . The Monte Carlo-based simulations predicted the formation of spontaneous ripples on graphene surface at finite temperatures. The ripple amplitude is comparable with the interatomic distance of graphene C-C covalent bonds (~0.142 nm) and was found independent of the total length of graphene sheet. It was also observed that the spontaneous ripples had a characteristic wavelength of about 8 nm [98] . Therefore, rippling being the intrinsic feature of graphene sheet is expected to strongly influence the mechanical properties of graphene and graphene based nanocomposites. Liu and Zhang carried out MD simulations to study the influence of thermal fluctuations on bending rigidity of graphene [99] . Montazeri and Rafii-Tabar observed an exponential drop in bending rigidity and lower axial Young’s modulus with increasing temperature in graphene-PMMA nanocomposites [100] . It can be attributed to bond breakage. Graphene has sp2 hybridization which is stronger than sp3 hybridization found in diamond. Therefore, graphene shows superior mechanical properties. However, at the application of elevated temperatures, C-C bonds deteriorate and protrude out of the graphene plane. These misaligned bonds do not offer their intrinsic mechanical strength in the axial direction. The graphene sheets are held together by weak Van der Waals forces which can be subdued quite easily making sheet sliding inevitable in Multi-Layered Graphene (MLG). It was also observed that Young’s modulus significantly decreased due to layer sliding at different temperatures [100] .
To model dynamics and energetics of graphene C-C covalent bonds, second-generation Brenner many-body interatomic potential can be used [101] [102] . The Brenner potential is given by Equation (29) [103] ,
 (29)
(29)
where  and
and  are the repulsive and attractive pair-wise interactions, respectively,
  is the
distance between pairs of nearest-neighbor atoms i and j, and  denotes the reactive empirical bond order depending on the local bonding environment [100] . The simulation temperature during MD simulation can be maintained through Nosé-Hoover thermostat [104] . Montazeri and Rafii-Tabar used MD simulations to produce ripples on the surface of graphene to study the influence of ripples on graphene surface due to thermal fluctuations on axial Young’s modulus of graphene-PMMA nanocomposites [100] . The macroscopic behavior of the model was studied using finite element method as shown in Figure 8 [100] . The model was subjected to tensile load to produce 5% strain. The Young’s modulus was calculated using Equation (30) [100] , where F is the total force acting at the end of Representative Volume Element (RVE) (nN), Ho is the initial length of RVE (nm), and ΔH is the elongation. The obtained value of axial Young’s modulus of graphene-PMMA nanocomposite was 59.536 GPa [100] . The experimental results are much lower than the experimentally measured values. It can be attributed to the non-random distribution of graphene in polymer matrix considered in the model. The experimentally produced nanocomposites contain random distribution of graphene
 (30)
(30)

Figure 8. Finite element macroscopic model of RVEs with 5 vol% graphene-PMMA [100] .
along with agglomerated graphene. In addition, the proposed model considers perfect structure of graphene. On the contrary, the actual graphene contains surface and structural defects which may deteriorate the mechanical properties of graphene and produced nanocomposites. An additional influential factor could be layer sliding which was not considered in the modeling approach but takes place in reality due to weak Van der Waals interactions between the graphene layers.
5. Interfacial Interactions
The schematic diagram illustrating the interfacial interactions between graphene and polymer matrix is shown in Figure 9. When the nanocomposite is subjected to tensile loading, one possibility is that the graphene C-C bonds get broken. However, the strength of graphene C-C bond as measured by Lee et al. is approximately 130 GPa [105] . On the contrary, the strength of polymers is usually far below 100 MPa and that of nanocomposites also hardly exceeds 100 MPa. Therefore, this phenomenon of C-C bond breakage stretches the limits of plausibility too far. In addition, in non-functionalized carbonaceous reinforcements, usually the reinforcement-matrix bonding consists of weak Van der Waals interactions, physical bonding, and mechanical interlocking. Hu et al. proposed that the Van der Waals forces are responsible for the interfacial interactions in CNTs-polystyrene nanocomposites [106] . These forces are much weaker than C-C covalent bonds. Therefore, it is highly likely that the graphene sheet is pulled-out. The energy is required to drag the graphene out of the polymer matrix to circumvent Van der Waals interactions and physical bonding. This energy dissipation will eventually increase the mechanical properties of nanocomposites. However, this increase would not be commensurate with the abilities of graphene as reinforcement. Therefore, extensive research has been carried out to modify the surface of graphene by functionalization to improve interfacial interactions [107] - [111] .
According to ASM Handbook on composites (vol. 21 [1] ), “when interfacial bond strength is very large, the failure mode changes from interfacial to matrix, and the composite behaves like a brittle material, that is, it becomes ‘notch-sensitive’. Thus, excessive fiber-matrix bond strength may have a detrimental effect on the longitudinal tensile strength of the composite.” However, to the best of our knowledge, no article is yet published on GBPNCs and previously on CNTs reinforced polymer nanocomposites where the interfacial interactions were reported strong enough to have detrimental effect on mechanical properties. Instead, research is still ongoing to further improve the interfacial interactions. Das et al. have shown that mechanical properties of Polyvinyl Alcohol (PVA) significantly increased when reinforced with functionalized few layer graphene [112] .
The improvement in mechanical properties of GBPNCs significantly depends on interfacial interactions as load must efficiently be transferred from the matrix to the reinforcement to alleviate the stress concentration in relatively weaker matrix phase. One of the factors influencing interfacial interactions is interfacial area. The interfacial interactions can significantly be improved with increasing interfacial area. Interfacial area can be increased by reducing reinforcement size and by altering the topography as shown in Figure 10. By texturing the topography, the surface area can significantly be increased even when the size of the sheet is unaltered. With the

Figure 9. Graphene-polymer interfacial interactions: either C-C covalent bond breaks or graphene pull-out takes place. Interfacial interactions can be improved by functionalization.

Figure 10. Difference in surface areas of flat and topographically modified surfaces. Surface area significantly increases with textured topography.
increase in surface area, interfacial area with polymer matrix also increases which can significantly improve the mechanical properties of nanocomposites. In addition to that, mechanical interlocking between polymer and reinforcement will take place which can cause a further increase in the mechanical properties of nanocomposites as shown in Figure 11. When reinforcement has smooth surface, there will be poor physical bonding between reinforcement and matrix. However, when reinforcement has corrugated surface, polymer chains will be locked within the spongy structure of reinforcement. This mechanical interlocking can significantly increase the interfacial interactions and concomitant rise in mechanical properties. Surfaces can be made porous or rough to enhance the extent of mechanical interlocking [113] . Karger-Kocsis et al. have studied that hierarchical and hairy fillers have high surface area and capillary wetting by the polymers [114] . The textured fillers also exhibit mechanical interlocking with the polymers and cause local reinforcement of the fiber-matrix interphase [114] . Moon and Jang studied the mechanical interlocking and wetting at the interface between argon plasma treated Ultra-High Modulus Polyethylene (UHMPE) fiber reinforced vinylester resin composite [115] . They observed a significant rise in interlaminar shear strength. It has been shown that plasma etching of UHMPE produces micro-pittings on fiber surface and this spongy surface structure helps improving the mechanical interlocking with the polymer matrix and causes a significant increase in interlaminar shear strength [116] - [119] . Therefore, mechanical interlocking can play a significant role in improving the mechanical properties of GBPNCs.
The graphene-polymer interactions can be defined via LJ-potential wherein spring elements with a nonlinear behavior can be used to couple the graphene and polymer matrix [120] [121] . The graphene sheets bear a major fraction of applied load and as a result, graphene sheets undergo buckling. Parashar and Mertiny developed a multiscale model using finite elements to investigate the phenomenon of graphene buckling in GBPNCs [122] . Lindahl et al. studied the snap-through behavior of convex buckled graphene membranes under the applied electrostatic pressure and reported that bilayer graphene shows a bending rigidity of ~35.5 eV [123] . Depending on the type of interfacial interactions, two main types of buckling takes place: (a) cooperative buckling, and (b) discrete buckling. In cooperative buckling, buckling occurs in the member simultaneously, equally, and in the same direction. Cooperative buckling occurs when interfacial interactions are strong enough to withstand the applied force. Consider a graphene based polymer material as shown in Figure 12(a) subjected to compression loading [124] . When load exceeds the compressive strength, member buckles. When interfacial interactions are strong enough, cooperative buckling takes place as shown in Figure 12(b). The total potential energy, Π1, of the elastic member subjected to cooperative buckling is given by Equation (31), where b is sample width, D0 is bending rigidity,  is the curvature under buckling, and P is applied axial force. This model allows a first-order (e.g. linear) analysis of graphene based nanocomposites. The first term in Equation (31) belongs to elastic bending energy while second term is measure of work done [124] .
In discrete buckling, also known as delaminated buckling, all layers buckle in disparate way. As indicated by

Figure 11. Topographical features influencing mechanical interlocking: (a) poor mechanical interlocking due to smooth surface of grapheme; and (b) strong mechanical interlocking due to locking of polymer chains in the grooves on graphene surface.

Figure 12. Schematic diagrams of: (a) graphene based elastic member; (b) cooperative buckling; and (c) discrete buckling [124] .
name, discrete buckling occurs when interfacial interactions are not strong enough to withstand the applied force. When compressive load exceeds the compressive strength and interfacial interactions are poor, delamination and discrete buckling take place as shown in Figure 12(c). The total potential energy of elastic member undergoing delaminated buckling, Π2, is mentioned in Equation (32), where D1 and D2 are bending rigidities of materials 1 and 2, and γ(u) is adhesion energy [124] . The first two terms in Equation (32) belong to elastic bending energy, third term is measure of work done, and fourth term is energetic cost of delamination. This discrete buckling may or may not lead to large-scale delamination or wrinkling of composite sandwich structure. The bending mode depends on the change in effective bending stress which is given by Equation (33). If work done by ap-
plied force is independent of buckling case, then change in potential energy ( ) is given by Equa-
tion (34). Delamination occurs when ΔΠ > 0, and does not occur when ΔΠ < 0 [124] .
To determine whether cooperative buckling occurs or discrete buckling, Ritz method can be used [125] [126] . The approximate displacement function, u(x) is given by,  ,
,  , and
, and ,
,
where C is an undetermined coefficient and satisfies the boundary conditions for both the cases shown in Figure 12 [124] . It defines the zero rotation at the extremities and is different from Euler buckling case in which zero rotation is enforced at the extremities for classical presumed displacement function. The Ritz method provides a conservative approximation as it is unlikely that exact displacement function, u(x), is constant for both cases. Therefore, the Rtiz method imposes the displacement equivalence. A harmonic approximation is supposed for the change in adhesion energy as given by Equation (35), where k is the stiffness of adhesion (eV/Å4). From these values, ΔΠ is given by Equation (36) [124] ,
 (31)
(31)
 (32)
(32)
 (33)
(33)
 (34)
(34)
 (35)
(35)
 (36)
(36)
minimizing with respect to C and setting values as in Equation (37) and Equation (38) [124] ,
 (37)
(37)
 (38)
(38)
above equations give the critical condition for ΔD as given by Equation (39) [124] .
 (39)
(39)
If ΔD < kL4/120, the change in stiffness from cooperative to discrete is not sufficient to overcome the adhesion. In this case, cooperative buckling is preferred mode when ΔΠ < 0. In case when ΔD > kL4/120, the change in stiffness from cooperative to discrete is sufficient to overcome adhesion. In this case, discrete buckling occurs when ΔΠ > 0. The discrete buckling can be avoided by improving the interfacial interactions [124] .
6. Dispersion State
The graphene is unfortunately produced in entangled form and even if it is somehow dispersed, it tends to re- aggregate due to attractive Van der Waals forces [127] . The graphene agglomeration depends on size, shape, synthesis methods and surface chemistry. The utilization of graphene to enhance the properties of the system to which it is going to reinforce is fairly dependent on its dispersion state [128] . The schematic diagrams of agglomerated and uniformly dispersed graphene are shown in Figure 13. Because of extremely large surface area (~2500 m2/g) and the fact that commercially available graphene is heavily entangled restricts uniform dispersion of graphene in polymer matrix. It is a great barricade in its research and commercial applications. Instead of using agglomerated graphene, it is beneficial for the composite properties to use non-agglomerated graphene, as inter-layer sliding and the fact that aggregates act as stress concentrators can deteriorate the composite strength. The issue of graphene dispersion in polymer matrix has yet not been entirely outwitted, particularly for graphene fraction above a few wt% [129] .
There are two main methods for graphene dispersion. In the first method, the graphene can be separated by applying some external force, such as mechanical mixing and sonication, and is then stabilized by enclosure in a polymer or surfactant complex [130] [131] . It prevents the re-aggregation of graphene. This method can be used to form metastable dispersion. In the second method, the graphene is added in a suitable solvent where the graphene peel off from the bundle layer by layer and is dissolved in the solvent forming a solution [132] .
E.g., super-acids can dissolve graphene in large quantities [133] . In principle, the dispersion of graphene in polymer matrix can be controlled during the production route at two different stages. Firstly, the dispersion state in the uncured state can be tailored with the help of chemical functionalization, mechanical mixing, or by using surfactants. Secondly, dispersionstate significantly alters during curing stage [90] . There are chances of graphene agglomeration if curing requires high temperature. The extent of curing impact on the dispersion state of graphene depends on the curing temperature, time, chemical composition of matrix, and the way of heat input [134] .
The enhancement in the properties of GBPNCs by graphene is still not commensurate with the abilities inherited in the graphene structure [135] [136] . MD simulations showed that uniformly dispersed graphene is more effective in increasing the stiffness of polymers than poorly dispersed graphene [43] . Rahman studied the modeling of three different dispersion states of graphene as shown in Figure 14 [43] . The three dispersion states are, (a) SLG, (b) uniformly dispersed graphene, and (c) agglomerated graphene. Each unit cell contains about 3 wt% graphene with P3m space group symmetry of graphene sheet [137] . The calculations were carried out using open source molecular dynamics code LAMMPS developed at Sandia National Laboratory [138] . To get stress- strain response using MD method, the unit cells were subjected to engineering strain of 1 × 10⁻⁴ under NVT ensemble at every 300 steps up to 1500 steps. The temperature was fixed at 0.1 K. The energy, temperature, and pressure trends obtained during MD equilibration are shown in Figure 15 [43] . It was observed that stiffness of uniformly dispersed graphene-epoxy was higher than agglomerated graphene-epoxy nanocomposites [43] .
7. Aspect Ratio
The schematic diagram of various aspect ratios of graphene is shown in Figure 16. Although surface and interfacial areas are independent of the Aspect Ratio (A.R) of graphene, studies show that the aspect ratio of gra-

Figure 13. Dispersion state of graphene: (a) agglomerated grapheme; and (b) uniformly dispersed graphene in polymer matrix.

Figure 14. Schematic diagram of stacked graphene model [43] .

Figure 15. Typical temperature, total energy, and pressure plots at different times of FGrM [43] .

Figure 16. Various aspect ratios of rectangular graphene sheets.
phene is an influential factor for the performance of GBPNCs. Rahman carried out modeling of graphene-epoxy nanocomposites with graphene of two different aspect ratios: length to width≥: (a) 5, and, (b) 10 [43] . The graphene sheets were randomly distributed in the unit cell. The molecular models were constructed using XENOVIEW with PCFF and unit cells subjected to Periodic Boundary Condition (PBC). PBC was applied by “wrapped around” fashion. For any atom with spatial coordinate xi: i = 1, 2, 3., if xi > Li, then,
 (40)
(40)
and if xi < 0, then,
 (41)
(41)
here, Li: i = 1, 2, 3, represents the lengths of unit cell along x, y, z directions [43] .
Rahman observed that uniformly dispersed graphene with high aspect ratio can significantly improve in-plane Young’s modulus [43] . It is because the in-plane Young’s modulus of graphene is as high as 1 TPa.
However, graphene is not effective in increasing the out-of-plane Young’s modulus. It is because the out-of- plane stiffness depends on the modulus of polymer and Van der Waals interactions between graphene-graphene and graphene-polymer. It was observed that experimental Young’s modulus was higher for smaller aspect ratio than the larger one [43] . The highest shear modulus (G) was observed in case of smaller aspect ratio and at 1 wt% graphene. The influence of graphene aspect ratio on G1C is shown in Figure 17 [95] . When the A.R is 1.4, the increase in G1C is 18%. And at A.R = 2.8, the increase in G1C becomes 24%. It shows that the G1C and fracture toughness increase with increasing aspect ratio of graphene [95] .
Cranford studied the mechanical properties of graphene with different longitudinal lengths and observed that maximum deviation was shown by smallest effective length of 50 Å [124] . It can be attributed to inner graphene sheets which undergo local crumpling prior to buckling. The outer layers undergo axial compression under the influence of applied load. These two factors may add up to raise the local adhesion energy by increasing the molecular density. Therefore, the local stiffness of adhesion is enhanced even when energy per atom is constant. In addition, local fluctuations in structure caused by thermal vibrations yield shear/torsional deformations that

Figure 17. Effect of graphene aspect ratio and dispersion on SERR G1C [95] .
increase the difference in predicted and measured values. Depending on effective stiffness and adhesion strength, either cooperative ordiscrete buckling occurs. A trade-off among critical length (L), stiffness of adhesion (k) and effective rigidity (D) is critical in initial designing of molecular composites. Buckling of graphene layers and interfacial delamination are most commonly observed failure modes in GBPNCs. To avoid such failures, minimum length scale and adhesion energy are necessary to avoid delamination under compressive forces.
8. Weight Fraction
The schematic diagram of varying weight fractions of graphene in polymer matrix is shown in Figure 18. Due to very high surface-to-volume ratio and attractive Van der Waals forces causing agglomeration of graphene, a uniform dispersion of graphene in polymer matrix becomes quite difficult beyond certain weight fraction. In most of the reported literature, the mechanical properties increased up to 1 wt% of graphene and decreased afterwards which can be attributed to agglomeration of graphene and generation of cracks around the graphene agglomerates [90] [139] . The MTM showed increasing values of Young’s modulus with increasing weight fraction of graphene [140] . However, in atomistic simulation, the results showed that Young’s modulus increases up to certain weight fraction of graphene and then starts decreasing depending on the parameters [43] . It is because the micromechanics model such as MTM takes a homogeneous unit cell for calculations. Therefore, it shows a continuously increasing trend of Young’s modulus with increasing weight fraction of graphene. However, in atomistic model, various influential factors contribute toward the outcome such as spatial distribution of atoms, change in molecular energy in the system, and atom density etc.
Rahman developed two different types of models: Fixed Graphene Model (FGrM), and Varying graphene model (VGrM), and studied three different weight fractions of graphene (1 wt%, 3 wt%, and 5 wt%) [43] . The range of unit cell density was 0.7 - 1.0 g/cm3. The weight fraction of graphene was varied by changing the number of epoxy molecules in the unit cell. Each unit cell contained one graphene layer. As graphene layer is fixed in each unit cell, this model was termed as “Fixed Graphene Model (FGrM)”. The alternative way of changing the weight fraction is by changing the number of graphene sheets in the unit cell while number of epoxy molecules is kept constant. In this case, there is no significant change in the total number of atoms in the unit cell. As graphene layer is varied in each unit cell, this model was termed as, “Varying Graphene Model (VGrM)”. The conventional molecular dynamics scheme can be used to equilibrate the model to get the final configuration. The schematic of the unit cell is shown in Figure 19 [43] .

Figure 18. The weight fraction of graphene in polymer matrix increases from (a) to (d).

Figure 19. Construction of graphene-epoxy model by randomly positioning the graphene and epoxy in a unit cell [43] .
Rahman produced epoxy-graphene nanocomposites to determine the validity of developed models [43] . The graphene was dispersed using a combination of tip sonication and magnetic stirring. It was observed that Young’s moduli as calculated by FGrMs were slightly lower than from VGrMs. This variation can be attributed to change in number of electrons in the unit cell. The total number of atoms reduces as the weight fraction of graphene increases. Also, the total number of atoms in FGrMs is lower than in VGrMs. Moreover, there was large variation in atom density of FGrMs. Therefore, large variation is expected in the elastic constants obtained from FGrMs. However, the average stress is calculated based on all the atoms in the unit cell. It reduces the influence of cell size on overall stress-strain response resulting in negligible variation in Young’s modulus. In both modeling and experimentation, Rahman observed that mechanical properties increase up to a certain weight fraction and decrease afterwards [43] . Rafiee also showed that Young’s modulus increases up to a certain weight fraction of graphene and decreases afterwards [44] . The results obtained indicate that atomistic modeling approach is more accurate than micromechanics approach. The decrease in elastic constants with increasing graphene content can be attributed to the inevitable possibility of agglomeration and void content because of inter- graphene layer gap and graphene-polymer gap [141] .
9. Constitutive Response
The values of critical stress, strain, and Young’s modulus of SLG supported on perforated Si substrate were recorded using Atomic Force Microscopy (AFM) nanoindentation test and values obtained were 130 GPa, 25%, and 1 TPa, respectively [105] . In SLG, there are few slip systems available as no alternative plane is available for glide and Debelak and Lafdi have shown that shear and glide takes place along [001] direction in MLG [142] . The stress tensor σij can be calculated using virial expression as given in Equation (42) [43] ,
 (42)
(42)
where Vol is volume of the simulation box, MI is mass of Ith atom,  is velocity of Ith atom in Ith direction, N is total number of atoms,
  ij-component of distance between Ith and Jth atoms, and
  is ij-component of
force between Ith and Jth atoms. When uniaxial deformation is applied using uniaxial tension or compression, the total potential energy changes which can be used to determine elastic constants. The internal stress tensor can be calculated by taking the first derivative of potential energy with respect to strain. The second derivative of potential energy with respect to strain yields stiffness matrix and deformation in unit cell is given by Equation (43) where the corresponding stresses in the system ( and
and ) are calculated using Equation (42) [43] . The stiffness components can be written as given in Equation (44) where σi is ith component of internal stress tensor, and
  and
and  are stress tensors under tension and compression, respectively, and elastic properties of the system can be calculated using Equations (45)-(47) [43] . By using the MD simulation, the average stress in the system can be calculated using Equation (48) where σ11, σ22, and σ33 are the virial stresses in x, y, and z directions, respectively, and
  is the average stress of the unit cell [43] . The stress-strain response can be evaluated by applying strain to the system repeatedly followed by MD equilibration. The Young’s modulus can be calculated from the slope of initial linear portion of stress-strain curve.
Ebrahimi et al. used the conjugate pair of the Green-Lagrange strain and the second Piola-Kirchhoff stress tensor to study the stress-strain response of graphene-chitosan nanocomposites under large deformations [45] . The strain energy density and inter-atomic potential, u, of the atoms within the NRVE is given by Equation (49)
where  is the sum of potential energies of the atoms in NRVE, and
VRVE is the volume of NRVE [45] . The second Piola-Kirchhoff stress tensor, T, is given by Equation (50) [50] , and can be converted to Cauchy stress tensor using Equation (60) [143] [144] , where J is the Jacobian of the deformation. The constitutive response of nanocomposites is dependent on the ratio of element volume (VEL) to NRVE volume (VNRVE) as in Equation (61) [45] . The variation in Cauchy stress in NRVE of chitosan with uniaxial strain at different values of R is shown in Figure 20. The values of yield stress and tensile modulus are close to experimental values. The variation in tensile modulus with R is shown in Figure 21 which shows that tensile modulus becomes less sensitive to R as value of R increases and finally becomes independent of R [45] . The variation in Cauchy stress with uniaxial strain in chitosan when reinforced with graphene and (10, 10) armchair carbon nanotubes is shown in Figure 22. The carbon nanotubes were supposed to be immovable during simulation and graphene sheets were aligned along the principle stress axis. The graphene showed a higher increase in strength and modulus than carbon nanotubes.

Figure 20. Variation in Cauchy stress with strain in NRVE in pure chitosan for various values of R [45] .

Figure 21. Tensile modulus versus R for pure chitosan corresponding to the cubic sample partitioned into five finite elements [45] .

Figure 22. Cauchy stress-strain variations for chitosan-graphene and chitosan-CNT nanocomposites corresponding to the cubic sample partitioned into five finite elements and R ≈ 1.0 [45] .
 (43)
(43)
 (44)
(44)
 (45)
(45)
 (46)
(46)
 (47)
(47)
 (48)
(48)
 (49)
(49)
 (50)
(50)
 (51)
(51)
 (52)
(52)
 (53)
(53)
 (54)
(54)
 (55)
(55)
 (56)
(56)
 (57)
(57)
 (58)
(58)
 (59)
(59)
 (60)
(60)
 (61)
(61)
10. Toughness Enhancement
The ability of a material containing crack to resist fracture, known as fracture toughness, is a simple yet trustworthy indicator of the material’s damage tolerance and hindrance against fracture, and is considered as one of the most important mechanical properties of the engineering materials. The fracture toughness depends on how the pre-existing and newly formed cracks propagate within a material. The plane strain fracture toughness (critical stress intensity factor, K1C) can be calculated using Equation (62), where Pmax is maximum load of load-dis- placement curve (N), f(a/w) is constant related to geometry of the sample and is calculated using Equation (63), B is sample thickness (mm), W is sample width (mm), and a is crack length (should be kept between 0.45 W and 0.55 W according to ASTM D5045) [128] . The critical strain energy release rate (G1C) can be calculated using Equation (64), where E is the Young’s modulus obtained from the tensile tests (MPa), and ν is the Poisson’s ratio of the polymer. The geometric function f(a/W) strongly depends on the a/W ratio as shown in Figure 23 [145] .
Parashar and Mertiny developed three dimensional RVE based multiscale model in finite element environment to study the influence of graphene on the fracture characteristics of graphene-polymer nanocomposites [95] . The polymer matrix was modeled as a continuum while graphene was modeled in atomistic state. The truss elements were used to simulate Van der Waals interactions between graphene and polymer. Virtual crack closure technique was employed to study the fracture characteristics of the nanocomposites. The bonded interactions between C-C bonds were defined by modified Morse potential [146] [147] . The potential energy (E) of isolated graphene sheet is given by Equations (65)-(67) [95] , where ES is bond-stretching component of potential energy (J), EB is angle-bending component of potential energy (J), De is dissociation energy (Nm), β is constant controlling the width of the potential (m−1), r is C-C bond length (m), r0 is C-C equilibrium bond length

Figure 23. Variation in geometric function f(a/W) with normalized crack length (a/W) [145] .
(m), KӨ is force constant for bond bending (N∙m/rad2), Ө is current angle of the adjacent bond (rad), Ө0 is initial angle of the adjacent bond (rad), and Ksextic is constant in bending term of potential (rad−4). The continuum polymer matrix, atomistic graphene structure, and interface were modeled using SOLID45, BEAM4, and LINK8, respectively, in ANSYS finite element software [95] . The opening mode crack propagation was simulated by the subsequent release of node constraints under plane stress condition. By differentiating Equation (66), the interatomic force acting between the two C-C atoms can be calculated as Equation (68) and material stiffness values can be assigned to each truss element using Equation (69) [95] .
 (62)
(62)
 (63)
(63)
 (64)
(64)
 (65)
(65)
 (66)
(66)
 (67)
(67)
 (68)
(68)
 (69)
(69)
The stress-strain behavior of C-C bonds, configuration of multiscale model, and variation in G1C with graphene volume fraction are shown in Figures 24-26, respectively [95] . The improvement infracture toughness

Figure 24. Non-linear stress-strain relation for a C-C bond developed from Morse potential [95] .

Figure 25. Finite element structure of multifunctional model [95] .

Figure 26. Effect of graphene volume fraction on SERR G1C [95] .
can be attributed to variation in stress distribution by graphene in the polymer matrix. Because of high stiffness and space frame structure, graphene absorbs most of the applied load. The graphene also shields the crack tip from crack-driving forces and opening loads. The modeling results showed that when graphene is present on both sides of the crack plane, the crack tip shielding effect is more pronounced.
11. Thermal Properties
Because of superior thermal conductivity of graphene, GBPNCs are promising candidates for high-performance thermal interface materials. The dissipation of heat from electronic devices may also be barricaded when thehigh thermal conductivity of graphene is efficiently utilized. The graphene has shown higher efficiency in increasing the thermal conductivity of polymers than CNTs [148] . It has been found experimentally that the effective thermal conductivity (Keff) of GBPNCs has a non-linear dependence on graphene weight fraction [149] - [151] . Xie et al. proposed an analytical model to determine effective thermal conductivity of graphene based nanocomposites [152] . Their model proposed very high thermal conductivity values as the model did not take into account the interfacial thermal resistance. Lin et al. developed a model based on Maxwell-Garnett effective medium approximation theory to determine effective thermal conductivity of graphene based nanocomposites [153] [154] . They showed that the enhancement in thermal conductivity is strongly influenced by aspect ratio and orientation of graphene. Hu et al. used molecular dynamics approach to show that the agglomeration of graphene is of major concern in increasing the thermal conductivity of the system [155] .
The theoretical calculations predict thermal conductivity values of polymer nanocomposites far greater than the experimental values [156] . It can be explained on the basis of Thermal Boundary Resistance (TBR, also known as Kapitza resistance) between graphene and polymer chains [157] . The heat transfer in composite system is restricted by interfacial thermal resistance arising from weak phonon-phonon coupling which leads to backscattering of phonons at the boundary region. The interfacial thermal resistance increases with increasing interfacial area. Therefore, this resistance becomes quite significant in case of graphene because of its high surface area. The heat transfer takes place as a consequence of Brownian motion of discrete thermal walkers [158] . In Brownian motion, the thermal walkers exhibit random changes in motion in each time step and can be modeled using random algorithm [159] - [162] . In each space direction, these position changes take values from a normal distribution with a zero mean and a standard deviation depending on the thermal diffusivity (Dm) and the time increment (Δt) as given in Equation (70) [156] .
 (70)
(70)
The TBR (Rbd) is introduced at graphene-polymer interface by a phonon transmission probability (fm-GA) which can be measured according to acoustic mismatch theory as given in Equation (71) [163] ,
 (71)
(71)
where ,
,  , and
, and  are the density of, specific heat of, and sound velocity in polymer matrix, respec-
tively. The improvement in thermal conductivity can be theoretically described by the percolation theory using a power law relationship as given in Equation (72) [164] - [169] ,
 (72)
(72)
where  and
and  are thermal conductivity and volume fraction of graphene, respectively,
  is percolation
threshold, and t is universal critical exponent. A comparative infrared microscopy technique can be used to measure thermal properties of nanocomposites [156] . The thermal properties can be approximated by Fourier’s law [170] [171] . The variation in thermal conductivity of graphene-PMMA nanocomposites with varying graphene content is shown in Figure 27 [156] . The thermal conductivity increases up to 3.5 times of pure PMMA at 2.5 vol% of graphene. The increase in thermal conductivity may be attributed to large contact area and strong interface between graphene and matrix. As there are strong π-π interactions between graphene-graphene, the TBR between graphene-graphene can be neglected. However, the TBR between graphene-PMMA must be considered and taken as 1.906 × 10⁻⁸ m2K/W [172] . When graphene is oriented along the heat flux, higher Keff values are obtained due to efficient heat transfer channel provided by graphene. However, when graphene is oriented

Figure 27. The thermal conductivity of GA-PMMA composites as a function of graphene volume fraction. Inset is the set-up scheme for comparative infrared microscopy technique, where the amorphous quartz is used as reference material [156] .
perpendicular to the direction of heat flux, lower Keff values are obtained due to TBR. The modified effective medium theory to estimate Keff is given in Equation (73) [156] ,
 (73)
(73)
where  is TBR between graphene and PMMA, H is thickness of Functionalized Reduced Graphene Oxide (m-rGO) sheets,
  is thermal conductivity of graphene,
  is thermal conductivity of PMMA, and f is
volume fraction of graphene. The results show that the values predicted by EMT are greater than experimental values. One main reason for this is the particle size distribution which EMT does not take into account. In general, a large particle size distribution can increase the filling ratio as the finer particles can fill in the interstitial sites created by larger particles. The higher filling ratio helps in making strong networks of graphene which can significantly increase the thermal conductivity values compared with narrow size distribution.
Chu et al. proposed an analytical model based on Differential-Effective-Medium (DEM) theory to determine the thermal properties of graphene based nanocomposites [173] . The DEM theory can be used to effectively describe the thermal properties of composites [174] - [176] . Chu et al. considered the Graphene Nanoplatelets (GNPs) as oblate spheroid with very large aspect ratio and considered the isotropic two phase composite system. The composite system was considered with temperature field  and heat flux
  which are given by Equation (74) and Equation (75) [173] , respectively, where d(T) is temperature distribution function.
 (74)
(74)
 (75)
(75)
The solution for the temperature fields, Tp and Tm, within the dispersed particles and surrounding matrix, respectively, is given by Equation (76) [173] ,
 (76)
(76)
where Hj is the depolarization factor of the ellipsoidal particles along j-axis, km is the thermal conductivity of matrix, and kj is thermal conductivity of GNP along j-axis [173] . The depolarization factor (H) obeys the following equation, 2Hx + Hz = 1, where,
 (77)
(77)
Equation (76) can be used to approximate the dependency of effective thermal conductivity of nanocomposites on the reinforcement volume fraction as given in Equation (78) [174] [176] ,
 (78)
(78)
when the initial condition is kept k* = km at GNP volume fraction f = 0, Equation (78) can be written after integration as Equation (79) [173] ,
 (79)
(79)
where Kz and Kx are the thermal conductivity values of GNP along longitudinal and transverse axes, respectively. At a very large aspect ratio ( ), the values of Hx and Hz can be taken as zero and unity, respectively. Therefore, Equation (79) can be simplified as Equation (80) [173] .
 (80)
(80)
To consider interfacial thermal resistance, Chu et al. considered GNP as core-shell structure as shown in Figure 28 [173] . The interfacial boundary layer has thickness c and thermal conductivity values of ks and the effective thermal conductivity can be written as Equations (81)-(83) [154] , where Θ is the dipolar factor of shelled GNPs [177] . When interfacial thermal resistance is incorporated, the effective thermal conductivity of graphene based nanocomposites is given by Equation (84) [173] . Liu et al. also proposed the model based on Effective Medium Approximation (EMA) theory to determine effective thermal conductivity of graphene based nanocomposites as given in Equations (85)-(87) [153] . When interfacial thermal resistance is incorporated, the model takes the form as Equation (88) with comparison of the results shown in Figure 29 [173] .

Figure 28. A core-shell GNP with coating with a very thin interfacial boundary layer [173] .

Figure 29. Comparison between the theoretical and experimental results [173] .
12. Electrical Properties
Tailoring the electrical properties of graphene can unlock many potential electronic applications of graphene [178] [179] . For example, effective gauge fields are introduced when lattice deformation of graphene takes place. Like the effective magnetic field, the produced effective gauge fields influence the Dirac fermions [180] . The Fermi level in undoped graphene lies at the Dirac point where the minimum conductivity values are achieved [181] . By adding free charge carriers, i.e. dopants, the electrical properties of graphene can be improved and conductivity increases linearly with carrier density [182] [183] . For example, boron as dopants can contribute ~0.5
 (81)
(81)
 (82)
(82)
 (83)
(83)
 (84)
(84)
 (85)
(85)
 (86)
(86)
 (87)
(87)
 (88)
(88)
carriers per dopant in graphene sheet [184] . Dopants can be introduced during the synthesis of graphene using Chemical Vapor Deposition (CVD) [185] .
Due to graphitic composition, graphene exhibits excellent electrical conductivity. The charge carrier mobility of graphene at room temperature is as high as 15,000 cm2/Vs [186] . When graphene is uniformly dispersed in the polymer matrix, graphene can provide efficient pathways for conduction which can boost electrical conductivity of nanocomposites. At a certain graphene loading, the electrical conductivity of GBPNCs shows a drastic increase and they lose insulating character and start behaving like conductors. This graphene loading is called as percolation threshold and is usually taken at thirteen orders of magnitude increase in the electrical conductivity of produced nanocomposite [187] - [189] . The percolation threshold should be as low as possible in order to decrease the use of graphene. The dispersion state or degree of agglomeration of graphene is known to have a significant influence on the percolation threshold and electrical conductivity of GBPNCs [190] . The key factors influencing the percolation threshold include, dispersion state, physicochemical interactions between the matrix and the reinforcement, shape of the reinforcement, and method to produce nanocomposite. The conductivity models can be classified into three main categories: (1) structure-oriented [191] , (2) thermodynamic [192] , and (3) statistical [187] [193] . The structure-oriented models consider the microstructure of nanocomposites before and after the processing. As properties are strongly dependent on microstructure, therefore the structure-oriented models give a more realistic approach to predict conductivity behavior of nanocomposites. In certain cases, when achieving the actual microstructure is difficult, the structure-oriented models replace the microstructure with fitting parameters. However, these fitting parameters are not a true replacement of actual microstructure especially at nano-scale.
The electrical conductivity of nanocomposites strongly depends on the microstructure. When polymer is filled with a conducting nano-filler, conduction of the produced nanocomposite depends on how the nano-fillers are aligned [194] . The nano-fillers should make a continuous network to provide a swift conductive pathway for the electrons [195] . Various models have been proposed to approximate percolation threshold for nanocomposites with various nano-fillers such as graphite, CNTs, and graphene. Many proposed models use fitting parameters where achieving actual values is difficult. As microstructure is a key factor in defining the properties of nanocomposites, it should be efficiently incorporated in proposed models to get closer to real-time values. Syurik et al. proposed a modification in McCullough’s model with current maps obtained by Conductive Atomic Force Microscopy (CA-AFM) [192] .
McCullough’s model is a structure-oriented model which assumes that the microstructure and orientation of reinforcement inside the matrix are variables and depend on the reinforcement content [191] . The increase in electrical conductivity can be attributed to the formation of chain-like network of reinforcement. The chain length depends on the size, shape, and volume fraction of reinforcement. Below percolation threshold, this chain-like network is sporadic and all chains are not connected together. Due to cessation of chain continuity, the conduction is obstructed and nanocomposites behave as insulator. By the time percolation threshold is achieved, all chains cling together and construct a continuous network which acts as a highway for electrons and nanocomposites start behaving as conductors. The chain fraction and its dimensions are statistical in nature. The distribution of chain length can be described by a probability density function η(νf, a), where a is the effective
aspect ratio and νf is the volume fraction of reinforcement. The average value of chain parameter  can be calculated using Equation (89) [192] ,
 (89)
(89)
where λ(a) is chain parameter and is dependent on reinforcement shape. When aspect ratio a of reinforcement exceeds 1, the chain parameter can be calculated using Equation (90) and Equation (91) [192] . The isotropic distribution of reinforcement in the matrix is given by Equation (92) and Equation (93) [192] ,
 (90)
(90)
where,
 (91)
(91)
 (92)
(92)
where,
 (93)
(93)
where σm, σf, and σ are electrical conductivities of matrix, reinforcement, and composite, respectively, and νf and νm are volume fractions of reinforcement and matrix, respectively. The experimental determination of η(νf, a) and  is quite difficult. Therefore, these factors were taken as fitting parameters. As actual microstructure is not considered, therefore it poses a limitation to McCullough’s model exhibiting a semi-empirical character. Syurik et al. used AFM to determine actual value of
  [192] . For ideal shapes of reinforcement such as spheres, disks and ropes, the chain parameter
  can be substituted as given in Equation (94) [192] ,
 (94)
(94)
where <à2> is mean-square value of conductive chains aspect ratio (a). With the help of AFM in CA-AFM model, the value of <à2> can be calculated as in Equation (95) [192] ,
 (95)
(95)
where n is the number of conductive chains, ℓi is length of ith chain, di is diameter of ith chain,  and
and 
are average length and average diameter of chain, respectively. Therefore, Equation (92) can be reduced to Equation (96), and density of composite can be calculated using rule of mixture as given in Equation (97) [192] ,
 (96)
(96)
 (97)
(97)
where ρ, ρf, ρm, are specific densities of composite, reinforcement, and matrix, respectively. During production of nanocomposites, porosity is inevitable due to, (1) air entrapment, (2) evaporation of volatiles, (3) any shrinkage during curing, and (4) the relative movement of reinforcement and polymer chains. The porosity influences the conductivity which can be considered using an apparent density (ρap) connected with specific density through the pore coefficient as given in Equation (98) [192] .
 (98)
(98)
When the nanocomposites are produced by a reproducible technology, such as latex technology, in which conductivity trends remain the same when samples are reproduced using the same parameters [196] . The Kρ can be taken as constant and needs to be measured only once. From Equation (98), Equation (97) can be written as Equation (99) where the coefficient Kρ depends on the method of composite production and on geometry of the reinforcement [192] . The value of ρap can be defined experimentally if the reinforcement fraction (w), sample’s volume (V) and mass (m) are known as given in Equation (100), and the volume fraction of reinforcement can be calculated using Equation (101) where volume fraction can be converted to weight fraction using Equation (102), and G can be calculated by combining Equation (103) and Equation (104) [192] . The Equation (103) and Equation (104) show the conductivity behavior with respect to reinforcement loading. The CA-AFM image of graphene nanoplatelets reinforced polystyrene (GNPs/PS) nanocomposites is shown in Figure 30(a) and corresponding image of the grains is shown in Figure 30(b) where 368 grains are shown with size distribution of the GNP clusters shown in Figure 30(c) [192] . The GNPs/PS nanocomposites were prepared by latex technology which allows the reproducible
 (99)
(99)
 (100)
(100)
 (101)
(101)
 (102)
(102)
 (103)
(103)

Figure 30. An overview of the process of cluster analyzing: (a) CA-AFM image of the GNPs/PS composite, the scan size in 5 × 5 µm; (b) the corresponding image of the grains; (c) the histogram presenting a size distribution of the GNPs clusters [192] .
 (104)
(104)
percolation threshold [196] . Most of the GNPs had a thickness of 2 - 3 atomic layers and average surface area 1 - 3 µm2. The weight fractions of GNPs were 0, 0.6, 0.9, 1.5, and 2.0 wt%. Electrical conductivity measurements in Direct Current (DC) mode were performed in a direction parallel to the sample top surface using a 2-probe configuration and a Keithley 2602 system source meter. Conductivity was calculated from the obtained I/V characteristics using Equation (105) [192] ,
 (105)
(105)
where V is applied voltage and I is current value through a cross-section (A) and between the distance (b). The values of  for all composites are in the range 0 < λ < 1 and lie in the restrictions of McCullough’s model
[191] . Figure 31 shows the variation in conductivity values measured using: (a) CA-AFM (curve 1), (b) 2-point DC method (curve 2), (c) McCullough’s model (curve 3), and (d) with varying GNP loading (curve 4) [192] .
The relationship between  and
and  is shown in Figure 32 [192] . The conductivities by CA-AFM and

Figure 31. The experimentally obtained dependencies of the conductivity of the GNPs/PS nanocomposite via GNP loading obtained via CA-AFM (curve 1) and macro conductivity measurements (curve 2) and a comparison with the McCullough’s model (curve 3) and the developed model (curve 4) [192] .

Figure 32. The dependence of the average chain parameter on the mean-square value of the aspect ratio [192] .
2-point DC measurements are in accord. The conductivity of polymer at low GNP loading is close to dielectric polymer matrix as no continuous pathways of GNPs are available for conduction. The percolation threshold of 0.9 wt% is suggested by DC measurements and is corroborated by Scanning Electron Microscopy (SEM) and CA-AFM. At the percolation threshold marked by DC measurements, the conductivity increases sharply by five orders of magnitude. This can be explained by the presence of microscopic conductive sub-networks of GNPs. However, these sub-networks do not create continuous network. Therefore, these sub-networks are not initially detected by DC measurements until a continuous network is established.
13. Overall Microstructure
With the help of optical and electron microscopy, the dispersed reinforcement and polymer matrix can be observed in qualitative and quantitative manners, respectively. However, in this binary system integrated at nanoscale, there are myriad of factors that expound the overall performance of produced nanocomposites. Some of those defining features are summed up in Figure 33. One constituent of the overall microstructure is particle size distribution. The mechanical properties are improved when load is efficiently transferred from matrix to reinforcement. One of the controlling factors for load transfer mechanism is networking of reinforcement. The load can only be transferred from the matrix to the reinforcement if a connected network of reinforcing particles is available. Any disjoint in the network will act as weakest link for load transfer and polymer matrix will be prone to external loading. One of the factors influencing network formation is filling ratio (or packing density). When particle size distribution is narrow, the voids between the particles would not be filled and those empty locations will be a preferred route for the cracks to surmount the reinforcement particles. On the other hand, when reinforcement has wide size distribution, the finer particles can occupy the empty spaces in between large particles. It increases the filling ratio and makes an efficiently connected network of reinforcement. Sohn and Moreland have shown that packing density is dependent on particle size distribution and shows a direct relationship, i.e. packing density increases as the particle size distribution is extended [197] . It was also found that packing density is independent of particle size. They further reported that particle shape also influences packing density. It is obvious as perfect cubes will have 100% packing while voids will be certain in spherical particles which will lower the packing density. Therefore, a wide size distribution is helpful in improving the mechanical properties as strong networking of reinforcing particle can take place because of high packing density.
The properties of nanocomposites are also significantly dependent on filler shape and size. The graphene size, shape, and topography can be controlled simultaneously as shown in Figure 34 [198] . Chen et al. synthesized well-aligned millimeter-sized tetragon-shaped and hexagon-shaped graphene on a polycrystalline copper substrate using low pressure CVD [198] . CVD is an efficient approach to produce high quality and large surface area graphene on metallic substrates [199] [200] . Graphene can be grown epitaxially on single crystal copper substrate [201] - [204] . Graphene shape and orientation strongly depend on crystallographic orientation of copper substrate [205] [206] . The dendritic graphene with multiple branches can be obtained by diffusion-limited growth dynamics [207] . The graphene shape can also be controlled using surface condition of substrate. For example, wet-loaded samples produce tetragonal shaped and dry-loaded samples produce hexagonal shaped graphene [198] . The graphene shape can also be controlled by processing temperature [208] [209] .
It is well established that dispersion state is a crucial factor in defining the properties of nanocomposites and is discussed in detail in Section 6. In addition, the orientation of reinforcement and polymer chains and degree of crosslinking significantly influence the mechanical, thermal, and electrical properties of GBPNCs [210] . Additionally, the porosity is another important influential factor and two kinds of porosity is commonly observed: round porosity which can be because of fluids and air entrapment as fluids exert equal pressure in all sides, and irregular porosity which can be because of reinforcement bridging and relative movement of reinforcement and matrix [211] . One of the factors that dictates the interfacial interactions is the interphase and the properties of GBPNCs are significantly influenced by interphase properties [212] . Another factor that is not an integral part of microstructure but can significantly influence the microstructure is thermal fluctuation [213] . Thermal fluctuations can cause phase transformation and influence topographical features of graphene. Similarly correlations among other variables need to be established. If we consider the variables shown in Figure 33, there may be 156 permutations of the correlations considering two variables at a time (13P2). Although various models have been presented to date regarding GBPNCs in which various aspects have been covered, however, it is just the beginning and myriad of factors are still to be incorporated in the modeling and simulation of GBPNCs.

Figure 33. Various aspects of microstructure.

Figure 34. SEM images of topographically controlled (a) tetragon-shaped graphene and (b) hexagonal graphene [198] .
14. Conclusions
Following conclusions can be drawn based on the critical review of the published literature related to modeling and simulation of GBPNCs:
Various theoretical and computational approaches have been employed to explore the influence of graphene as reinforcement on the performance of polymer nanocomposites including but not limited to, quantum mechanical-based methods [28] , continuum mechanics (CM) [29] , molecular mechanics (MM) [30] , molecular dynamics (MD) [31] , atomistic modeling [32] , density functional theory (DFT) [33] , and multiscale modeling [34] .
The individual layers of graphene, under external loadings and thermal stresses, undergo out-of-plane wrapping [80] [81] , rippling [82] [83] , folding [84] [85] , scrolling [86] [87] , and crumpling [74] [88] , making graphene suitable to enhance the toughness of polymers.
Buckling of graphene layers and interfacial delamination are most commonly observed failure modes in GBPNCs [124] . To avoid such failures, minimum length scale and adhesion energy are necessary to avoid delamination under compressive forces [124] .
MD simulation showed that thermal fluctuations produce ripples on graphene surface which influence the mechanical properties of graphene [99] [100] . Spring-based finite element models showed that graphene sheets can slide over each other which can degrade their reinforcing character [214] .
With the help of optical and electron microscopy, the dispersed reinforcement and polymer matrix can be observed in qualitative and quantitative manners, respectively. However, in this binary system integrated at nanoscale, there are a myriad of factors that expound the overall performance of produced nanocomposites.
If we consider the variables shown in Figure 33, there may be 156 permutations of the correlations considering two variables at a time (13P2). Although various models have been presented to date regarding GBPNCs in which various aspects have been covered, however, it is just the beginning and myriad of factors which are still to be incorporated in the modeling and simulation of GBPNCs.
Acknowledgements
The authors would like to thank the Department of Mechanical and Construction Engineering, Northumbria University, UK for the provision of research facilities, without which the analysis of relevant data was not possible.
Cite this paper
Rasheed Atif,Fawad Inam, (2016) Modeling and Simulation of Graphene Based Polymer Nanocomposites: Advances in the Last Decade. Graphene,05,96-142. doi: 10.4236/graphene.2016.52011
References
- 1. Donaldson, S.L. and Miracle, D.B. (2001) ASM Handbook Vol. 21, Composites. ASM International, Novelty.
- 2. Yao, X.F., Zhou, D. and Yeh, H.Y. (2008) Macro/Microscopic Fracture Characterizations of SiO2/Epoxy Nanocomposites. Aerospace Science and Technology, 12, 223-230. http://dx.doi.org/10.1016/j.ast.2007.03.005
- 3. Wetzel, B., Rosso, P., Haupert, F. and Friedrich, K. (2006) Epoxy Nanocomposites—Fracture and Toughening Mechanisms. Engineering Fracture Mechanics, 73, 2375-2398. http://dx.doi.org/10.1016/j.engfracmech.2006.05.018
- 4. Naous, W., Yu, X.Y., Zhang, Q.X., Naito, K. and Kagawa, Y. (2006) Morphology, Tensile Properties, and Fracture Toughness of Epoxy/Al2O3 Nanocomposites. Journal of Polymer Science Part B: Polymer Physics, 44, 1466-1473. http://dx.doi.org/10.1002/polb.20800
- 5. Kim, B.C., Park, S.W. and Lee, D.G. (2008) Fracture Toughness of the Nano-Particle Reinforced Epoxy Composite. Composite Structures, 86, 69-77. http://dx.doi.org/10.1016/j.compstruct.2008.03.005
- 6. Wang, K., Chen, L., Wu, J., Toh, M.L., He, C. and Yee, A.F. (2005) Epoxy Nanocomposites with Highly Exfoliated Clay: Mechanical Properties and Fracture Mechanisms. Macromolecules, 38, 788-800. http://dx.doi.org/10.1021/ma048465n
- 7. Liu, W., Hoa, S.V. and Pugh, M. (2005) Fracture Toughness and Water Uptake of High-Performance Epoxy/Nanoclay Nanocomposites. Composites Science and Technology, 65, 2364-2373. http://dx.doi.org/10.1016/j.compscitech.2005.06.007
- 8. Srikanth, I., Kumar, S., Kumar, A., Ghosal, P. and Subrahmanyam, C. (2012) Effect of Amino Functionalized MWCNT on the Crosslink Density, Fracture Toughness of Epoxy and Mechanical Properties of Carbon-Epoxy Composites. Composites Part A: Applied Science and Manufacturing, 43, 2083-2086. http://dx.doi.org/10.1016/j.compositesa.2012.07.005
- 9. Inam, F. (2012) Carbon Nanotubes for Epoxy Nanocomposites: A Review on Recent Developments. 2nd International Conference on Advanced Composite Materials and Technologies for Aerospace Applications, Wrexham, 11-13 June 2012, 11-13.
- 10. Inam, F., Wong, D.W.Y., Kuwata, M. and Peijs, T. (2010) Multiscale Hybrid Micro-Nanocomposites Based on Carbon Nanotubes and Carbon Fibers. Journal of Nanomaterials, 2010, 1-12. http://dx.doi.org/10.1155/2010/453420
- 11. Mathews, M.J. and Swanson, S.R. (2007) Characterization of the Interlaminar Fracture Toughness of a Laminated Carbon/Epoxy Composite. Composites Science and Technology, 67, 1489-1498. http://dx.doi.org/10.1016/j.compscitech.2006.07.035
- 12. Arai, M., Noro, Y., Sugimoto, K. and Endo, M. (2008) Mode I and Mode II Interlaminar Fracture Toughness of CFRP Laminates Toughened by carbon Nanofiber Interlayer. Composites Science and Technology, 68, 516-525. http://dx.doi.org/10.1016/j.compscitech.2007.06.007
- 13. Wong, D.W.Y., Lin, L., McGrail, P.T., Peijs, T. and Hogg, P.J. (2010) Improved Fracture Toughness of Carbon Fibre/Epoxy Composite Laminates Using Dissolvable Thermoplastic Fibres. Composites Part A: Applied Science and Manufacturing, 41, 759-767. http://dx.doi.org/10.1016/j.compositesa.2010.02.008
- 14. Nu?o, M., Pesce, G.L., Bowen, C.R., Xenophontos, P. and Ball, R.J. (2015) Environmental Performance of Nano- Structured Ca(OH)2/TiO2 Photocatalytic Coatings For Buildings. Building and Environment, 92, 734-742. http://dx.doi.org/10.1016/j.buildenv.2015.05.028�
- 15. Haapanen, J., Aromaa, M., Teisala, H., Tuominen, M., Stepien, M., Saarinen, J.J., et al. (2015) Binary TiO2/SiO2 Nanoparticle Coating for Controlling the Wetting Properties of Paperboard. Materials Chemistry and Physics, 149-150, 230-237. http://dx.doi.org/10.1016/j.matchemphys.2014.10.011
- 16. Novoselov, K.S., Geim, A.K., Morozov, S.V., Jiang, D., Zhang, Y., Dubonos, S.V., et al. (2004) Electric Field Effect in Atomically Thin Carbon Films. Science, 306, 666-669. http://dx.doi.org/10.1126/science.1102896
- 17. Stankovich, S., Dikin, D.A., Dommett, G.H.B., Kohlhaas, K.M., Zimney, E.J., Stach, E.A., et al. (2006) Graphene- Based Composite Materials. Nature, 442, 282-286. http://dx.doi.org/10.1038/nature04969
- 18. Pokharel, P., Truong, Q.-T. and Lee, D.S. (2014) Multi-Step Microwave Reduction of Graphite Oxide and Its Use in the Formation of Electrically Conductive Graphene/Epoxy Composites. Composites Part B: Engineering, 64, 187-193. http://dx.doi.org/10.1016/j.compositesb.2014.04.013
- 19. Tian, M., Qu, L., Zhang, X., Zhang, K., Zhu, S., Guo, X., et al. (2014) Enhanced Mechanical and Thermal Properties of Regenerated Cellulose/Graphene Composite Fibers. Carbohydrate Polymers, 111, 456-462. http://dx.doi.org/10.1016/j.carbpol.2014.05.016
- 20. Xu, Z., Zhang, J., Shan, M., Li, Y., Li, B., Niu, J., et al. (2014) Organosilane-Functionalized Graphene Oxide for Enhanced Antifouling and Mechanical Properties of Polyvinylidene Fluoride Ultrafiltration Membranes. Journal of Membrane Science, 458, 1-13. http://dx.doi.org/10.1016/j.memsci.2014.01.050
- 21. Bkakri, R., Sayari, A., Shalaan, E., Wageh, S., Al-Ghamdi, A.A. and Bouazizi, A. (2014) Effects of the Graphene Doping Level on the Optical and Electrical Properties of ITO/P3HT: Graphene/Au Organic Solar Cells. Superlattices and Microstructures, 76, 461-471. http://dx.doi.org/10.1016/j.spmi.2014.10.016
- 22. Lian, Y., He, F., Wang, H. and Tong, F. (2014) A New Aptamer/Graphene Interdigitated Gold Electrode Piezoelectric Sensor for Rapid and Specific Detection of Staphylococcus aureus. Biosensors & Bioelectronics, 65C, 314-319.
- 23. Abdin, Z., Alim, M.A., Saidur, R., Islam, M.R., Rashmi, W., Mekhilef, S., et al. (2013) Solar Energy Harvesting with the Application of Nanotechnology. Renewable & Sustainable Energy Reviews, 26, 837-852. http://dx.doi.org/10.1016/j.rser.2013.06.023
- 24. Sun, W., Hu, R., Liu, H., Zeng, M., Yang, L., Wang, H., et al. (2014) Embedding Nano-Silicon in Graphene Nanosheets by Plasma Assisted Milling for High Capacity Anode Materials in Lithium Ion Batteries. Journal of Power Sources, 268, 610-618. http://dx.doi.org/10.1016/j.jpowsour.2014.06.039
- 25. Azeez, A.A., Rhee, K.Y., Park, S.J. and Hui, D. (2013) Epoxy Clay Nanocomposites—Processing, Properties and Applications: A Review. Composites Part B: Engineering, 45, 308-320. http://dx.doi.org/10.1016/j.compositesb.2012.04.012
- 26. Aziz, A., Lim, H.N., Girei, S.H., Yaacob, M.H., Mahdi, M.A., Huang, N.M., et al. (2015) Silver/Graphene Nanocomposite-Modified Optical Fiber Sensor Platform for Ethanol Detection in Water Medium. Sensors and Actuators B: Chemical, 206, 119-125. http://dx.doi.org/10.1016/j.snb.2014.09.035
- 27. Agnihotri, N., Chowdhury, A.D. and De, A. (2015) Non-Enzymatic Electrochemical Detection of Cholesterol Using β-Cyclodextrin Functionalized Graphene. Biosensors and Bioelectronics, 63, 212-217. http://dx.doi.org/10.1016/j.bios.2014.07.037
- 28. Yanovsky, Y.G., Nikitina, E.A., Karnet, Y.N. and Nikitin, S.M. (2009) Quantum Mechanics Study of the Mechanism of Deformation and Fracture of Graphene. Physical Mesomechanics, 12, 254-262. http://dx.doi.org/10.1016/j.physme.2009.12.007
- 29. Lu, Q., Gao, W. and Huang, R. (2011) Atomistic Simulation and Continuum Modeling of Graphene Nanoribbons under Uniaxial Tension. Modelling and Simulation in Materials Science and Engineering, 19, Article ID: 054006. http://dx.doi.org/10.1088/0965-0393/19/5/054006
- 30. Theodosiou, T.C. and Saravanos, D.A. (2014) Numerical Simulation of Graphene Fracture Using Molecular Mechanics Based Nonlinear Finite Elements. Computational Materials Science, 82, 56-65. http://dx.doi.org/10.1016/j.commatsci.2013.09.032
- 31. Ni, Z., Bu, H., Zou, M., Yi, H., Bi, K. and Chen, Y. (2010) Anisotropic Mechanical Properties of Graphene Sheets from Molecular Dynamics. Physica B: Condensed Matter, 405, 1301-1306. http://dx.doi.org/10.1016/j.physb.2009.11.071
- 32. Liu, Y. and Xu, Z. (2014) Multimodal and Self-Healable Interfaces Enable Strong and Tough Graphene-Derived Materials. Journal of the Mechanics and Physics of Solids, 70, 30-41. http://dx.doi.org/10.1016/j.jmps.2014.05.006
- 33. Liu, F., Ming, P. and Li, J. (2007) Ab Initio Calculation of Ideal Strength and Phonon Instability of Graphene under Tension. Physical Review B, Condensed Matter, 76, 1-7.
- 34. Mortazavi, B. and Rabczuk, T. (2015) Multiscale Modeling of Heat Conduction in Graphene Laminates. Carbon, 85, 1-7. http://dx.doi.org/10.1016/j.carbon.2014.12.046
- 35. Cao, G. (2014) Atomistic Studies of Mechanical Properties of Graphene. Polymers (Basel), 6, 2404-2032. http://dx.doi.org/10.3390/polym6092404
- 36. Allegra, G., Raos, G. and Vacatello, M. (2008) Theories and Simulations of Polymer-Based Nanocomposites: From Chain Statistics to Reinforcement. Progress in Polymer Science, 33, 683-731. http://dx.doi.org/10.1016/j.progpolymsci.2008.02.003
- 37. Cho, J., Luo, J.J. and Daniel, I.M. (2007) Mechanical Characterization of Graphite/Epoxy Nanocomposites by Multi- Scale Analysis. Composites Science and Technology, 67, 2399-2407. http://dx.doi.org/10.1016/j.compscitech.2007.01.006
- 38. Yarovsky, I. (2002) Computer Simulation of Structure and Properties of Crosslinked Polymers: Application to Epoxy Resins. Polymer (Guildf), 43, 963-969. http://dx.doi.org/10.1016/S0032-3861(01)00634-6
- 39. Awasthi, A.P., Lagoudas, D.C. and Hammerand, D.C. (2008) Modeling of Graphene-Polymer Interfacial Mechanical Behavior Using Molecular Dynamics. Modelling and Simulation in Materials Science and Engineering, 17, Article ID: 015002. http://dx.doi.org/10.1088/0965-0393/17/1/015002
- 40. Wongbong, C. and Jo-Won, L. (2012) Graphene Synthesis and Applications. CRC Press, Boca Raton.
- 41. Chan, Y. and Hill, J.M. (2010) Some Novel Plane Trajectories for Carbon Atoms and Fullerenes Captured by Two Fixed Parallel Carbon Nanotubes. European Physical Journal D, 59, 367-374. http://dx.doi.org/10.1140/epjd/e2010-00173-9
- 42. Sun, H. (1998) COMPASS: An Ab Initio Force-Field Optimized for Condensed-Phase Applications s Overview with Details on Alkane and Benzene Compounds. The Journal of Physical Chemistry, 5647, 7338-7364. http://dx.doi.org/10.1021/jp980939v
- 43. Rahman, R. (2013) The Role of Graphene in Enhancing the Stiffness of Polymeric Material: A Molecular Modeling Approach. Journal of Applied Physics, 113, Article ID: 243503. http://dx.doi.org/10.1063/1.4812275
- 44. Rafiee, M.A., Rafiee, J., Wang, Z., Song, H., Yu, Z. and Koratkar, N. (2009) Enhanced Mechanical Properties of Nanocomposites at Low Graphene Content. ACS Nano, 3, 3884-3890. http://dx.doi.org/10.1021/nn9010472
- 45. Ebrahimi, S., Ghafoori-Tabrizi, K. and Rafii-Tabar, H. (2012) Multi-Scale Computational Modelling of the Mechanical Behaviour of the Chitosan Biological Polymer Embedded with Graphene and Carbon Nanotube. Computational Materials Science, 53, 347-353. http://dx.doi.org/10.1016/j.commatsci.2011.08.034
- 46. Hoover, W.G. (1985) Canonical Dynamics: Equilibrium Phase-Space Distributions. Physical Review A, 31, 1695-1697. http://dx.doi.org/10.1103/PhysRevA.31.1695
- 47. Hoover, W.G. (1986) Constant-Pressure Equations of Motion. Physical Review A, 34, 2499-2500. http://dx.doi.org/10.1103/PhysRevA.34.2499
- 48. Wang, X. and Guo, X. (2013) Quasi-Continuum Model for the Finite Deformation of Single-Layer Graphene Sheets Based on the Temperature-Related Higher Order Cauchy-Born Rule. Journal of Computational and Theoretical Nanoscience, 10, 154-164. http://dx.doi.org/10.1166/jctn.2013.2672
- 49. Chandrupatra, T.R. and Belegundu, A.D. (2002) Introduction to Finite Elements in Engineering. 3rd Edition, Prentice-Hall, Upper Saddle River.
- 50. Zhang, P., Huang, Y., Geubelle, P.H., Klein, P.A. and Hwang, K.C. (2002) The Elastic Modulus of Single-Wall Carbon Nanotubes: A Continuum Analysis Incorporating Interatomic Potentials. International Journal of Solids and Structures, 39, 3893-3906. http://dx.doi.org/10.1016/S0020-7683(02)00186-5
- 51. Bianchini, F., Patera, L.L., Peressi, M., Africh, C. and Comelli, G. (2014) Atomic Scale Identification of Coexisting Graphene Structures on Ni(111). The Journal of Physical Chemistry Letters, 5, 467-473. http://dx.doi.org/10.1021/jz402609d
- 52. Amara, H., Latil, S., Meunier, V., Lambin, P. and Charlier, J.C. (2007) Scanning Tunneling Microscopy Fingerprints of Point Defects in Graphene: A Theoretical Prediction. Physical Review B: Condensed Matter and Materials Physics, 76, 1-10. http://dx.doi.org/10.1103/PhysRevB.76.115423
- 53. Meyer, J.C., Kurasch, S., Park, H.J., Skakalova, V., Künzel, D., Gross, A., et al. (2011) Experimental Analysis of Charge Redistribution Due to Chemical Bonding by High-Resolution Transmission Electron Microscopy. Nature Materials, 10, 209-215. http://dx.doi.org/10.1038/nmat2941
- 54. Skowron, S.T., Lebedeva, I.V., Popov, A.M. and Bichoutskaia, E. (2015) Energetics of Atomic Scale Structure Changes in Graphene. Chemical Society Reviews, 44, 3143-3176. http://dx.doi.org/10.1039/C4CS00499J
- 55. Rutter, G.M., Crain, J.N., Guisinger, N.P., Li, T., First, P.N. and Stroscio, J.A. (2007) Scattering and Interference in Epitaxial Graphene. Science, 317, 219-222. http://dx.doi.org/10.1126/science.1142882
- 56. Ruffieux, P., Melle-Franco, M., Groning, O., Bielmann, M., Zerbetto, F. and Groning, P. (2005) Charge-Density Oscillation on Graphite Induced by the Interference of Electron Waves. Physical Review B, 71, Article ID: 153403. http://dx.doi.org/10.1103/PhysRevB.71.153403
- 57. Osvath, Z., Vertesy, G., Tapaszto, L., Weber, F., Horvath, Z.E., Gyulai, J., et al. (2005) Atomically Resolved STM Images of Carbon Nanotube Defects Produced by Ar + Irradiation. Physical Review B, 72, Article ID: 045429. http://dx.doi.org/10.1103/PhysRevB.72.045429
- 58. Chen, J.-H., Cullen, W.G., Williams, E.D. and Fuhrer, M.S. (2010) Tunable Kondo Effect in Graphene with Defects. Nature Physics, 7, 22.
- 59. Gómez-Navarro, C., Meyer, J.C., Sundaram, R.S., Chuvilin, A., Kurasch, S., Burghard, M., et al. (2010) Atomic Structure of Reduced Graphene Oxide. Nano Letters, 10, 1144-1148. http://dx.doi.org/10.1021/nl9031617
- 60. Yan, H., Liu, C.C., Bai, K.K., Wang, X., Liu, M., Yan, W., et al. (2013) Electronic Structures of Graphene Layers on a Metal Foil: The Effect of Atomic-Scale Defects. Applied Physics Letters, 103, Article ID: 143120. http://dx.doi.org/10.1063/1.4824206
- 61. Yan, H., Sun, Y., He, L., Nie, J.C. and Chan, M.H.W. (2012) Observation of Landau-Level-Like Quantization at 77 K along a Strained-Induced Graphene Ridge. Physical Review B: Condensed Matter and Materials Physics, 85, Article ID: 035422. http://dx.doi.org/10.1103/PhysRevB.85.035422
- 62. Yan, H., Chu, Z.D., Yan, W., Liu, M., Meng, L., Yang, M., et al. (2013) Superlattice Dirac Points and Space-Depen- dent Fermi Velocity in a Corrugated Graphene Monolayer. Physical Review B: Condensed Matter and Materials Physics, 87, 075405. http://dx.doi.org/10.1103/PhysRevB.87.075405
- 63. Cerda, E. and Mahadevan, L. (2003) Geometry and Physics of Wrinkling. Physical Review Letters, 90, Article ID: 074302. http://dx.doi.org/10.1103/PhysRevLett.90.074302
- 64. Matan, K., Williams, R.B., Witten, T.A. and Nagel, S.R. (2002) Crumpling a Thin Sheet. Physical Review Letters, 88, Article ID: 076101. http://dx.doi.org/10.1103/PhysRevLett.88.076101
- 65. Balankin, A.S. and Orlando, S.H. (2008) Entropic Rigidity of a Crumpling Network in a Randomly Folded Thin Sheet. Physical Review E, 77, Article ID: 051124. http://dx.doi.org/10.1103/PhysRevE.77.051124
- 66. Qin, Z. and Buehler, M. (2012) Bioinspired Design of Functionalised Graphene. Molecular Simulation, 38, 695-703. http://dx.doi.org/10.1080/08927022.2012.685943
- 67. Wang, M.X., Liu, Q., Sun, H.F., Stach, E.A., Zhang, H., Stanciu, L., et al. (2012) Preparation of High-Surface-Area Carbon Nanoparticle/Graphene Composites. Carbon, 50, 3845-3853. http://dx.doi.org/10.1016/j.carbon.2012.04.026
- 68. Jabari Seresht, R., Jahanshahi, M., Rashidi, A. and Ghoreyshi, A.A. (2013) Synthesize and Characterization of Graphene Nanosheets with High Surface Area and Nano-Porous Structure. Applied Surface Science, 276, 672-681. http://dx.doi.org/10.1016/j.apsusc.2013.03.152
- 69. Patel, M.U.M., Luong, N.D., Sepp?l?, J., Tchernychova, E. and Dominko, R. (2014) Low Surface Area Graphene/ Cellulose Composite as a Host Matrix for Lithium Sulphur Batteries. Journal of Power Sources, 254, 55-61. http://dx.doi.org/10.1016/j.jpowsour.2013.12.081�
- 70. Zhang, K., Duan, X., Zhu, X., Hu, D., Xu, J., Lu, L., et al. (2014) Nanostructured Graphene Oxide-MWCNTs Incorporated Poly(3,4-ethylenedioxythiophene) with a High Surface Area for Sensitive Determination of Diethylstilbestrol. Synthetic Metals, 195, 36-43. http://dx.doi.org/10.1016/j.synthmet.2014.05.005
- 71. Cranford, S.W. and Buehler, M.J. (2011) Packing Efficiency and Accessible Surface Area of Crumpled Graphene. Physical Review B: Condensed Matter and Materials Physics, 84, Article ID: 205451. http://dx.doi.org/10.1103/PhysRevB.84.205451
- 72. Faber, K.T. and Evans, A.G. (1983) Crack Deflection Processes—I. Theory. Acta Metallurgica, 31, 565-576. http://dx.doi.org/10.1016/0001-6160(83)90046-9
- 73. Faber, K.T. and Evans, A.G. (1983) Crack Deflection Processes—II. Experiment. Acta Metallurgica, 31, 577-584. http://dx.doi.org/10.1016/0001-6160(83)90047-0
- 74. Becton, M., Zhang, L. and Wang, X. (2015) On the Crumpling of Polycrystalline Graphene by Molecular Dynamics Simulation. Physical Chemistry Chemical Physics, 17, 6297-6304. http://dx.doi.org/10.1039/C4CP05813E
- 75. Palmeri, M.J., Putz, K.W. and Brinson, L.C. (2010) Sacrificial Bonds in Stacked-Cup Carbon Nanofibers: Biomimetic Toughening Mechanisms for Composite Systems. ACS Nano, 4, 4256-4264. http://dx.doi.org/10.1021/nn100661a
- 76. Cranford, S. and Buehler, M.J. (2011) Twisted and Coiled Ultralong Multilayer Graphene Ribbons. Modelling and Simulation in Materials Science and Engineering, 19, Article ID: 054003. http://dx.doi.org/10.1088/0965-0393/19/5/054003
- 77. Lee, D., Zou, X.. Zhu, X., Seo, J.W., Cole, J.M., Bondino, F., et al. (2012) Ultrafast Carrier Phonon Dynamics in NaOH-Reacted Graphite Oxide Film. Applied Physics Letters, 101, Article ID: 021604. http://dx.doi.org/10.1063/1.4736572
- 78. Becton, M., Zhang, L. and Wang, X. (2013) Effects of Surface Dopants on Graphene Folding by Molecular Simulations. Chemical Physics Letters, 584, 135-141. http://dx.doi.org/10.1016/j.cplett.2013.08.027
- 79. Wang, W.N., Jiang, Y. and Biswas, P. (2012) Evaporation-Induced Crumpling of Graphene Oxide Nanosheets in Aerosolized Droplets: Confinement Force Relationship. The Journal of Physical Chemistry Letters, 3, 3228-3233. http://dx.doi.org/10.1021/jz3015869
- 80. Zhao, J., Yang, B., Zheng, Z., Yang, J., Yang, Z., Zhang, P., et al. (2014) Facile Preparation of One-Dimensional Wrapping Structure: Graphene Nanoscroll-Wrapped of Fe3O4 Nanoparticles and Its Application for Lithium-Ion Battery. ACS Applied Materials & Interfaces, 6, 9890-9896. http://dx.doi.org/10.1021/am502574j
- 81. Liu, J., Wang, Z., Liu, L. and Chen, W. (2011) Reduced Graphene Oxide as Capturer of Dyes and Electrons during Photocatalysis: Surface Wrapping and Capture Promoted Efficiency. Physical Chemistry Chemical Physics, 13, 13216- 13221. http://dx.doi.org/10.1039/c1cp20504h
- 82. Fasoline, A., Los, J.H. and Katsnelson, M.I. (2007) Intrinsic Ripples in Graphene. Nature Materials, 6, 858-861. http://dx.doi.org/10.1038/nmat2011
- 83. Bao, W., Miao, F., Chen, Z., Zhang, H., Jang, W., Dames, C., et al. (2009) Controlled Ripple Texturing of Suspended Graphene and Ultrathin Graphite Membranes. Nature Nanotechnology, 4, 562-566. http://dx.doi.org/10.1038/nnano.2009.191
- 84. Kim, K., Lee, Z., Malone, B.D., Chan, K.T., Alemán, B., Regan, W., et al. (2011) Multiply Folded Graphene. Physical Review B: Condensed Matter and Materials Physics, 83, 1-8. http://dx.doi.org/10.1103/PhysRevB.83.245433
- 85. Cranford, S., Sen, D. and Buehler, M.J. (2009) Meso-Origami: Folding Multilayer Graphene Sheets. Applied Physics Letters, 95, 2013-2016. http://dx.doi.org/10.1063/1.3223783
- 86. Meyer, J.C., Geim, A.K., Katsnelson, M.I., Novoselov, K.S., Booth, T.J. and Roth, S. (2007) The Structure of Suspended Graphene Sheets. Nature, 446, 60-63. http://dx.doi.org/10.1038/nature05545
- 87. Viculis, L.M., Mack, J.J. and Kaner, R.B. (2003) A Chemical Route to Carbon Nanoscrolls. Science, 299, 1361. http://dx.doi.org/10.1126/science.1078842
- 88. Ma, X., Zachariah, M.R. and Zangmeister, C.D. (2013) Reduction of Suspended Graphene Oxide Single Sheet Nanopaper: The Effect of Crumpling. The Journal of Physical Chemistry C, 117, 3185-3191. http://dx.doi.org/10.1021/jp400237m
- 89. Parviz, D., Metzler, S.D., Das, S., Irin, F. and Green, M.J. (2015) Tailored Crumpling and Unfolding of Spray-Dried Pristine Graphene and Graphene Oxide Sheets. Small, 11, 2661-2668. http://dx.doi.org/10.1002/smll.201403466
- 90. Wang, X., Jin, J. and Song, M. (2013) An Investigation of the Mechanism of Graphene Toughening Epoxy. Carbon, 65, 324-333. http://dx.doi.org/10.1016/j.carbon.2013.08.032
- 91. Perim, E., Machado, L.D. and Galvao, D.S. (2015) A Brief Review on Syntheses, Structures and Applications of Nanoscrolls. Frontiers in Materials, 2015, 1-17.
- 92. Abreu, E.M.C., De Andrade, M.A., De Assis, L.P.G., Helay?l-Neto, J.A., Nogueira, A.LM.A. and Paschoal, R.C. (2011) A Supersymmetric Model for Graphene. Journal of High Energy Physics, 2011, 1-12. http://dx.doi.org/10.1007/JHEP05(2011)001�
- 93. Mortazavi, B., Benzerara, O., Meyer, H., Bardon, J. and Ahzi, S. (2013) Combined Molecular Dynamics-Finite Element Multiscale Modeling of Thermal Conduction in Graphene Epoxy Nanocomposites. Carbon, 60, 356-365. http://dx.doi.org/10.1016/j.carbon.2013.04.048
- 94. Parashar, A. and Mertiny, P. (2013) Multiscale Model to Study of Fracture Toughening in Graphene/Polymer Nanocomposite. International Journal of Fracture, 179, 221-228. http://dx.doi.org/10.1007/s10704-012-9779-y
- 95. Parashar, A. and Mertiny, P. (2012) Multiscale Model to Investigate the Effect of Graphene on the Fracture Characteristics of Graphene/Polymer Nanocomposites. Nanoscale Research Letters, 7, 595. http://dx.doi.org/10.1186/1556-276X-7-595
- 96. Chandrasekaran, S., Sato, N., T?lle, F., Mülhaupt, R., Fiedler, B. and Schulte, K. (2014) Fracture Toughness and Failure Mechanism of Graphene Based Epoxy Composites. Composites Science and Technology, 97, 90-99. http://dx.doi.org/10.1016/j.compscitech.2014.03.014�
- 97. Abedpour, N., Neek-Amal, M., Asgari, R., Shahbazi, F., Nafari, N. and Tabar, M.R.R. (2007) Roughness of Undoped Graphene and Its Short-Range Induced Gauge Field. Physical Review B: Condensed Matter and Materials Physics, 76, 1-15. http://dx.doi.org/10.1103/PhysRevB.76.195407
- 98. Fasolino, A., Los, J.H. and Katsnelson, M.I. (2007) Intrinsic Ripples in Graphene. Nature Materials, 6, 858-861. http://dx.doi.org/10.1038/nmat2011
- 99. Liu, P. and Zhang, Y.W. (2009) Temperature-Dependent Bending Rigidity of Graphene. Applied Physics Letters, 94, 30-33. http://dx.doi.org/10.1063/1.3155197
- 100. Montazeri, A. and Rafii-Tabar, H. (2011) Multiscale Modeling of Graphene- and Nanotube-Based Reinforced Polymer Nanocomposites. Physics Letters A, 375, 4034-4040. http://dx.doi.org/10.1016/j.physleta.2011.08.073
- 101. Neek-Amal, M. and Peeters, F.M. (2010) Defected Graphene Nanoribbons under Axial Compression. Applied Physics Letters, 97, 1-4. http://dx.doi.org/10.1063/1.3496467
- 102. Neek-Amal, M. and Peeters, F.M. (2012) Strain-Engineered Graphene through a Nanostructured Substrate. I. Deformations. Physical Review B: Condensed Matter and Materials Physics, 85, 1-12.
- 103. Brenner, D.W., Shenderova, O.A., Harrison, J.A., Stuart, S.J., Ni, B. and Sinnott, S.B. (2002) A Second-Generation Reactive Empirical Bond Order (REBO) Potential Energy Expression for Hydrocarbons. Journal of Physics: Condensed Matter, 14, 783-802. http://dx.doi.org/10.1088/0953-8984/14/4/312
- 104. Hoover, W.G. (1985) Canonical Dynamics: Equilibrium Phase-Space Distributions. Physical Review A, 31, 1695-1697. http://dx.doi.org/10.1103/PhysRevA.31.1695
- 105. Lee, C., Wei, X., Kysar, J.W. and Hone, J. (2008) Measurement of the Elastic Properties and Intrinsic Strength of Monolayer Graphene. Science, 321, 385-388. http://dx.doi.org/10.1126/science.1157996
- 106. Hu, N., Fukunaga, H., Lu, C., Kameyama, M. and Yan, B. (2005) Prediction of Elastic Properties of Carbon Nanotube Reinforced Composites. Royal Society A: Mathematical, Physical and Engineering Science, 461, 1685-1710. http://dx.doi.org/10.1098/rspa.2004.1422
- 107. Xu, P., Loomis, J., King, B. and Panchapakesan, B. (2012) Synergy among Binary (MWNT, SLG) Nano-Carbons in Polymer Nano-Composites: A Raman Study. Nanotechnology, 23, 315706. http://dx.doi.org/10.1088/0957-4484/23/31/315706
- 108. Cheng, Y.C., Kaloni, T.P., Zhu, Z.Y. and Schwingenschl?gl, U. (2012) Oxidation of Graphene in Ozone under Ultraviolet Light. Applied Physics Letters, 101, Article ID: 073110. http://dx.doi.org/10.1063/1.4746261
- 109. Gracia-espino, E., Hu, G., Shchukarev, A. and Wa, T. (2014) Understanding the Interface of Six-Shell Cuboctahedral and Icosahedral Palladium Clusters on Reduced Graphene Oxide: Experimental and Theoretical Study. Journal of the American Chemical Society, 136, 6626-6633. http://dx.doi.org/10.1021/ja412259h
- 110. Velizhanin, K.A., Dandu, N. and Solenov, D. (2014) Electromigration of Bivalent Functional Groups on Graphene. Physical Review B, 89, Article ID: 155414. http://dx.doi.org/10.1103/PhysRevB.89.155414
- 111. Radovic, L.R., Suarez, A., Vallejos-Burgos, F. and Sofo, J.O. (2011) Oxygen Migration on the Graphene Surface. 2. Thermochemistry of Basal-Plane Diffusion (Hopping). Carbon, 49, 4226-4238. http://dx.doi.org/10.1016/j.carbon.2011.05.037
- 112. Das, B., Eswar Prasad, K., Ramamurty, U. and Rao, C.N.R. (2009) Nano-Indentation Studies on Polymer Matrix Composites Reinforced by Few-Layer Graphene. Nanotechnology, 20, 125705. http://dx.doi.org/10.1088/0957-4484/20/12/125705
- 113. Reidenbach, F. (1994) ASM Handbook, Vol. 5. Surface Engineering. ASM International, Novelty.
- 114. Karger-Kocsis, J., Mahmood, H. and Pegoretti, A. (2015) Recent Advances in Fiber/Matrix Interphase Engineering for Polymer Composites. Progress in Materials Science, 73, 1-43. http://dx.doi.org/10.1016/j.pmatsci.2015.02.003
- 115. Moon, S.I. and Jang, J. (1999) Mechanical Interlocking and Wetting at the Interface between Argon Plasma Treated UHMPE Fiber and Vinylester Resin. Journal of Materials Science, 34, 4219-4224. http://dx.doi.org/10.1023/A:1004642500738
- 116. Nardin, M. and Ward, I.M. (1987) Influence of Surface Treatment on Adhesion of Polyethylene Fibres. Materials Science and Technology, 3, 814-826. http://dx.doi.org/10.1179/mst.1987.3.10.814
- 117. Ladizesky, N.H. and Ward, I.M. (1989) The Adhesion Behaviour of High Modulus Polyethylene Fibres Following Plasma and Chemical Treatment. Journal of Materials Science, 24, 3763-3773. http://dx.doi.org/10.1007/BF02385768
- 118. Woods, D.W. and Ward, I.M. (1993) Study of the Oxygen Treatment of High-Modulus Polyethylene Fibres. Surface and Interface Analysis, 20, 385-392. http://dx.doi.org/10.1002/sia.740200510
- 119. Tissington, B., Pollard, G. and Ward, I.M. (1991) A Study of the Influence of Fibre/Resin Adhesion on the Mechanical Behaviour of Ultra-High-Modulus Polyethylene Fibre Composites. Journal of Materials Science, 26, 82-92. http://dx.doi.org/10.1007/BF00576036
- 120. Li, C. and Chou, T.W. (2006) Multiscale Modeling of Compressive Behavior of Carbon Nanotube/Polymer Composites. Composites Science and Technology, 66, 2409-2414. http://dx.doi.org/10.1016/j.compscitech.2006.01.013
- 121. Montazeri, A. and Naghdabadi, R. (2009) Investigating the Effect of Carbon Nanotube Defects on the Column and Shell Buckling of Carbon Nanotube-Polymer Composites Using Multiscale Modeling. International Journal for Multiscale Computational Engineering, 7, 431-444. http://dx.doi.org/10.1615/IntJMultCompEng.v7.i5.50
- 122. Parashar, A. and Mertiny, P. (2012) Representative Volume Element to Estimate Buckling Behavior of Graphene/Po- lymer Nanocomposite. Nanoscale Research Letters, 7, 515. http://dx.doi.org/10.1186/1556-276X-7-515
- 123. Lindahl, N., Midtvedt, D., Svensson, J., Nerushev, O.A., Lindvall, N., Isacsson, A., et al. (2012) Determination of the Bending Rigidity of Graphene via Electrostatic Actuation of Buckled Membranes. Nano Letters, 12, 3526-3531.
- 124. Cranford, S.W. (2013) Buckling Induced Delamination of Graphene Composites through Hybrid Molecular Modeling. Applied Physics Letters, 102, Article ID: 031902. http://dx.doi.org/10.1021/nl301080v
- 125. Vella, D., Bico, J., Boudaoud, A., Roman, B. and Reis, P.M. (2009) The Macroscopic Delamination of Thin Films from Elastic Substrates. Proceedings of the National Academy of Sciences USA, 106, 10901-10906. http://dx.doi.org/10.1063/1.4788734
- 126. Goyal, S., Srinivasan, K., Subbarayan, G. and Siegmund, T. (2010) On Instability-Induced Debond Initiation in Thin Film Systems. Engineering Fracture Mechanics, 77, 1298-1313. http://dx.doi.org/10.1073/pnas.0902160106
- 127. Singh, V., Joung, D., Zhai, L., Das, S., Khondaker, S.I. and Seal, S. (2011) Graphene Based Materials: Past, Present and Future. Progress in Materials Science, 56, 1178-1271. http://dx.doi.org/10.1016/j.pmatsci.2011.03.003
- 128. Tang, L.-C., Wan, Y.-J., Yan, D, Pei, Y.-B., Zhao, L., Li, Y.-B., et al. (2013) The Effect of Graphene Dispersion on the Mechanical Properties of Graphene/Epoxy Composites. Carbon, 60, 16-27. http://dx.doi.org/10.1016/j.carbon.2013.03.050
- 129. Zhang, Y., Wang, Y., Yu, J., Chen, L., Zhu, J. and Hu, Z. (2014) Tuning the Interface of Graphene Platelets/Epoxy Composites by the Covalent Grafting of Polybenzimidazole. Polymer (Guildf), 55, 4990-5000. http://dx.doi.org/10.1016/j.polymer.2014.07.045
- 130. Ciesielski, A. and Samorì, P. (2014) Graphene via Sonication Assisted Liquid-Phase Exfoliation. Chemical Society Reviews, 43, 381-398. http://dx.doi.org/10.1039/C3CS60217F
- 131. Wei, J., Vo, T. and Inam, F. (2015) Epoxy/Graphene Nanocomposites—Processing and Properties: A Review. RSC Advances Journal, 5, 73510-73524. http://dx.doi.org/10.1039/C5RA13897C
- 132. Li, D., Muller, M.B., Gilje, S., Kaner, R.B. and Wallace, G.G. (2008) Processable Aqueous Dispersions of Graphene Nanosheets. Nature Nanotechnology, 3, 101-105. http://dx.doi.org/10.1038/nnano.2007.451
- 133. Behabtu, N., Lomeda, J.R., Green, M.J., Higginbotham, A.L., Sinitskii, A., Kosynkin, D.V., et al. (2010) Spontaneous High-Concentration Dispersions and Liquid Crystals of Graphene. Nature Nanotechnology, 5, 406-411. http://dx.doi.org/10.1038/nnano.2010.86
- 134. Smith, G., Bedrov, D., Li, L. and Byutner, O. (2002) A Molecular Dynamics Simulation Study of the Viscoelastic Properties of Polymer Nanocomposites. Journal of Chemical Physics, 117, 9478-9489. http://dx.doi.org/10.1063/1.1516589
- 135. Wang, J., Hu, H., Wang, X., Xu, C., Zhang, M. and Shang, X. (2011) Preparation and Mechanical and Electrical Properties of Graphene Nanosheets-Poly(methylmethacrylate) Nanocomposites via in Situ Suspension Polymerization. Journal of Applied Polymer Science, 122, 1866-18671. http://dx.doi.org/10.1002/app.34284
- 136. Pettes, M.T., Jo, I., Yao, Z. and Shi, L. (2011) Influence of Polymeric Residue on the Thermal Conductivity of Suspended Bilayer Graphene. Nano Letters, 11, 1195-200. http://dx.doi.org/10.1021/nl104156y
- 137. Dubois, S.M.M., Zanolli, Z., Declerck, X. and Charlier, J.C. (2009) Electronic Properties and Quantum Transport in Graphene-Based Nanostructures. European Physical Journal B, 72, 1-24. http://dx.doi.org/10.1140/epjb/e2009-00327-8
- 138. Plimpton, S. (1995) Fast Parallel Algorithms for Short-Range Molecular Dynamics. Journal of Computational Physics, 117, 1-19. http://dx.doi.org/10.1006/jcph.1995.1039
- 139. Inam, F. and Peijs, T. (2007) Re-Agglomeration of Carbon Nanotubes in Two-Part Epoxy System. Influence of the Concentration, 44, 38-44.
- 140. Ji, X.-Y., Cao, Y.-P. and Feng, X.-Q. (2010) Micromechanics Prediction of the Effective Elastic Moduli of Graphene Sheet-Reinforced Polymer Nanocomposites. Modelling and Simulation in Materials Science and Engineering, 18, Article ID: 045005. http://dx.doi.org/10.1088/0965-0393/18/4/045005
- 141. Bortz, D.R., Heras, E.G. and Martin-Gullon, I. (2012) Impressive Fatigue Life and Fracture Toughness Improvements in Graphene Oxide/Epoxy Composites. Macromolecules, 45, 238-245. http://dx.doi.org/10.1021/ma201563k
- 142. Debelak, B. and Lafdi, K. (2007) Use of Exfoliated Graphite Filler to Enhance Polymer Physical Properties. Carbon, 45, 1727-1734. http://dx.doi.org/10.1016/j.carbon.2007.05.010
- 143. Valavala, P.K., Odegard, G.M. and Aifantis, E.C. (2009) Influence of Representative Volume Element Size on Predicted Elastic Properties of Polymer Materials. Modelling and Simulation in Materials Science and Engineering, 17, Article ID: 045004. http://dx.doi.org/10.1088/0965-0393/17/4/045004
- 144. Naghdabadi, J. and Ghanbari, R. (2009) Multiscale Nonlinear Constitutive Modeling of Carbon Nanostructures Based on Interatomic Potentials. Computers Materials & Continua, 10, 41-64.
- 145. Lampman, S.R. (1996) ASM Handbook Vol. 19, Fatigue and Fracture. ASM International, Novelty.
- 146. Tserpes, K.I., Papanikos, P. and Tsirkas, S.A. (2006) A Progressive Fracture Model for Carbon Nanotubes. Composites Part B: Engineering, 37, 662-669. http://dx.doi.org/10.1016/j.compositesb.2006.02.024
- 147. Tserpes, K.I., Papanikos, P., Labeas, G. and Pantelakis, S.G. (2008) Multi-Scale Modeling of Tensile Behavior of Carbon Nanotube-Reinforced Composites. Theoretical and Applied Fracture Mechanics, 49, 51-60. http://dx.doi.org/10.1016/j.tafmec.2007.10.004
- 148. Yu, A., Ramesh, P., Itkis, M.E., Bekyarov, E. and Haddon, R.C. (2007) Graphite Nanoplatelet-Epoxy Composite Thermal Interface Materials. Journal of Physical Chemistry C, 111, 7565-7569. http://dx.doi.org/10.1021/jp071761s
- 149. Yavari, F., Fard, H.R., Pashayi, K., Rafiee, M.A., Zamiri, A., Yu, Z., et al. (2011) Enhanced Thermal Conductivity in a Nanostructured Phase Change Composite Due to Low Concentration Graphene Additives. Journal of Physical Chemistry C, 115, 8753-8758. http://dx.doi.org/10.1021/jp200838s
- 150. Ganguli, S., Roy, A.K. and Anderson, D.P. (2008) Improved Thermal Conductivity for Chemically Functionalized Exfoliated Graphite/Epoxy Composites. Carbon, 46, 806-817. http://dx.doi.org/10.1016/j.carbon.2008.02.008
- 151. Fukushima, H., Drzal, L.T., Rook, B.P. and Rich, M.J. (2006) Thermal Conductivity of Exfoliated Graphite Nanocomposites. Journal of Thermal Analysis and Calorimetry, 85, 235-238. http://dx.doi.org/10.1007/s10973-005-7344-x
- 152. Xie, S.H., Liu, Y.Y. and Li, J.Y. (2008) Comparison of the Effective Conductivity between Composites Reinforced by Graphene Nanosheets and Carbon Nanotubes. Applied Physics Letters, 92, 1-3. http://dx.doi.org/10.1063/1.2949074
- 153. Lin, W., Zhang, R. and Wong, C.P. (2010) Modeling of Thermal Conductivity of Graphite Nanosheet Composites. Journal of Electronic Materials, 39, 268-272. http://dx.doi.org/10.1007/s11664-009-1062-2
- 154. Nan, C.-W., Birringer, R., Clarke, D.R. and Gleiter, H. (1997) Effective Thermal Conductivity of Particulate Composites with Interfacial Thermal Resistance. Journal of Applied Physics, 81, 6692-6699. http://dx.doi.org/10.1063/1.365209
- 155. Hu, L., Desai, T. and Keblinski, P. (2011) Thermal Transport in Graphene-Based Nanocomposite. Journal of Applied Physics, 110, 1-6. http://dx.doi.org/10.1063/1.3610386
- 156. Fan, Z., Gong, F., Nguyen, S.T. and Duong, H.M. (2014) Advanced Multifunctional Graphene Aerogel-Poly(methyl methacrylate) Composites: Experiments and Modeling. Carbon, 81.
- 157. Han, Z. and Fina, A. (2011) Thermal Conductivity of Carbon Nanotubes and Their Polymer Nanocomposites: A Review. Progress in Polymer Science, 36, Article ID: 914944. http://dx.doi.org/10.1016/j.progpolymsci.2010.11.004
- 158. Franosch, T., Hofling, F., Bauer, T. and Frey, E. (2010) Persistent Memory for a Brownian Walker in a Random Array of Obstacles. Chemical Physics, 375, 540-547. http://dx.doi.org/10.1016/j.chemphys.2010.04.023
- 159. Duong, H.M., Papavassiliou, D.V., Mullen, K.J. and Maruyama, S. (2008) Computational Modeling of the Thermal Conductivity of Single-Walled Carbon Nanotube-Polymer Composites. Nanotechnology, 19, Article ID: 065702. http://dx.doi.org/10.1088/0957-4484/19/6/065702
- 160. Gong, F., Papavassiliou, D.V. and Duong, H.M. (2014) Off-Lattice Monte Carlo Simulation of Heat Transfer through Carbon Nanotube Multiphase Systems Taking into Account Thermal Boundary Resistances. Numerical Heat Transfer, Part A: Applications, 65, 1023-1043. http://dx.doi.org/10.1080/10407782.2013.850972
- 161. Gong, F., Hongyan, Z., Papavassiliou, D.V., Bui, K., Lim, C. and Duong, H.M. (2014) Mesoscopic Modeling of Cancer Photothermal Therapy Using Single-Walled Carbon Nanotubes and near Infrared Radiation: Insights through an Off-Lattice Monte Carlo Approach. Nanotechnology, 25, Article ID: 205101. http://dx.doi.org/10.1088/0957-4484/25/20/205101
- 162. Gong, F., Bui, K., Papavassiliou, D.V. and Duong, H.M. (2014) Thermal Transport Phenomena and Limitations in Heterogeneous Polymer Composites Containing Carbon Nanotubes and Inorganic Nanoparticles. Carbon, 78, 305-316. http://dx.doi.org/10.1016/j.carbon.2014.07.007
- 163. Swartz, E.T. and Pohl, R.O. (1989) Thermal Boundary Resistance. Reviews of Modern Physics, 61, 605-668. http://dx.doi.org/10.1103/RevModPhys.61.605
- 164. Ramanathan, T., Stankovich, S., Dikin, D.A., Hiu, L., Shen, H., Nguyen, S.T., et al. (2007) Graphitic Nanofillers in PMMA Nanocomposites—An Investigation of Particle Size and Dispersion and Their Influence on Nanocomposite Properties. Journal of Polymer Science Part B: Polymer Physics, 45, 2097-2112. http://dx.doi.org/10.1002/polb.21187
- 165. Potts, J.R., Dreyer, D.R., Bielawski, C.W. and Ruoff, R.S. (2011) Graphene-Based Polymer Nanocomposites. Polymer (Guildf), 52, 5-25. http://dx.doi.org/10.1016/j.polymer.2010.11.042
- 166. Chen, G.H., Wu, D.J., Weng, W.G. and Yan, W.L. (2001) Preparation of Polymer/Graphite Conducting Nanocomposite by Intercalation Polymerization. Journal of Applied Polymer Science, 82, 2506-2513. http://dx.doi.org/10.1002/app.2101
- 167. Pang, H., Chen, T., Zhang, G., Zeng, B. and Li, Z.M. (2010) An Electrically Conducting Polymer/Graphene Composite with a Very Low Percolation Threshold. Materials Letters, 64, 2226-2229. http://dx.doi.org/10.1016/j.matlet.2010.07.001
- 168. Gon?alves, G., Marques, P.A.A.P,. Barros-Timmons, A., Bdkin, I., Singh, M.K., Emami, N., et al. (2010) Graphene Oxide Modified with PMMA via ATRP as a Reinforcement Filler. Journal of Materials Chemistry, 20, 9927. http://dx.doi.org/10.1039/c0jm01674h�
- 169. Huang, X., Qi, X., Boey, F. and Zhang, H. (2012) Graphene-Based Composites. Chemical Society Reviews, 41, 666. http://dx.doi.org/10.1039/C1CS15078B
- 170. Fan, Z., Marconnet, A., Nguyen, S.T., Lim, C.Y.H. and Duong, H.M. (2014) Effects of Heat Treatment on the Thermal Properties of Highly Nanoporous Graphene Aerogels Using the Infrared Microscopy Technique. International Journal of Heat and Mass Transfer, 76, 122-127. http://dx.doi.org/10.1016/j.ijheatmasstransfer.2014.04.023
- 171. Conduction, T., Nanotube, A.C., Nanocomposites, P. and Density, H.P. (2011) Thermal Conduction in Aligned Carbon Nanotube à Polymer Nanocomposites with High Packing Density. ACS Nano, 5, 4818-4825. http://dx.doi.org/10.1021/nn200847u
- 172. Fang, X., Fan, L.W., Ding, Q., Wang, X., Yao, X.L., Hou, J.F., et al. (2013) Increased Thermal Conductivity of Eicosane-Based Composite Phase Change Materials in the Presence of Graphene Nanoplatelets. Energy and Fuels, 27, 4041-4047. http://dx.doi.org/10.1021/ef400702a
- 173. Chu, K., Li, W., Dong, H. and Tang, F. (2012) Modeling the Thermal Conductivity of Graphene Nanoplatelets Reinforced Composites. EPL (Europhysics Letters), 100, 36001. http://dx.doi.org/10.1209/0295-5075/100/36001
- 174. Gao, L., Zhou, X. and Ding, Y. (2007) Effective Thermal and Electrical Conductivity of Carbon Nanotube Composites. Chemical Physics Letters, 434, 297-300. http://dx.doi.org/10.1016/j.cplett.2006.12.036
- 175. Unnikrishnan, V.U., Banerjee, D. and Reddy, J.N. (2008) Atomistic-Mesoscale Interfacial Resistance Based Thermal Analysis of Carbon Nanotube Systems. International Journal of Thermal Sciences, 47, 1602-1609. http://dx.doi.org/10.1016/j.ijthermalsci.2007.10.012
- 176. Zhou, X.F. and Gao, L. (2006) Effective Thermal Conductivity in Nanofluids of Nonspherical Particles with Interfacial Thermal Resistance: Differential Effective Medium Theory. Journal of Applied Physics, 100, Article ID: 024913. http://dx.doi.org/10.1063/1.2216874
- 177. Ju, S. and Li, Z.Y. (2006) Theory of Thermal Conductance in Carbon Nanotube Composites. Physics Letters A, 353, 194-197. http://dx.doi.org/10.1016/j.physleta.2005.11.086
- 178. Geim, A.K. (2009) Graphene: Status and Prospects. Science, 324, 1530-1535. http://dx.doi.org/10.1126/science.1158877
- 179. Geim, A.K. and Novoselov, K.S. (2007) The Rise of Graphene. Nature Materials, 6, 183-191. http://dx.doi.org/10.1038/nmat1849
- 180. Yan, W., He, W.-Y., Chu, Z.-D., Liu, M., Meng, L., Dou, R.-F., et al. (2013) Strain and Curvature Induced Evolution of Electronic Band Structures in Twisted Graphene Bilayer. Nature Communications, 4, 2159. http://dx.doi.org/10.1038/ncomms3159
- 181. Castro Neto, A.H., Peres, N.M.R., Novoselov, K.S., Geim, A.K. and Guinea, F. (2009) The Electronic Properties of Graphene. Reviews of Modern Physics, 81, 109-162. http://dx.doi.org/10.1103/RevModPhys.81.109
- 182. Zhang, Y., Tan, Y.-W., Stormer, H.L. and Kim, P. (2005) Experimental Observation of the Quantum Hall Effect and Berry’s Phase in Graphene. Nature, 438, 201-204. http://dx.doi.org/10.1038/nature04235
- 183. Novoselov, K.S., Geim, A.K., Morozov, S.V., Jiang, D., Katsnelson, M.I., Grigorieva, I.V., et al. (2005) Two-Dimen- sional Gas Of massless Dirac Fermions in Graphene. Nature, 438, 197-200. http://dx.doi.org/10.1038/nature04233
- 184. Zhao, L,, Levendorf, M., Goncher, S., Schiros, T., Pálová, L., Zabet-Khosousi, A., et al. (2013) Local Atomic and Electronic Structure of Boron Chemical Doping in Monolayer Graphene. Nano Letters, 13, 4659-4665. http://dx.doi.org/10.1021/nl401781d
- 185. Han, W., Kawakami, R.K., Gmitra, M. and Fabian, J. (2014) Graphene Spintronics. Nature Nanotechnology, 9, 794- 807. http://dx.doi.org/10.1038/nnano.2014.214
- 186. Bolotin, K.I., Sikes, K.J., Jiang, Z., Klima, M., Fudenberg, G., Hone, J., et al. (2008) Ultrahigh Electron Mobility in Suspended Graphene. Solid State Communications, 146, 351-355. http://dx.doi.org/10.1016/j.ssc.2008.02.024
- 187. Stauffer, D. and Aharony, A. (1992) Introduction to Percolation Theory. Second Edition, Taylor & Francis, UK
- 188. Martin, C.A., Sandler, J.K.W., Shaffer, M.S.P., Schwarz, M.K., Bauhofer, W., Schulte, K., et al. (2004) Formation of Percolating Networks in Multi-Wall Carbon-Nanotube-Epoxy Composites. Composites Science and Technology, 64, 2309-2316. http://dx.doi.org/10.1016/j.compscitech.2004.01.025
- 189. Grunlan, J.C., Mehrabi, A.R., Bannon, M.V. and Bahr, J.L. (2004) Water-Based Single-Walled-Nanotube-Filled Polymer Composite with an Exceptionally Low Percolation Threshold. Advanced Materials, 16, 150-153. http://dx.doi.org/10.1002/adma.200305409
- 190. Wang, Y., Shan, J.W. and Weng, G.J. (2015) Percolation Threshold and Electrical Conductivity of Graphene-Based Nanocomposites with Filler Agglomeration and Interfacial Tunneling. Journal of Applied Physics, 118, Article ID: 065101. http://dx.doi.org/10.1063/1.4928293
- 191. McCullough, R.L. (1985) Generalized Combining Rules for Predicting Transport Properties of Composite Materials. Composites Science and Technology, 22, 3-21. http://dx.doi.org/10.1016/0266-3538(85)90087-9
- 192. Syurik, J., Alyabyeva, N., Alekseev, A. and Ageev, O.A. (2014) AFM-Based Model of Percolation in Graphene-Based Polymer Nanocomposites. Composites Science and Technology, 95, 38-43. http://dx.doi.org/10.1016/j.compscitech.2014.02.006
- 193. Zallen, R. (1983) The Physics of Amorphous Solids. Wiley, New York. http://dx.doi.org/10.1002/3527602798
- 194. Yousefi, N., Gudarzi, M.M., Zheng, Q., Aboutalebi, S.H., Sharif, F. and Kim, J.-K. (2012) Self-Alignment and High Electrical Conductivity of Ultralarge Graphene Oxide-Polyurethane Nanocomposites. Journal of Materials Chemistry, 22, Article ID: 12709. http://dx.doi.org/10.1039/c2jm30590a
- 195. Yousefi, N., Sun, X., Lin, X., Shen, X., Jia, J., Zhang, B., et al. (2014) Highly Aligned Graphene/Polymer Nanocomposites with Excellent Dielectric Properties for High-Performance Electromagnetic Interference Shielding. Advanced Materials, 26, 5480-5487. http://dx.doi.org/10.1002/adma.201305293
- 196. Berger, M.A. and McCullough, R.L. (1985) Characterization and Analysis of the Electrical Properties of a Metal-Filled Polymer. Composites Science and Technology, 22, 81-106. http://dx.doi.org/10.1016/0266-3538(85)90078-8
- 197. Sohn, H.Y. and Moreland, C. (1968) The Effect of Particle Size Distribution on Packing Density. The Canadian Journal of Chemical Engineering, 46, 162-167. http://dx.doi.org/10.1002/cjce.5450460305
- 198. Chen, Q., Liu, W., Guo, S., Zhu, S., Li, Q., Li, X., et al. (2015) Synthesis of Well-Aligned Millimeter-Sized Tetragon-Shaped Graphene Domains by Tuning the Copper Substrate Orientation. Carbon, 93, 945-952. http://dx.doi.org/10.1016/j.carbon.2015.05.108
- 199. Li, X., Cai, W., An, J., Kim, S., Nah, J., Yang, D., et al. (2009) Large-Area Synthesis of High-Quality and Uniform Graphene Films on Copper Foils. Science, 324, 1312-1314. http://dx.doi.org/10.1126/science.1171245
- 200. Bae, S., Kim, H., Lee, Y., Xu, X., Park, J.-S., Zheng, Y., et al. (2010) Roll-to-Roll Production of 30-Inch Graphene films for Transparent Electrodes. Nature Nanotechnology, 5, 574-578. http://dx.doi.org/10.1038/nnano.2010.132
- 201. Gao, L., Guest, J.R. and Guisinger, N.P. (2010) Epitaxial Graphene on Cu(111). Nano Letters, 10, Article ID: 35123516. http://dx.doi.org/10.1021/nl1016706
- 202. Robinson, Z.R., Tyagi, P., Mowll, TR., Ventrice, C.A., Hannon, J.B. (2012) Argon-assisted growth of epitaxial graphene on Cu(111). Physical Review B: Condensed Matter and Materials Physics, 86, Article ID: 235413. http://dx.doi.org/10.1103/PhysRevB.86.235413
- 203. Ago, H., Kawahara, K., Ogawa, Y., Tanoue, S., Bissett, M.A., Tsuji, M., et al. (2013) PS-13-15 Epitaxial Growth and Electronic Properties of Large Hexagonal Graphene Domains on Cu (111). Thin Film, 1, 438-439.
- 204. Zhao, L., Rim, K.T., Zhou, H., He, R., Heinz, T.F., Pinczuk, A., et al. (2011) Influence of Copper Crystal Surface on the CVD Growth of Large Area Monolayer Graphene. Solid State Communications, 151, 509-513. http://dx.doi.org/10.1016/j.ssc.2011.01.014
- 205. Ogawa, Y., Hu, B., Orofeo, C.M., Tsuji, M., Ikeda, K., Mizuno, S., et al. (2012) Domain Structure and Boundary in Single-Layer Graphene Grown on Cu (111) and Cu (100) Films. The Journal of Physical Chemistry Letters, 3, 219- 226. http://dx.doi.org/10.1021/jz2015555
- 206. Murdock, A.T., Koos, A., Ben, B.T., Houben, L., Batten, T., Zhang, T., et al. (2013) Controlling the Orientation, Edge Geometry, and Thickness of Chemical Vapor Deposition Graphene. ACS Nano, 7, 1351-1359. http://dx.doi.org/10.1021/nn3049297
- 207. Hao, Y., Bharathi, M.S., Wang, L., Liu, Y., Chen, H., Nie, S., et al. (2013) The Role of Surface Oxygen in the Growth of Large Single-Crystal Graphene on Copper. Science, 342, 720-723. http://dx.doi.org/10.1126/science.1243879
- 208. Wu, Y.A., Robertson, A.W., Schaffel, F., Speller, S.C. and Warner, J.H. (2011) Aligned Rectangular Few-Layer Graphene Domains on Copper Surfaces. Chemistry of Materials, 23, 4543-4547. http://dx.doi.org/10.1021/cm201823s
- 209. Dai, G.-P., Wu, M.H., Taylor, D.K. and Vinodgopal, K. (2013) Square-Shaped, Single-Crystal, Monolayer Graphene Domains by Low-Pressure Chemical Vapor Deposition. Materials Research Letters, 1, 67-76. http://dx.doi.org/10.1080/21663831.2013.772078
- 210. Yan, H., Tang, Y., Long, W. and Li, Y. (2014) Enhanced Thermal Conductivity in Polymer Composites with Aligned Graphene Nanosheets. Journal of Materials Science, 49, 5256-5264. http://dx.doi.org/10.1007/s10853-014-8198-z
- 211. Xu, Z., Zhang, Y., Li, P. and Gao, C. (2012) Strong, Conductive, Lightweight, Neat Graphene Aerogel Fibers with Aligned Pores. ACS Nano, 6, 7103-7113. http://dx.doi.org/10.1021/nn3021772
- 212. Terrones, M., Martín, O., González, M., Pozuelo, J., Serrano, B., Cabanelas, J.C., et al. (2011) Interphases in Graphene Polymer-Based Nanocomposites: Achievements and Challenges. Advanced Materials, 23, 5302-5310. http://dx.doi.org/10.1002/adma.201102036
- 213. Luo, T. and Lloyd, J.R. (2012) Enhancement of Thermal Energy Transport across Graphene/Graphite and Polymer Interfaces: A Molecular Dynamics Study. Advanced Functional Materials, 22, 2495-2502. http://dx.doi.org/10.1002/adfm.201103048
- 214. Georgantzinos, S.K., Giannopoulos, G.I. and Anifantis, N.K. (2010) Numerical Investigation of Elastic Mechanical Properties of Graphene Structures. Materials & Design, 31, 4646-4654. http://dx.doi.org/10.1016/j.matdes.2010.05.036
List of Abbreviations
A.R: Aspect ratio, AFM: Atomic force microscopy, ASM: American society of metals, ASTM: American society for testing and materials, CA-AFM: Conductive atomic force microscopy, CM: Continuum mechanics, CNTs: Carbon nanotubes, CVD: Chemical vapor deposition, DC: Direct current, DEM: Differential effective medium, DFT: Density functional theory, EMA: Effective medium approximation, FGrM: Fixed graphene model, G1C: Critical strain energy release rate, GBPNCs: Graphene based polymer nanocomposites, GNPs: Graphene nanoplatelets, LAMMPS: Large-scale Atomic/Molecular Massively Parallel Simulator, K1C: Mode-I plane strain fracture toughness, LJ-potential: Lennard-Jones potential, MD: Molecular dynamics, MLG: Multi- layered graphene, MM: Molecular mechanics, m-rGO: Functionalized reduced graphene oxide, MTM: Mori- Tanaka Method, NRVE: Nanoscopic representative volume element, PBC: Periodic boundary condition, PCFF: Polymer consistent force field, PMCs: Polymer matrix nanocomposites, PMMA: Polymethyl methacrylate, PS: Polystyrene, PVA: Polyvinyl alcohol, RVE: Representative volume element, SEM: Scanning electron microscopy, SERR: Strain energy release rate, SLG: Single layer graphene, TBR: Thermal boundary resistance, UHMPE: Ultra-high modulus polyethylene, VGrM: Varying graphene model.
NOTES

*Corresponding author.