American Journal of Plant Sciences
Vol.3 No.1(2012), Article ID:16635,12 pages DOI:10.4236/ajps.2012.31008
Effect of Shade on Seed Protein, Oil, Fatty Acids, and Minerals in Soybean Lines Varying in Seed Germinability in the Early Soybean Production System*
![]()
1Crop Genetics Research Unit, USDA-ARS, Stoneville, USA; 2Crop Production Systems Research Unit, USDA-ARS, Stoneville, USA; 3Crop Genetics Research Unit, USDA-ARS, Jackson, USA.
Email: #nacer.bellaloui@ars.usda.gov
Received September 16th, 2011; revised September 20th, 2011; accepted October 21st, 2011
Keywords: Nitrogen Assimilation; Seed Composition; Seed Nutrition, Seed Oil; Seed Protein; Soybean Nutrition
ABSTRACT
The cause of poor seed quality (germination) of soybean produced in the Early Soybean Production System in the midsouth USA is still not completely understood. Temperature, solar radiation, and soybean genotype may all be important factors involved. The objective of this research was to evaluate seed composition, mineral level, and nitrogen assimilation in high and low germinability soybean plant introductions in a full-sunlight (unshaded) and a low-light intensity (shaded) environments. Shade netting was employed in field plots that reduced light intensity by about 50% and air temperature by about 10˚F/6˚C (10%). A two-year field experiment was conducted on soybean accessions with high germinability (PI 587982A and PI 603723), low germinability (PI 80480 and PI 84976-1), and on soybean cultivars (DSR-3100 RR STS and Pella 86). Results showed that shade resulted in higher total oil, linoleic and linolenic acids, and lower protein and oleic acid. Shade also resulted in lower nitrogen assimilation, leaf chlorophyll concentration, but unshade resulted in higher total seed boron, iron, and nitrogen concentrations. Seed structural boron was positively correlated with germination and protein. Structural boron percentage was consistently higher under shade than under unshade in PI 80480, PI 84976-1, DSR-3100 RR STS, and Pella 86, but consistently higher under unshade than under shade in higher germinability lines PI 587982A and PI 603723, suggesting that different distribution mechanisms of structural boron exist between genotypes. The positive correlation between germination and structural B and between protein and structural B signify a possible role of B in seed quality traits. Our research demonstrated that light intensity, combined with temperature, can alter seed constituents. Higher germinability lines had higher germination rates and lower percentages of hardseededness, desirable traits for soybean seed.
1. Introduction
Soybean seed is a major source of protein, oil, and important minerals for food and feed [1]. These constituents determine the nutritional value of soybean seed. Soybean protein ranges from 341 to 568 g·kg−1 of total seed weight, with a mean of 421 g·kg−1. Oil ranges from 83 to 279 g·kg−1, with a mean of 195 g·kg−1 [2]. Total oil contains about 12% palmitic acid (16:0), 4% stearic acid (18: 0), 23% oleic acid (18:1), 53% linoleic acid (18:2), and 8% linolenic acid (18:3) [3]. A goal of The Better Bean Initiative, launched in 2000 by the United Soybean Board, is to modify the ratios of fatty acids (high oleic and low linolenic) in oil processing. These fatty acids contribute to the oxidative stability of the oil. Since breeding and genetically engineered genotypes for all desirable fatty acid combinations is difficult, it was suggested that the most desirable phenotype for soybean oil is <7% saturates (16:0 + 18:0), >55% 18:1, and <3% 18:3 [3]. These oils would have multiple uses as edible and processed oils [2].
The Early Soybean Production System (ESPS) in the Midsouth was developed to avoid drought stress during late July through early September. In the ESPS, early maturing cultivars (MG IV and V) are planted in April through early May and harvested in August and September [4,5]. In spite of the yield benefit of the ESPS [5], poor seed quality, including poor seed germination, is still a major problem in the Midsouthern United States [6, 7]. Generally, early planted, short-season cultivars in the ESPS mature during a period of relatively high temperatures and humidity [7]. High temperatures during seed-fill and before maturity may cause seed deterioration [6,8,9].
The new production conditions of growing soybeans in the ESPS, especially high temperature and solar radiation during seed-fill, may shift the period of oil deposition to occur during warmer rather than cooler temperatures and expose plants to more intense light quality. This shift may lead to possible alterations in protein, oil, fatty acid profiles, and mineral nutrition. Since seed constituents and the physiological mechanisms controlling high germinability traits under high heat in the ESPS were not previously studied, the current experiment was designed to evaluate seed protein, oil, fatty acids, mineral nutrition, and germination in high and low seed germinability lines under shaded and unshaded environments. Possible physiological mechanisms relating nutrients and germinability were also investigated. Our approach in studying the effect of shade was similar to those conducted previously by others [10-12]. Since the ESPS environment is warm, temperatures under shaded environment are cooler than those under unshaded conditions. Therefore, changes in physiological parameters will be due to the combined effects of shade and temperature.
2. Materials and Methods
2.1. Field Management and Growth Conditions
A field experiment was conducted in 2005 and 2006 at the Delta Research and Extension Center, Stoneville, MS 33˚26'N, 90˚91'W. Mineral concentrations (mg·kg−1) for the field soil used in the experiment were 0.78 boron (B), 8451 iron (Fe), and 320 phosphorus (P). Organic matter was 2.18%. Soybean genotypes used were two high germinability accessions (PI 587982A, maturity group (MG) IV; PI 603723, MG III), two low germinability accessions (PI 80480 and PI 84976-1, both MG III), and two cultivars (DSR-3100 RR STS and Pella 86, both MG III) [7,13]. All lines were planted in 3-row plots, but only the center row was evaluated and harvested. Row length was 2.74 meters long. Due to limited seed supplies, only the middle rows of each plot were the genotypes indicated above, while the two border rows for each plot were Pella 86. Seed were planted on 27 April in 2005 and 15 May in 2006. Shade treatment was applied to half of the middle row in each plot, while the other half of the middle row was unshaded. Our approach for studying the shade effect was similar to those conducted by others [10-12]. Shade was achieved using a shade net. The shade net reduced light intensity to about 50%. For example, under full light, during a bright day, light intensity ranged from 2000 to 2500 μmol·m−2·s−1 versus under shade, light intensity ranged from 800 - 1200 μmol·m−2·s−1. At high air temperature, 35˚C and above, the air temperature differences between shaded and unshaded environments averaged up to 10˚F/6˚C (10%) less under shade, as measured using infra-red laser thermometer. For example, the temperature in shade was about 94˚F/ 34˚C; in unshade was about 104˚F/40˚C. Plots were furrow irrigated as needed to avoid drought stress, and were harvested in 2005 and 2006 about three weeks after maturity to provide an environment for seed weathering in each year. During the three weeks between maturity and harvest in 2005, the average maximum temperature ranged from 34.4˚C to 35.5˚C, minimum temperature from 21.6˚C to 22.8˚C, and the rainfall from 0.48 to 0.58 cm. In 2006, maximum temperature ranged from 33.3˚C to 35˚C, minimum temperature from 17.2˚C to 22.2˚C, and the rainfall ranged from 0.33 to 0.51 cm. Therefore, differences in seed composition components could be mainly due to the combined effects of shade and temperatures during growth and maturity, and may be partially due to the weathering effects of temperature and rainfall occurring during the three weeks after maturity.
2.2. Seed Analysis for Protein, Oil, and Fatty Acids
Mature seed were analyzed for protein, oil, and fatty acids. About 25 g of seed from each plot were ground using a Laboratory Mill 3600 (Perten, Springfield, IL). Analyses were conducted by near infrared reflectance using a diode array feed analyzer AD 7200 (Perten, Springfield, IL). Calibrations were developed by the University of Minnesota using Perten’s Thermo Galactic Grams PLS IQ software. The calibration curve was created according to Association of Official Analytical Chemists (AOAC) methods [14,15]. Analyses of protein and oil were performed based on a seed dry matter basis [16-18]. Fatty acids were analyzed on an oil basis.
2.3. Nitrate Reductase Activity
Nitrate reductase activity (NRA) was measured on fully expanded leaves from both the shaded and unshaded portions of each plot during flowering (R1 - R2). The Nitrate reductase assay, used to estimate the rate of nitrogen assimilation, was based on the method of [19] and was described for soybean in detail by others [20]. To determine potential NRA (PNRA) under conditions where nitrate is not limited, exogenous nitrate was added to the incubation solution at a concentration of 10 mM as KNO3. Nitrate reductase activity was expressed as µmol  g·fwt−1·hour−1.
2.4. Seed Nitrogen and Minerals
Mature seeds were collected for N and mineral analyses. Seed samples were ground to pass through a 1-mm sieve using a Laboratory Mill 3600 (Perten, Springfield, IL). Seed N concentration was analyzed at The University of Georgia’s Soil, Plant, and Water Laboratory, Athens, GA. Nitrogen was measured in a 0.25 g sample using an elemental analyzer (LECO CNS-2000, LECO Corporation, MI). Other seed minerals were analyzed as described below.
2.5. Boron Measurement
The Total seed B (B) concentration in mature seed was measured with the Azomethine-H method [18,21]. Briefly, 1.0 g seed samples were ashed at 500˚C for 8 hours. Then, ashed samples were extracted with 20 ml of 2 M HCl at 90˚C for 10 min, and then filtered and transferred to plastic vials. A sample of 2 ml was added to 4 ml of a buffer solution containing 25% ammonium acetate, 1.5% EDTA, 12.5% acetic acid, and 4 ml of freshly prepared azomethine-H solution (0.45% azomethine-H and 1% of ascorbic acid) [22]. After 45 min at ambient temperature for color development, B concentration was measured using a Beckman Coulter DU 800 spectrophotometer (Fullerton, California, USA) at 420 nm.
Structural B (SB) refers to the boron fraction that is not free, but bound to cell wall, seed coat, or other fiber tissues. Measurement of structural B was based on that of previous researchers [23]. Briefly, seed samples were finely grown and homogenized with an ice cold mortar and pestle in cold water. The homogenate was then centrifuged at 1,000 g for 10 minutes. The residue was washed three times with 10 volume of 80% ethanol and once with 10 volume of methanol:chloroform mixture (1: 1, v/v). The precipitate was washed with 10 volume of acetone. The samples were then dried and ashed for SB determination according to the method described above.
2.6. Iron Measurement
Iron in mature seed was measured after acid wet digestion, extraction, and reaction of the reduced ferrous Fe with 1, 10-phenanthroline [18,24,25] Two g of dried ground seed were digested in nitric acid (70% m/m HNO3). Then, the acids were removed by volatilization, and the soluble constituents were dissolved in 2 M HCl. Iron concentrations ranging from 0.0 to 4 μg·ml−1 Fe, prepared in 0.4 M HCl, were used for standard solutions. Phenanthroline solution of 0.25% m/v was prepared in 25% v/v ethanol. A reagent of a fresh quinol solution (1% m/v) was prepared and used on the day of the measurement. An aliquot of approximately 4 ml was pipetted into a 25 ml volumetric flask, and a 0.4 M HCl solution was then used to dilute the aliquot to 5 ml. A volume of quinol solution was added and mixed, followed by the addition of 3 ml of phenanthroline solution and 5 ml of tri-sodium citrate solution (8% m/v). The mixture solution containing the aliquot (HCl, phenanthroline, and trisodium citrate) was diluted to 25 ml. The absorbance of the mixture was read, after it stood 4 hours at 510 nm, using a Beckman Coulter DU 800 spectrophotometer (Fullerton, California, USA).
2.7. Chlorophyll Concentration
Chlorophyll concentration was measured on a fully-expanded leaf during flowering. Chlorophyll was extracted according to others [26]. Chlorophyll concentration was calculated using an equation [27] and expressed as milligrams of chlorophyll per gram of leaf fresh weight. Chlorophyll concentration was measured spectrophotometrically using a Beckman Coulter DU 800 spectrophotometer (Fullerton, California, USA).
Seed germination and accelerated-aging germination (measure of vigor) were evaluated using a random sample of 200 seed and 42 g per plot, respectively. The assays were conducted by the State Seed Testing Laboratory, Mississippi State, MS according to Association of Official Seed Analysts protocols [28,29]. Percentages of hardseededness were determined from the standard germination test. To evaluate for Phomopsis longicolla (PL) infestation, a 25 seed sample from each plot was evaluated. Briefly, seeds were surface sterilized and then plated on acidified potato dextrose agar. After incubation at 24˚C for 4 days, the number of seeds infected with Phomopsis longicolla was recorded as percent infection [7].
2.8. Experimental Design and Statistical Analysis
A randomized complete block design was used with four replicates. Half of each middle row was shaded and the other half was unshaded. Shade net was placed on a plastic-tube frame over the plants to avoid disruption of plant growth. The middle row was harvested for seed composition analysis, keeping separate the seed bulks from the shaded and unshaded portions. Plants at the edge between shaded and unshaded were not harvested. Analysis of variance was conducted using proc mixed [30]. Correlations between SB and protein and between SB and germination across years and across genotypes were conducted using proc corr in SAS [30]. Means were separated by Fisher’s least significant difference test at the 5% level of probability.
3. Results and Discussion
3.1. Analysis of Variance: Seed Composition
Analysis of variance showed that genotype, shade, year × genotype, genotype × shade had significant effects on seed protein and oil. Genotype and shade had significant effects on palmitic, oleic, linoleic and linolenic acids. Genotype × shade interactions were significant for palmitic, oleic and linolenic acids. Year was not significant for seed constituents, whereas year interactions with genotype or shade were significant for some seed constituents (Table 1). Genotype and shade were major sources of variability for protein, oil, oleic, linoleic, and linolenic acids. Genotype and shade were significant for NRA, Chl, total B, Fe, and N (Table 2). Genotype, shade, and year × genotype were significant for germination, hardseededness, and phomopsis. The interactions of year, variety, and shade depended on each variable. The analysis showed that both shade and genotype were the most influential factors on most seed constituents (protein, oil, oleic, linoleic, and linolenic acids), suggesting that shade or light intensity or both, and genotype differences were major sources of the variability of these constituent. Year × genotype and shade × genotype interactions for protein and oil indicate that the effect of year and shading depended on the genotype and how it is influenced by yearly abiotic environmental factors such as temperature, and yearly biotic environmental factors such as phomopsis seed decay. The significant response of NRA, Chl, B, Fe, and N to genotype and shade effects indicates the important influence of genotype and shade on the above variables. In addition, genotype and shading strongly affected germination, hardseed, and phomopsis, while the year × genotype interaction was significant as well.
3.2. Mean Values: Seed Composition
In 2005 and 2006, protein was higher in unshaded than in shaded plants for PI 80480, PI 84976-1, and DSR-3100 RR STS (Table 3). Protein percentage in the high germination potential lines PI 587982A and PI 603723, and the check Pella 86 were not consistent among treatments across years (Table 3). By contrast, oil, linoleic and linolenic acid were higher and oleic acid was lower in shaded plants than in unshaded plants in all genotypes in 2005 and 2006, except for PI 84976-1 and Pella 86 (Table 3). PI 84976-1 and Pella 86 differed from the other genotypes in 2006, but not 2005, in that they showed no significant differences for oil concentration between shaded and unshaded treatments. The consistently higher protein of PI 80480, PI 84976-1, and DSR-3100 RR STS
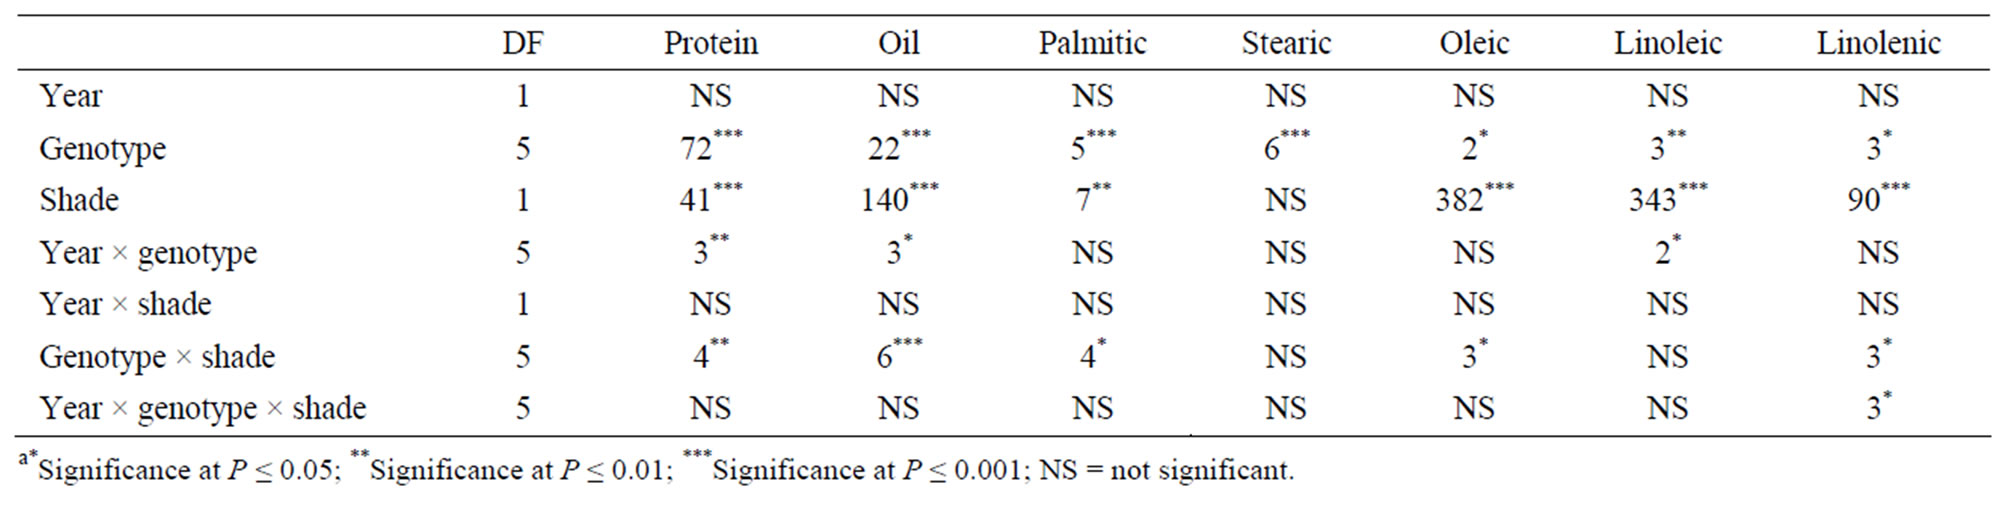
Table 1. Analysis of variance with F values and levels of significance for the effects of year, shade, and genotype for soybean seed composition (protein, oil, and fatty acids) among soybean varieties that differ in germinability in high temperature environmentsa.
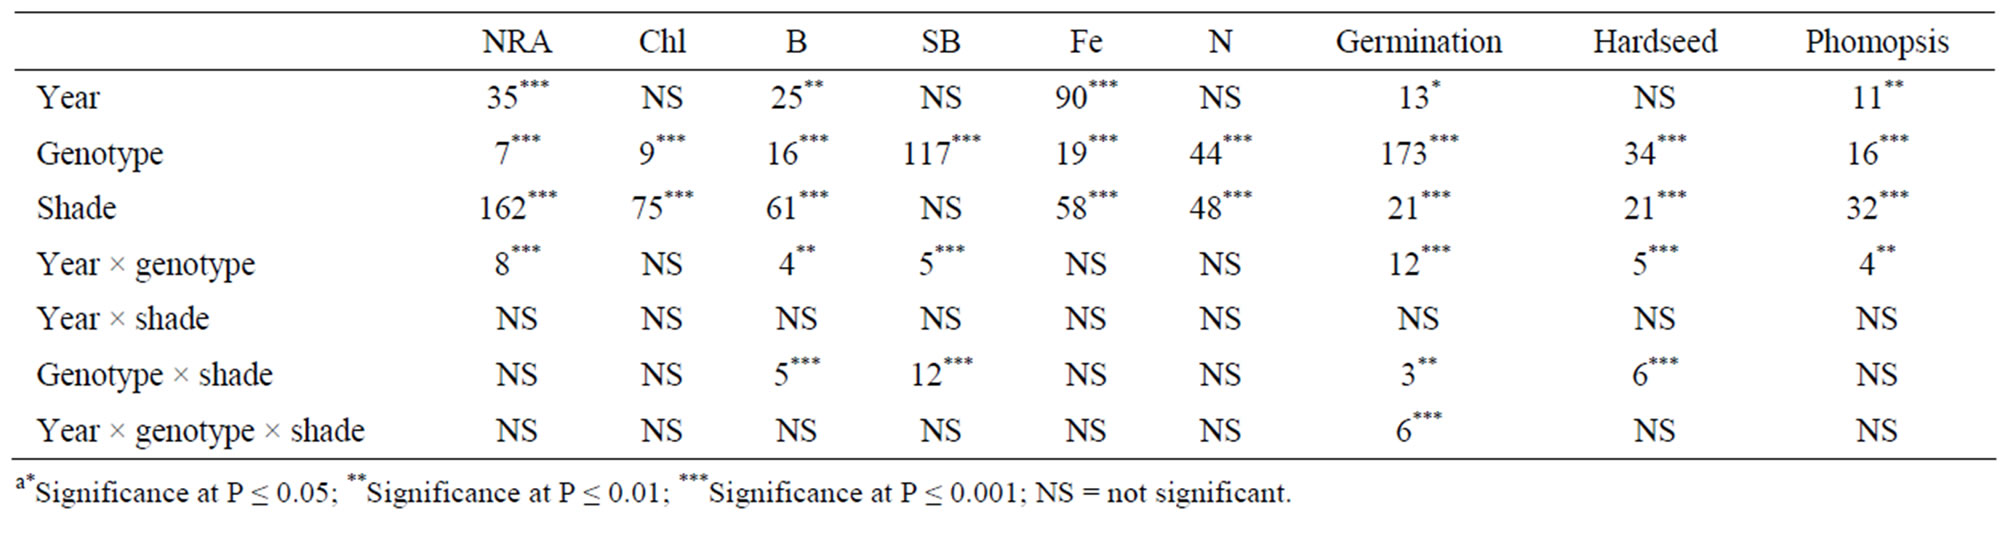
Table 2. Analysis of variance with F values and levels of significance for the effects of year, shade, and genotype for leaf nitrate reducatse activity (NRA, µmol nitrite/g fwt/hour), chlorophyll (Chl, mg/g fwt), total seed Boron (B), structural boron (SB), iron (Fe), nitrogen (N), and percentages of standard seed germination, hardseededness, and phomopsis incidence among soybean genotypes that differ in germinability in high temperature environmenta.
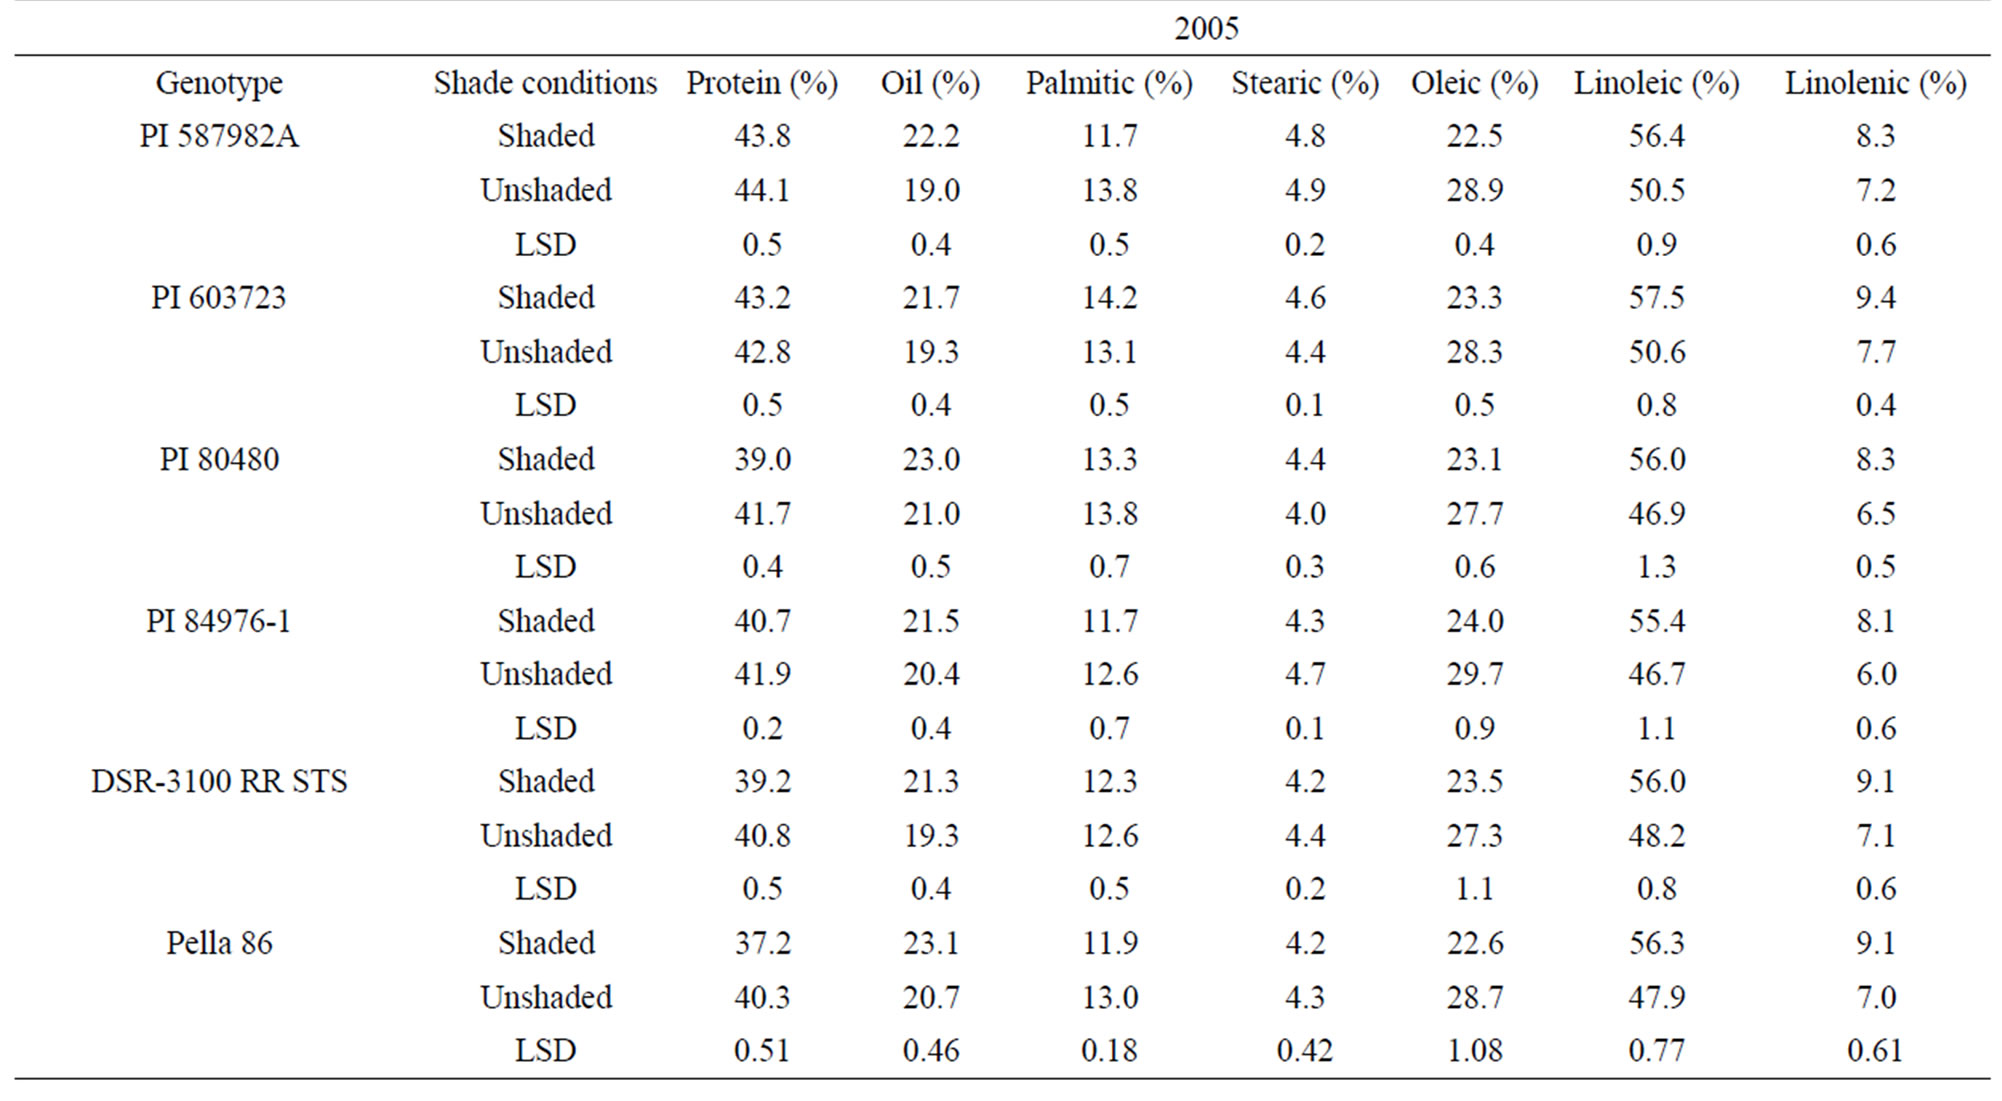
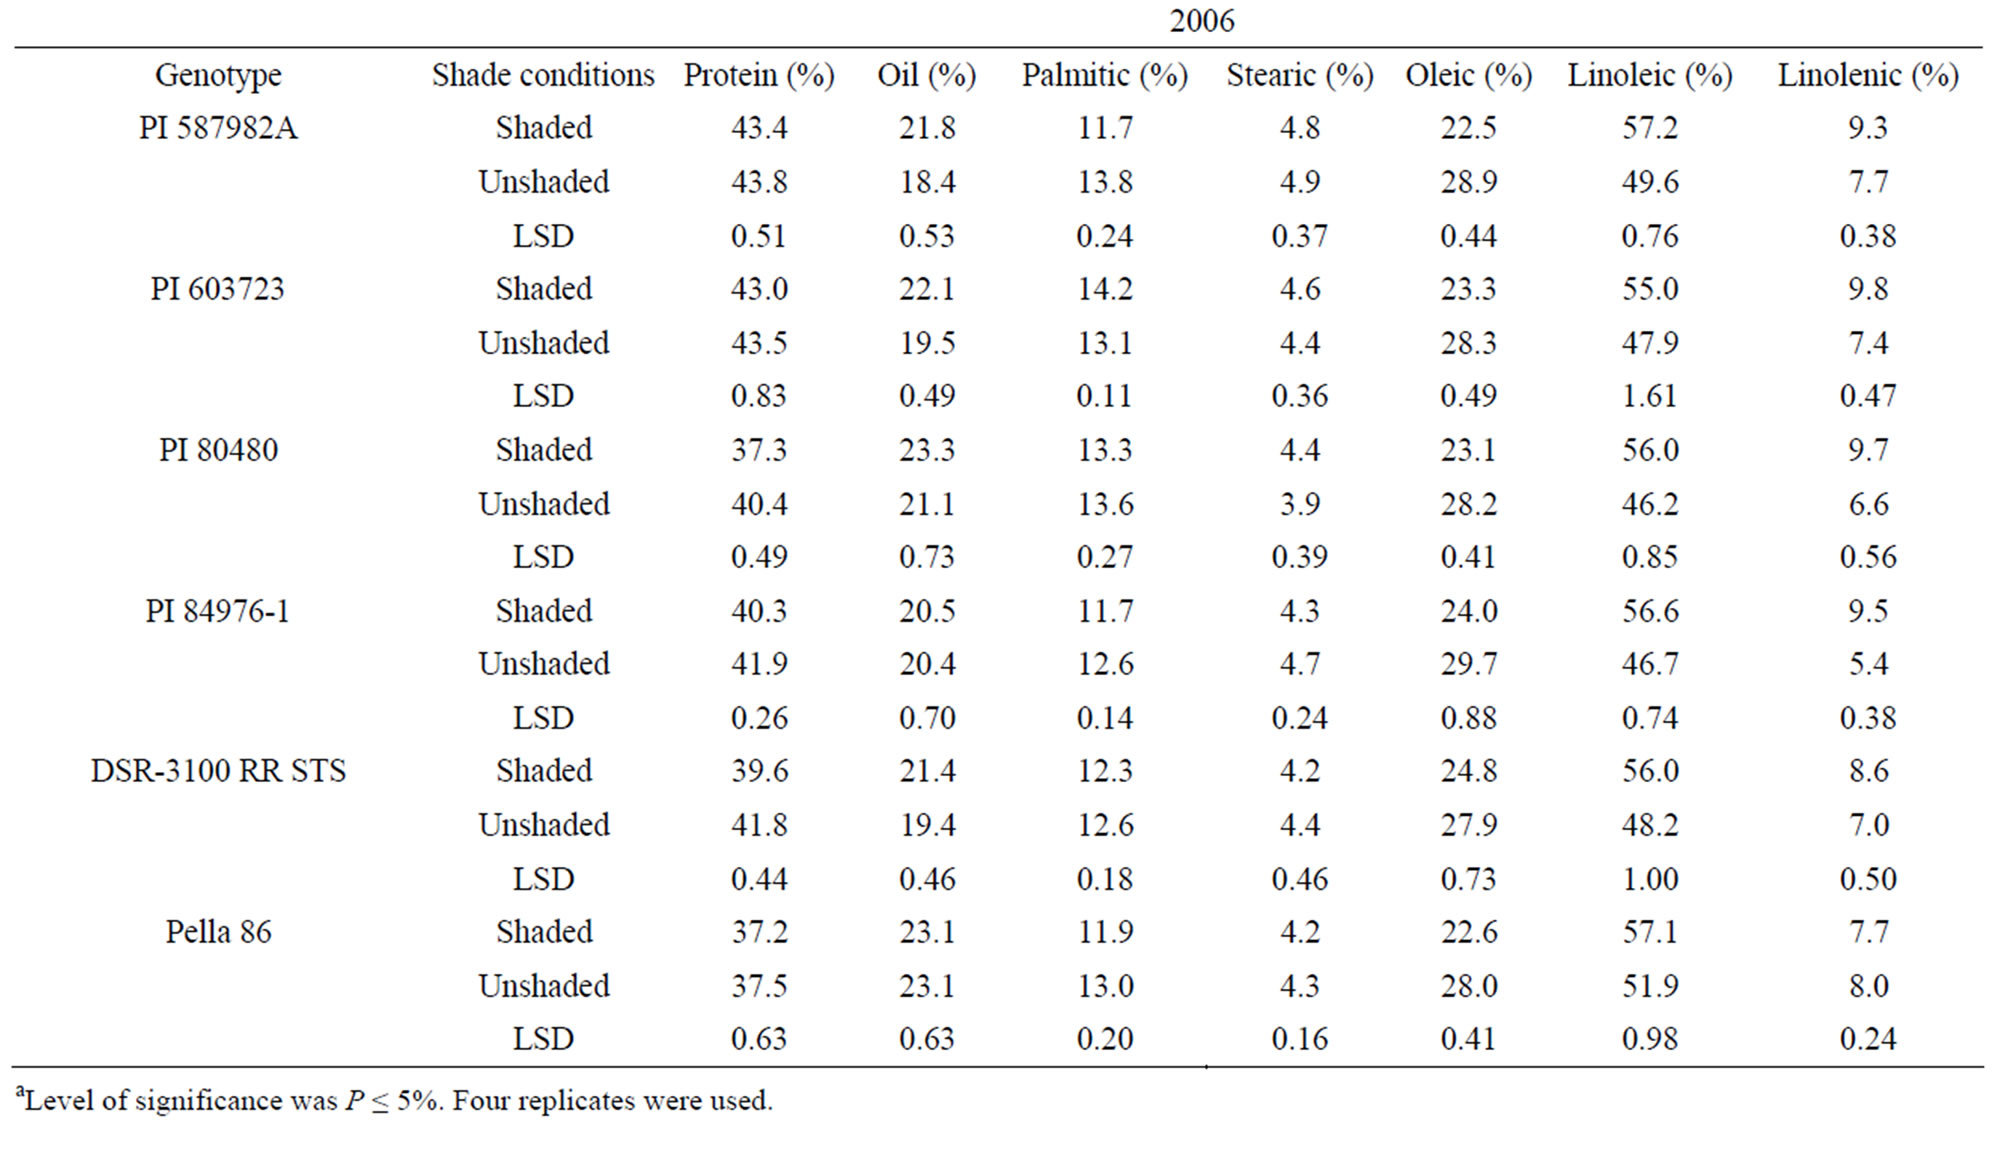
Table 3. Mean values of seed protein, oil, and fatty acids as affected by shading among soybean genotypes differing in their germinability in high temperature environmentsa.
in 2005 and 2006 may be due to higher temperatures and higher light intensity under unshaded versus shaded conditions. For both PIs 587982A and 603723 in both 2005 and 2006, shaded and unshaded were consistently not different for protein (Table 3), indicating that protein response to the shade and temperature depended on genotype, and factors other than shade and temperature had also an influence. The observation that oil was higher in the seed of shaded plants than in that of unshaded plants of PI 587982A, PI 603723, PI 80480, and DSR-3100 may indicate that total oil increased due to the inverse response to protein increase [31] or if conditions inhibit oil synthesis (unshaded) then resources are shifted to protein synthesis. The consistency of higher oleic and lower linoleic and linolenic acids (except for Pella 86 for linolenic acid) under unshaded conditions indicated that linoleic and linolenic acids are sensitive to higher temperature and light.
Our results agreed with previous research in that higher temperatures from unshaded plants increase protein and oleic acid, and decrease oil, linoleic and linolenic acids. For example, it was found that oil concentration increased as temperature increased up to a point, and then it decreased as temperature increased [32-34]. Recently, it was found that protein increased linearly in 2005 when the average maximum temperature of 20 days before maturity was high (ranged from 33.2˚C to 36˚C in 2005) [35]. However, in 2004, when temperatures were lower (ranged from 31.8˚C to 33.5˚C), there was a negative relationship between protein and temperature. Under ESPS conditions in the Mississippi Delta, maximum temperatures during seed-fill can be as high as 40˚C. Our results support previous research that protein increases with higher temperature, but this response may not be applicable to all soybeans, as genotypes may differ in their sensitivity to temperatures and days to maturity [35]. A study was conducted on two sets of near-isogenic soybean lines (Clark and Harosoy), where the maturity of each line within a set (Clark or Harosoy) varied, but all had a common genotypic background [35]. They found that there was a positive linear relationship between protein concentration and days to maturity among isolines of the Clark set. However, in the Harosoy isolines there was no relationship between protein and maturity. They also found that there was a negative linear relationship between oil concentration and maturity for both Clark and Harosoy lines. They reported that maturity had a greater effect on seed composition than maximum temperature in the high temperature environment of Stoneville, MS.
For fatty acids, it was found that seed developed under higher temperatures had lower linoleic and linolenic acids and higher oleic acid [33,35,36]. It was suggested that oleic acid levels increased and linoleic and linolenic acid levels decreased when soybean was grown in warmer environments [37]. On the other hand, it found that there was no effect of mean temperature on fatty acids [38]. The inconsistency of the literature may imply that the response and sensitivity of fatty acids to temperature may depend on genotype, days to maturity, and range of temperature [35]. The increase of protein and oleic acids in seed of unshaded plants led to a decrease in total oil and linoleic and linolenic acids because of their inverse relationships with protein and oleic acid, respectively [18, 31,35].
Shade was reported to affect protein and oil concentrations because photosynthesis during seed-fill is the primary source of energy for seed growth [39,40] and N assimilation via  uptake and N2 fixation [41]. Thus, reducing photosynthesis during the seed-fill period would result in the restriction of C and N assimilation, leading to a reduced accrual of seed protein and oil. This explanation is partially supported by recent findings that seed produced at lower nodes had lower protein, oleic acid, NRA, and chlorophyll concentration, but higher oil and linolenic acid [18] than seed produced on nodes higher on the plant. The lower NRA, nitrate assimilation, and chlorophyll concentration under shaded conditions may be due to lesser light intensity (light intensity was about 50% lower under shade than under unshade), leading to a reduction in photosynthesis and less assimilation of C and N. Other research showed that shade had no effect on seed protein [42] and none on seed protein and oil [43], but it was also found that the effect of shading on protein and oil was variable [44].
3.3. Analysis of Variance: Seed Germination, Hardseededness, and Phomopsis
Analysis of variance showed that genotype, shade, and year × genotype significantly affected seed germination, hardseededness, and phomopsis. Genotype × shade was significant for germination and hardseededness, while year × genotype × shade was significant for germination. Looking at the different variables tested, it is clear that germination was significantly affected by most parameters (Table 2). The lack of a year × shade interaction for germination indicates that shading had the same effect on germination each year. There were significant influences of genotype, shade, and year × genotype interaction on germination, hardseed, and phomopsis. The year x genotype interaction indicates that the genotype effect on these variables depended on the year. The lack of a year × shading interaction indicates that shading has a similar effect in each year (Table 2).
3.4. Mean Values: Seed Germination, Hardseededness, and Phomopsis
Means for PI 603723 showed consistently higher germination percentages under shade than under unshade in 2005 and 2006 (Table 4). Meanwhile, shaded germination values of PI 80480, PI 587982A, and DSR-3100 RR STS were higher than those of the unshaded in one year, but not different in the other year. Alternately, the unshaded mean germination of PI 84976-1 was higher in 2006, while not different from that of the shaded in 2005 (Table 4). The germination means for Pella 86 were not
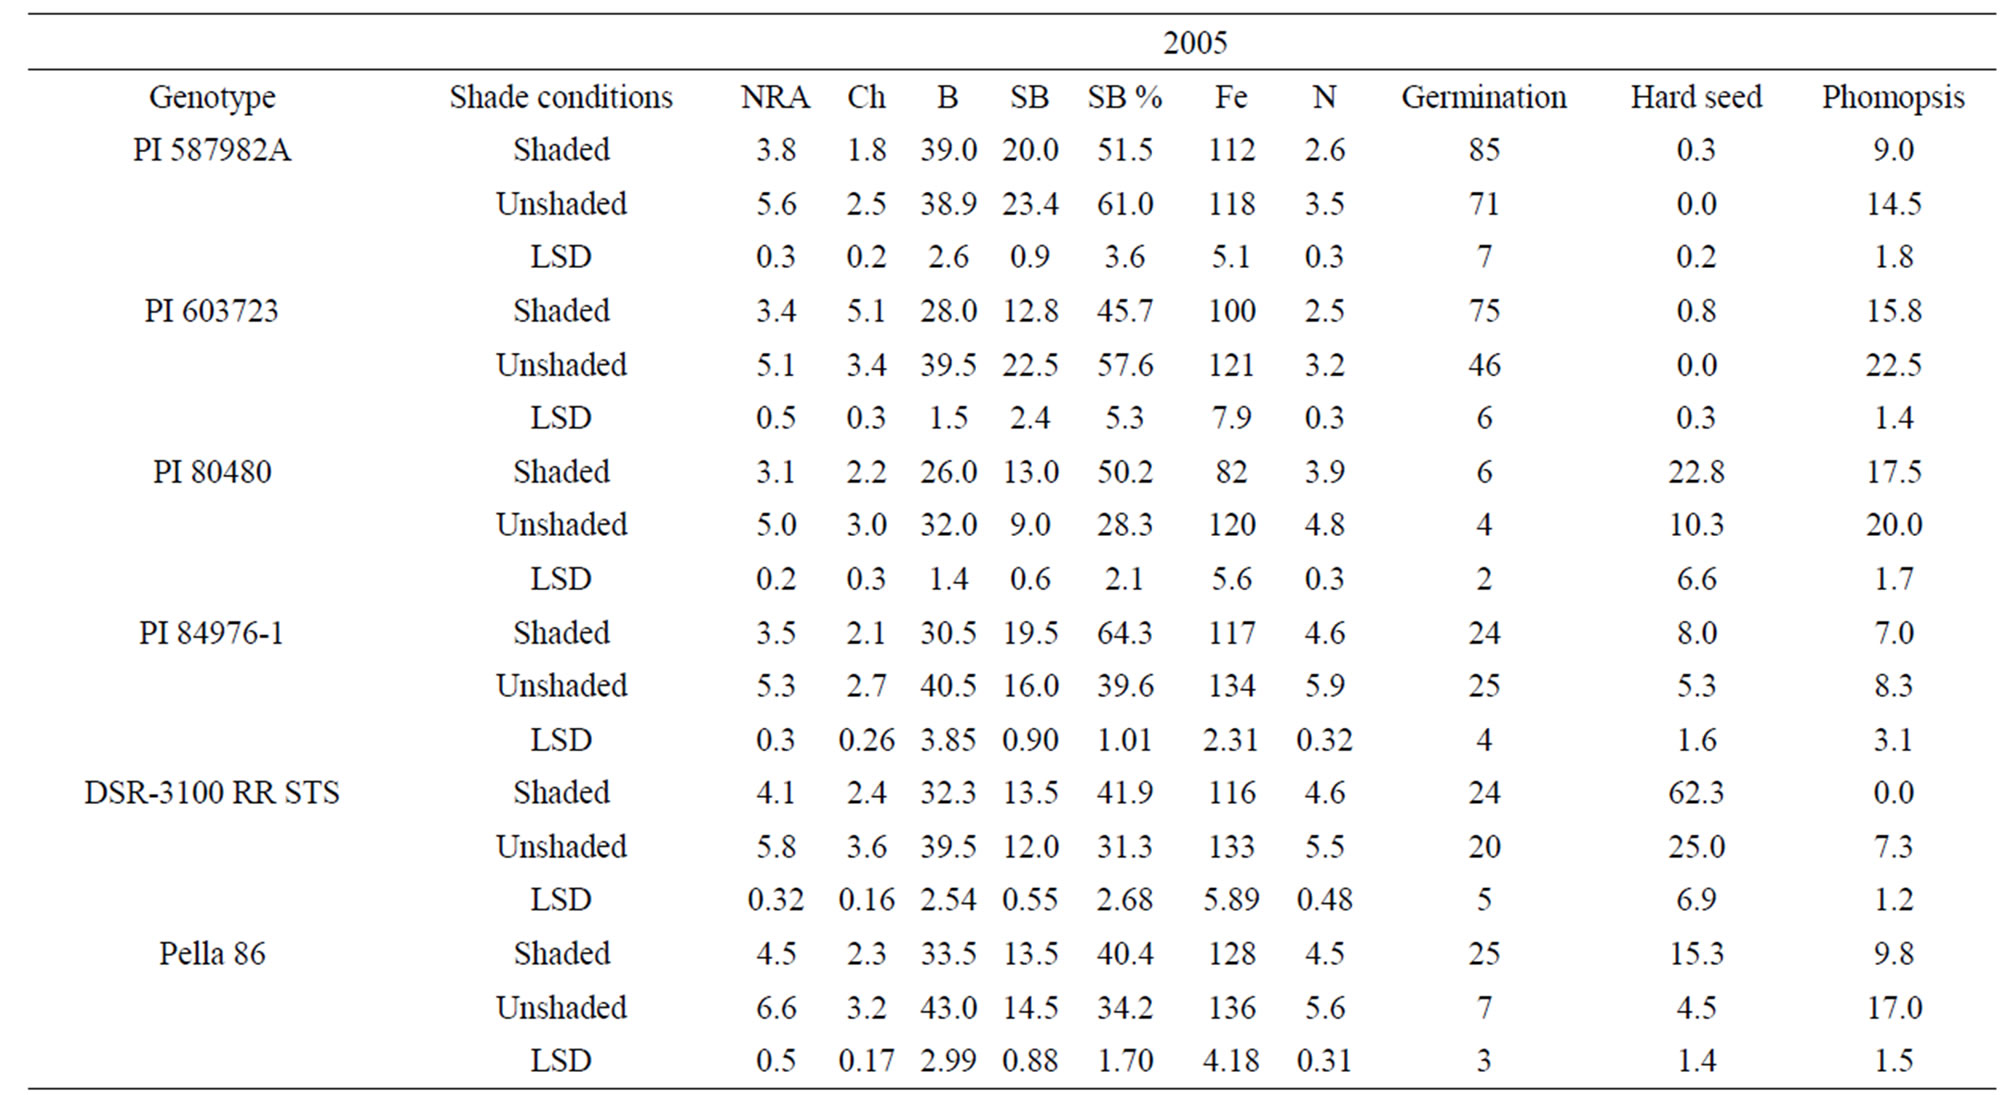
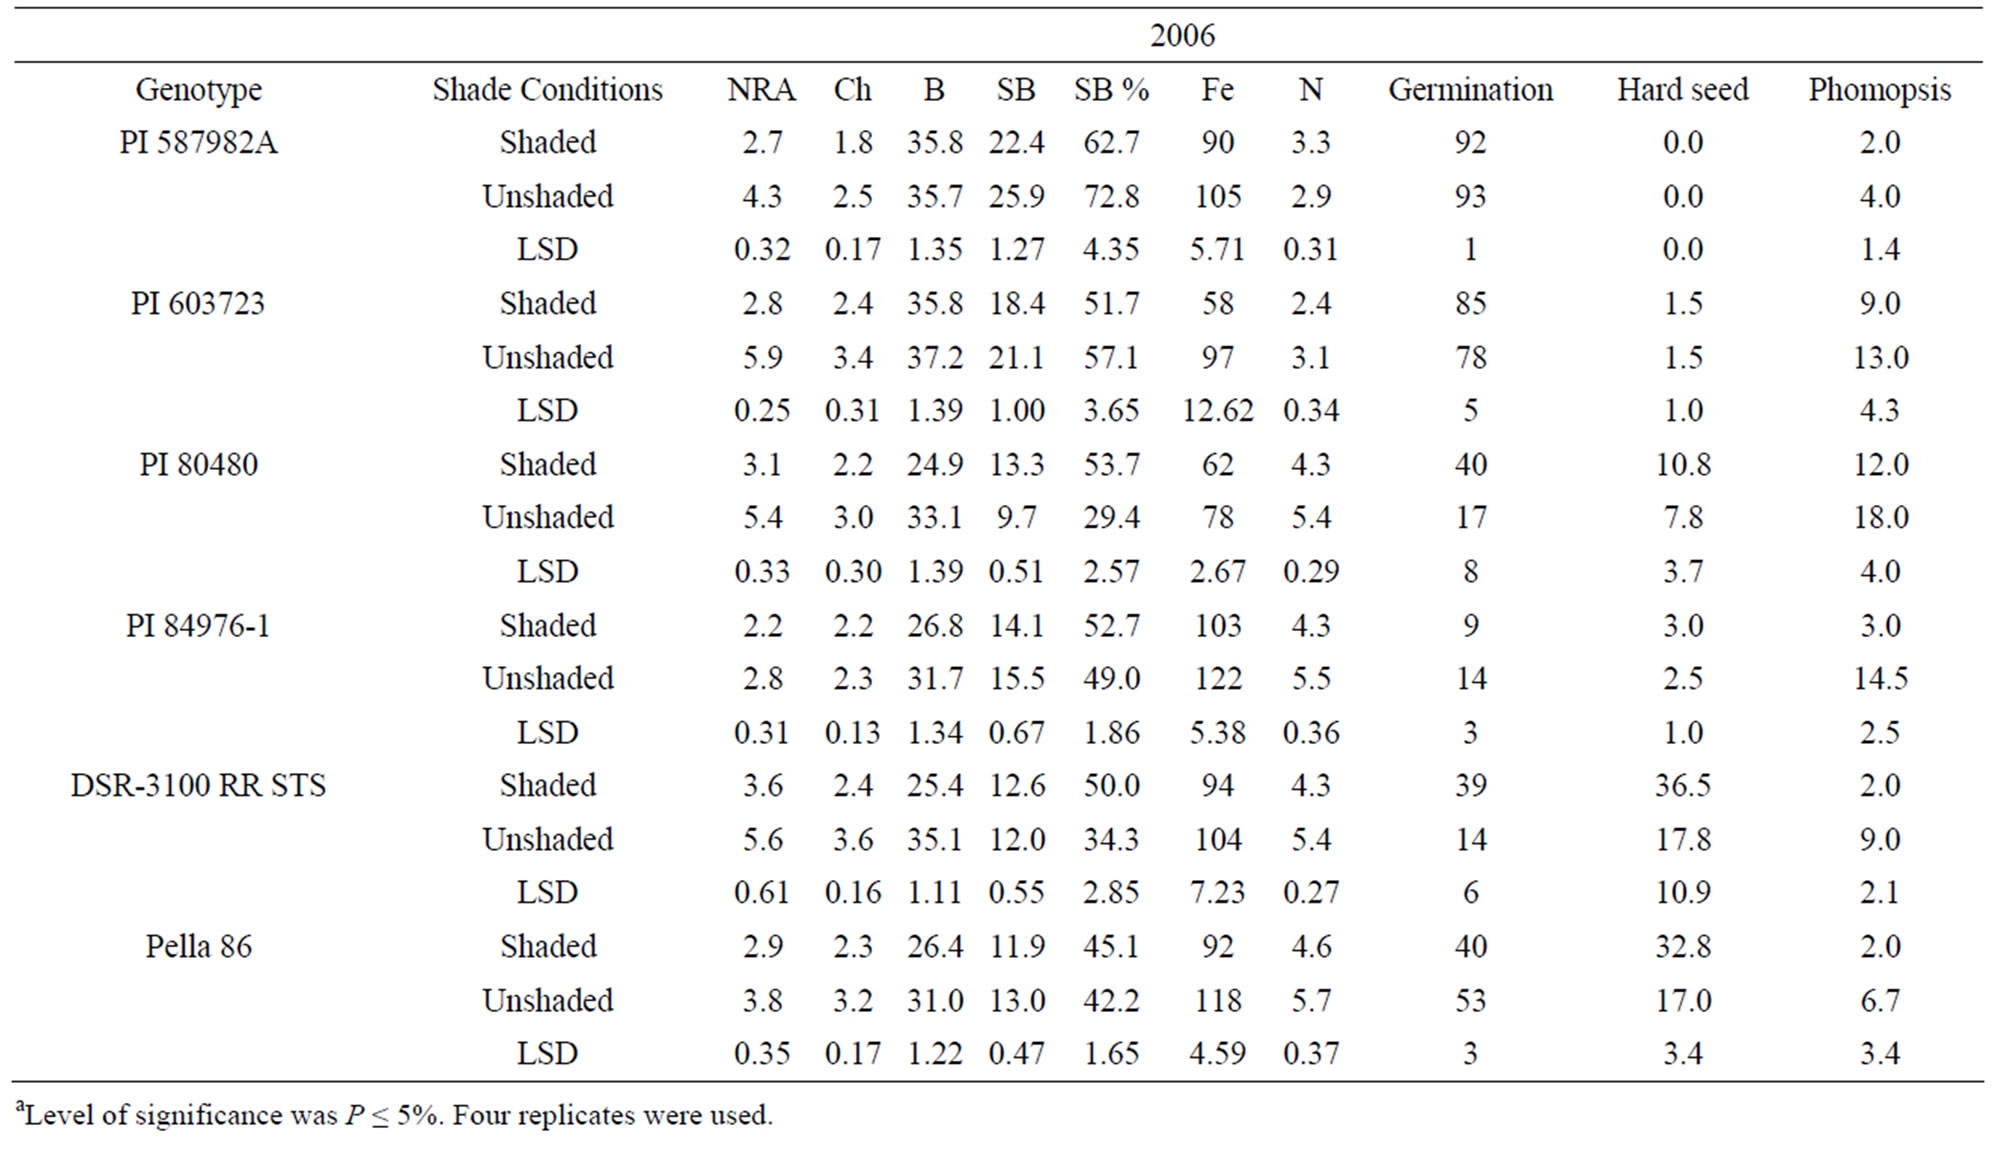
Table 4. Mean values of nitrate reductase activity (NRA, µmol· ·gfwt−1·hour−1), chlorophyll (Chl, mg·gfwt−1), boron (B, mg·B·kg−1), structural B (SB, mg·B·kg−1), iron (Fe, mg·Fe·kg−1), nitrogen (N, %), germination (%), hardseedness (%), and phomopsis (%) as affected by shade among soybean genotype differing in their germinability in high temperature environmentsa.
consistent across years, being higher in the shaded treatment in 2005, while being higher in the unshaded in 2006. Hardseededness was higher under shade than under nonshade for DSR-3100 RR STS and Pella 86 in both 2005 and 2006. PIs 587982A and 603723 had consistently low hardseededness across both years and shade treatments. Both PIs 80480 and 84976-1 had significantly more hardseed under shading than under un-shading in 2005, but shade treatments were not different for either PI in 2006 (Table 4). All lines had significantly lower phomopsis seed infection under shade than under unshaded conditions, except for PIs 84976-1 in 2005 and 603723 in 2006. But for both exceptions, phomopsis trended lower in the shaded treatment. Both PI 587982A and PI 603723 (good seed germination under high temperatures) had higher germination percentages and the lowest hardseededness compared to the poor seed germinations lines (PI 80480 and PI 84976-1) or cultivars (DSR-3100 RR STS and Pella 86). Among all lines, PI 587982A showed the lowest phomopsis seed infection in 2006, but PI 587982A had lower infection than PI 80480 in 2005 and 2006.
The generally higher seed germination under shade was likely due to less heat since the temperature was about 10% lower under shade than unshade. The higher germination percentages of PIs 587982A and 603723, compared to other lines, confirm that these two lines have higher germinabilities under conditions of higher temperatures such as in the ESPS. The high germinating lines (PI 587982A and PI 603723) had the lowest hardseed percentages supports previous findings [7,45,46]. Since there were no significant correlations between phomopsis percentage and germination (data not shown), we cannot attribute the superior germination of these lines to resistance to Phomopsis longicolla. Previous research showed that Phomopsis longicolla Hobbs was reported to cause substandard germination [6,7,47]. High temperature with wet and dry conditions is conducive for seed coat wrinkling, contributing to reduced germination [8]. It was suggested that the severity of plant infection by phomopsis was influenced by environment, and involves altered seed composition [48]. Phomopsis infection is affected by environmental factors such as temperature, rain/irrigation [6,7,45,46,], genotype, and crop management.
The causes of poor seed quality in the ESPS is not completely understood, but some possible explanations have been documented [49]. It was suggested that since seed germination can be affected before and after physiological seed maturity, temperature, moisture, and disease infection during the periods from the beginning of seed-fill to full maturity and beyond, can reduce seed viability and vigor [50,51]. Isolation of P. longicolla from seed was found to be negatively correlated with seed germination percentage in irrigated environments, but not in the nonirrigated environment. Further, pod infection was correlated with seed infection in both irrigated and non-irrigated environments [45]. Since it was shown that Freedom, a late-maturing cultivar (MG V), had a lower seed infection and higher germination, it was suggested that its lower seed infection was likely due to it is maturing later in the growing season when it is generally cooler and drier [45]. The significant negative correlation between percent hardseedness and both percent seed infection and percent germination under irrigated conditions was also found by others [45,52]. Although differences in the percentage of hardseededness of soybean lines have been attributed to genetic variation [53] and environmental conditions [7,45], it is clear that the contribution of hardseededness plays a great role in preventing phomopsis infection. However, hardseededness is an undesirable trait, not only for lowering germination, but also for its negative impact on processing soybean to soy food, leading to adverse quality and cost factors [54].
3.5. Analysis of Variance: Nitrate Reductase Activity, Chlorophyll, Boron, Iron, and Nitrogen
Analysis of variance showed that NRA, B, and Fe were significantly affected by year, variety, and shade, with shade being the major source of variability except for Fe where year was the main source of variability (Table 2). For NRA, B, and SB the effect of variety on these variables depended on year because of the significant year × variety interaction. Chlorophyll concentration and N were not significantly affected by year, but were influenced by genotype, and shade, and these effects were similar each year. Structural B was affected by genotype, year × genotype, and genotype × shade, indicating that not only was the effect of genotype significant, but also that the genotypic effect was influenced by year and shade. Both total B and SB were significantly affected by genotype× shade (Table 2), indicating that the effect of treatment depended on the genotype.
3.6. Mean Value: Nitrate Reductase Activity, B, Fe, and N
Genotypes PI 80480, PI 84976-1, Pella86, and DSR- 3100 RR STS showed that NRA, B, Fe, and N were higher in unshaded plants than in shaded plants in 2005 and 2006. Nitrate reductase activity, B, Fe, and N were not consistent in PI 587982A and PI 603723. Structural B and structural B percentage (the contribution of structural B to the total B) was higher in unshaded than in shaded in PI 587982A and PI 603723 in 2005 and 2006. However, SB was higher in shaded than in unshaded in PI 80480 in 2005 and 2006. Structural boron percentage was consistently higher under shade than under unshade in PI 80480, PI 84976-1, DSR-3100 RR STS, and Pella 86, but consistently higher under unshaded than under shade in higher germinability lines PI 587982A and PI 603723, suggesting that different distribution mechanisms of structural boron exist between genotypes. The higher NRA, B, Fe, and N concentrations under unshaded than under shaded may be due to higher light intensity under unshaded conditions, leading to higher photosynthesis (providing the energy source for NRA), and possibly higher uptake rate and nutrient translocation from vegetative tissues (source) to seed (sink), especially for B, Fe, and N. This response cannot be generalized because PI 587982A and PI 603723 had inconsistent response. The uptake and assimilation of B, Fe, and N have been previously reported to be related [55]. The higher concentrations of B, Fe, and N under unshaded conditions were accompanied by higher seed protein and oleic acid, but lower oil, linoleic and linolenic acids. This trend was shown in most of varieties. The relationship between seed nutrients and seed protein, oil, and fatty acids was previously reported [18,35].
Our results indicate higher NRA, chlorophyll, B, Fe, and N values under unshaded than under shaded conditions, possibly due to higher light intensity and higher nitrate availability under unshaded conditions. Furthermore, when nitrate was added to the nitrate reductase assay buffer to measure potential NRA (PNRA) in leaves of shaded plants, higher (30% higher) PNRA was observed compared with that in unshaded plants, indicating less nitrate availability in leaves in shade (data not shown). This is supported by previous research [18,29] that under lower light intensity, NRA and nitrate availability decreased. The relation between soil mineral nutrition and seed protein, oil, and fatty acids [56], and between leaf and seed mineral nutrition and seed protein, oil, and fatty acids [18,57] was previously shown and support our results. The different response of seed constituents and minerals to the interaction between year and shading and variety may be due to different growing conditions of temperature and solar radiation (Table 5), and this supports previous research [18,35].
3.7. Correlations between Germination, Structural B, and Seed Composition
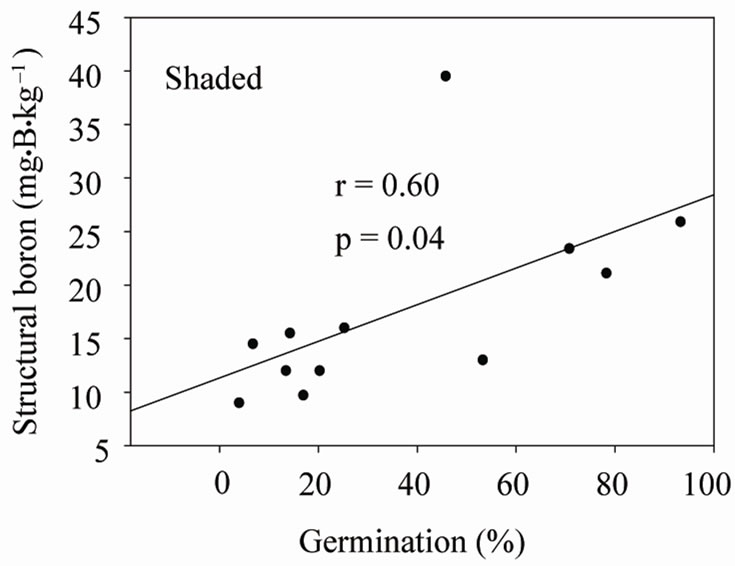
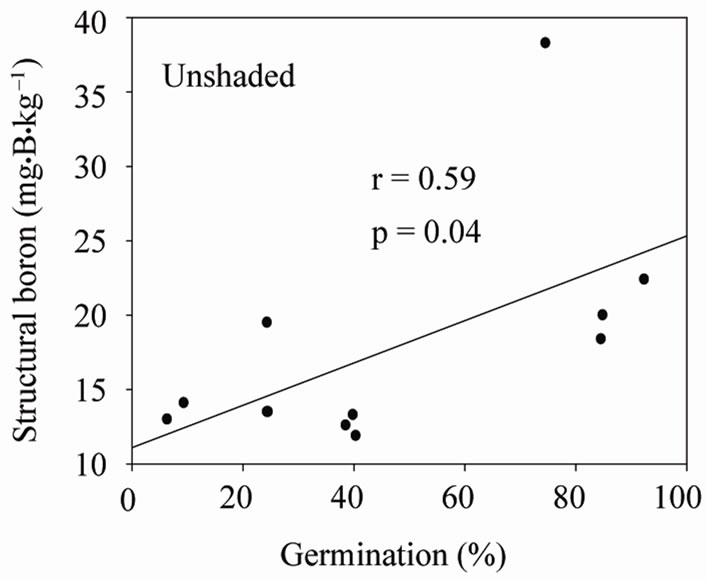
Under shaded conditions, there was a positive correlation between germination percentage and structural B (Figure 1(a)), and between protein percentage and structural B (Figure 1(b)). Similar patterns were found under unshaded conditions between germination percentage and structural B (Figure 2(a)), and between protein percentage and structural B (Figure 2(b)). The positive correlation between germination and structural B indicates the contribution of B to cell wall and cell membrane integrity [23] and suggests that B may increase germination rate and improve seed quality [58,59]. The correlation be
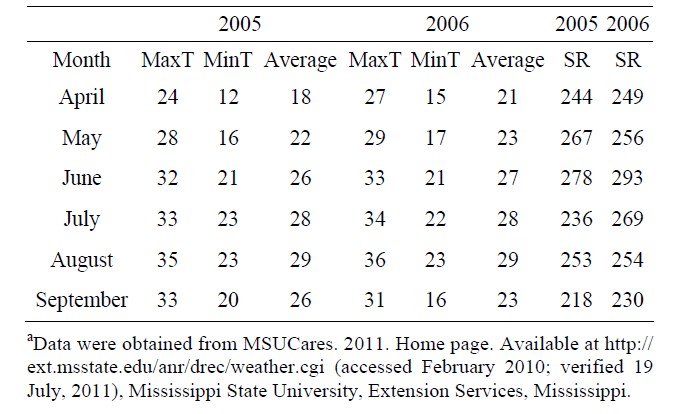
Table 5. Monthly maximum (MaxT), minimum (MinT), and average temperature (˚C) and average monthly solar radiation (SR) (Watt·m−2) in 2005 and 2006 in Stoneville, MS, USAa.
 (a)
(a)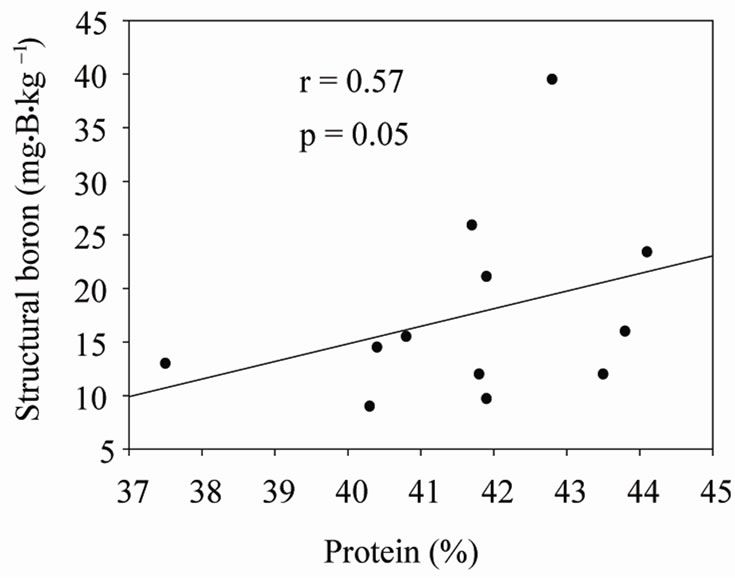 (b)
(b)
Figure 1. Correlation between structural boron (SB) and germination (a), and SB and protein (b) under shaded conditions across years and across genotypes
tween seed minerals and seed composition, germination, and phomopsis needs further research
4. Conclusions
The current research demonstrated that shade can alter seed constituents by decreasing protein and oleic acid
 (a)
(a)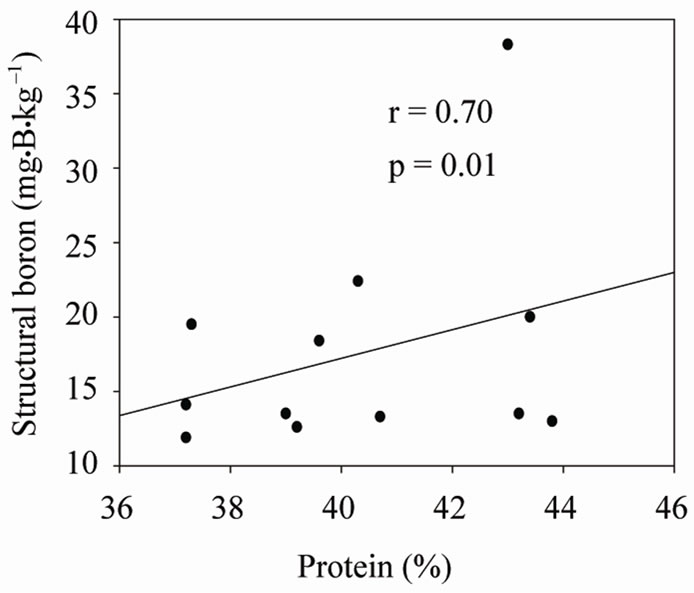 (b)
(b)
Figure 2. Correlation between structural (SB) and germination (a), and SB and protein (b) under unshaded conditions across years and across genotypes.
and increasing oil, linoleic and linolenic acids. The alteration in seed composition by shade may be due to lower light intensity or cooler temperature or both. The lower phomopsis seed infection percentage under shaded than under unshaded conditions could be due to unfavorable conditions for phomopsis infection in shade. Both PI 587982A and PI 603723 (accessions with high seed germination rate under higher temperature conditions) had the highest germination percentages and lowest hardseedness under shaded or under unshaded conditions compared to the poor seed germinations lines. Higher germination and lower hardseedness are desirable traits for selection in soybean breeding program. Except for PI 84976-1, germination rate was higher under shaded than under unshaded conditions, and this may be due to cooler temperatures under shaded conditions. Higher protein and oleic acid under unshaded conditions were accompanied by higher seed Fe, B, and N, and chlorophyll concentrations, and this may be due to higher light intensity under unshaded conditions. The higher structural B percentage under shade than under unshade in PI 80480, PI 84976-1, DSR-3100 RR STS, and Pella 86, and the higher structural B under unshade than in shade in higher germinability lines PI 587982A and PI 603723 may suggest different distribution mechanisms of structural boron exist between genotypes. The positive correlation between germination and structural B signify a possible role of B in seed quality traits.
5. Acknowledgements
We thank Dr. Paul Beuselinck for his significant contribution to the design and discussion of this research. We also thank Sandra Mosley and Philip Handly for lab seed analysis and field management.
REFERENCES
- A. Hou, P. Chen, J. Alloatti, D. Li, L. Mozzoni, B. Zhang and A. Shi, “Genetic Variability of Seed Sugar Content in Worldwide Soybean Germplasm Collections,” Crop Science, Vol. 49, No. 3, 2009, pp. 903-912. doi:10.2135/cropsci2008.05.0256
- R. F. Wilson, “Seed Composition,” In: H. Boerma and J. E. Specht, Eds., Soybeans: Improvement, Production, and Uses, 3rd Edition, ASA, CSSA, and SSSA, Madison, 2004, pp. 621-668.
- J. H. Lee, J. H. Kwon, J. W. Kang, C. H. Park, B. S. Tae and S. W. Kim, “Biodiesel Production from Various Oils under Supercritical Fluid Conditions by Candida antartica Lipase B Using a Stepwise Reaction Method,” Applied Biochemistry and Biotechnology, Vol. 156, No. 1-3, 2009, pp. 24-34. doi:10.1007/s12010-008-8488-5
- L. G. Heatherly, “Early Soybean Production System (ESPS),” In: L. G. Heatherly and H. F. Hodges, Eds., Soybean Production in the Midsouth, CRC Press, Boca Raton, 1999, pp. 103-118.
- L. G. Heatherly, A. Blaine, H. F. Hodges, R. A. Wesley and N. Buehring, “Variety Selection, Planting Date, Row Spacing, and Seeding Rate,” In: L. G. Heatherly and H. F. Hodges, Eds., Soybean Production in the Midsouth, CRC Press, New York, 1999, pp. 41-47.
- A. Mengistu and L. G. Heatherly, “Planting Date, Irrigation, Maturity Group, Year, and Environment Effects on Phomopsis Longicolla, Seed Germination, and Seed Health Rating of Soybean in the Early Soybean Production System of the Midsouthern USA,” Crop Protection, Vol. 25, No. 4, 2006, pp. 310-317. doi:10.1016/j.cropro.2005.05.011
- J. R. Smith, A. Mengistu, R. L. Nelson and R. L. Paris, “Identification of Soybean Accessions with High Germinability in High-Temperature Environments,” Crop Science, Vol. 48, No. 6, 2008, pp. 2279-2288. doi:10.2135/cropsci2008.01.0026
- J. B. Franca Neto, F. C. Krzyzanowski, A. A. Henning, S. H. West and L. C. Miranda, “Soybean Seed Quality as Affected by Shriveling Due to Heat and Drought Stress during Seed Filling,” Seed Science Technology, Vol. 21, 1993, pp. 107-116.
- J. F. Spears, D. M. Tekrony and D. B. Egli, “Temperature during Seed Filling and Soybean Seed Germination and Vigour,” Seed Science Technology, Vol. 25, 1997, pp. 233-244.
- F. I. Erikson and A. S. Whitney, “Effects of Solar Radiation Regimes on Growth and N2 Fixation of Soybean, Cowpea, and Bushbean,” Agronomy Journal, Vol. 76, No. 4, 1984, pp. 529-535. doi:10.2134/agronj1984.00021962007600040006x
- C. Brushoff and L. F. d’Antuono, “Effect of Shading and Nitrogen Application on Yield, Grain Size Distribution and Concentrations of Nitrogen and Water Soluble Carbohydrates in Malting Spring Barley (Hordeum vulgare L.),” European Journal of Agronomy, Vol. 6, No. 3-4, 1997, pp. 275-293. doi:10.1016/S1161-0301(97)00001-4
- S. J. Tabatabaei, M. Yusefi and J. Hajiloo, “Effects of Shading and NO3:NH4 Ratio on the Yield, Quality and N Metabolism in Strawberry,” Scientia Horticulturae, Vol. 116, No. 3, 2008, pp. 264-272. doi:10.1016/j.scienta.2007.12.008
- GRIN, 2011. http://www.ars-grin.gov/cgi-bin/npgs/acc/search.pl?accid=PI+80480 http://www.ars-grin.gov/cgi-bin/npgs/acc/search.pl?accid=PI+84976+-1
- AOAC, “Method 988.05 (1990a),” In: K. Helrich, Ed., Official Methods of Analysis, 15th Edition, The Association of Official Analytical Chemists, Inc., Arlington, 1990.
- AOAC, “Method 920.39 (1990b),” In: K. Helrich, Ed., Official Methods of Analysis, 15th Edition, The Association of Official Analytical Chemists, Inc., Arlington, 1990.
- J. R. Wilcox and R. M. Shibles, “Interrelationships among Seed Quality Attributes in Soybean,” Crop Science, Vol. 41, No. 1, 2001, pp. 11-14. doi:10.2135/cropsci2001.41111x
- E. Boydak, M. Alpaslan, M. Hayta, S. Gercek and M. Simsek, “Seed Composition of Soybeans Grown in the Harran Region of Turkey as Affected by Row Spacing and Irrigation,” Journal of Agricultural and Food Chemistry, Vol. 50, No. 16, 2002, pp. 4718-4720. doi:10.1021/jf0255331
- N. Bellaloui, K. N. Reddy, A. M. Gillen and C. A. Abel, “Nitrogen Metabolism and Seed Composition as Influenced by Foliar Boron Application in Soybean,” Plant and Soil, Vol. 336, No. 1-2, 2010, pp.143-155. doi:10.1007/s11104-010-0455-6
- L. Klepper and R. H. Hageman, “The Occurrence of Nitrate Reductase in Apple Leaves,” Plant Physiology, Vol. 44, No. 1, 1969, pp. 110-114. doi:10.1104/pp.44.1.110
- N. Bellaloui, K. N. Reddy, R. M. Zablotowicz and A. Mengistu, “Simulated Glyphosate Drift Influences Nitrate Assimilation and Nitrogen Fixation in Non-GlyphosateResistant Soybean,” Journal of Agriculture and Food Chemistry, Vol. 54, No. 9, 2006, pp. 3357-3364. doi:10.1021/jf053198l
- G. Lohse, “Microanalytical Azomethine-H Method for Boron Determination in Plant Tissue,” Communications in Soil Science and Plant Analysis, Vol. 13, No. 2, 1982, pp. 127-134. doi:10.1080/00103628209367251
- M. K. John, H. H. Chuah and J. H. Neufeld, “Application of Improved Azomethine-H Method to the Determination of Boron in Soils and Plants,” Analytical Letters, Vol. 8, No. 8, 1975, pp. 559-568. doi:10.1080/00032717508058240
- H. Hu and P. H. Brown, “Localization of Boron in Cell Walls of Squash and Tobacco and Its Association with Pectin. Evidence for a Structural Role of Boron in the Cell Wall,” Plant Physiology, Vol. 105, 1994, pp. 681- 689.
- S. L. Bandemer and P. J. Schaible, “Determination of Iron. A Study of the O-Phenanthrolinemethod,” Industrial and Engineering Chemistry Analytical Edition, Vol. 16, No. 5, 1944, pp. 317-319. doi:10.1021/i560129a013
- R. L. Leoppert and W. P. Inskeep, “Colorimetric Determination of Ferrous Iron and Ferric Iron by the 1,10-Phenanthroline Method,” In: J. M. Bigham, Ed., Methods of Soil Analysis, Soil Science Society of America, Madison, 1996, pp. 659-661.
- J. D. Hiscox and G. F. Israelstam, “A Method for the Extraction of Chlorophyll from Leaf Tissues without Maceration,” Canadian Journal of Botany, Vol. 57, 1979, pp. 1332-1334. doi:10.1139/b79-163
- D. I. Arnon, “Copper Enzymes in Isolated Chloroplasts: Polyphenoloxidase in Beta Vulgaris,” Plant Physiology, Vol. 24, No. 1, 1949, pp. 1-15. doi:10.1104/pp.24.1.1
- AOSA, “Rules for Testing Seeds,” Association of Official Seed Analysts, Las Cruces, 2001.
- AOSA, “Seed Vigor Testing Handbook,” Association of Official Seed Analysts, Las Cruces, 2002.
- SAS, “SAS 9.1 TS Level 1M3, Windows Version 5.1. 2600,” SAS Institute, Cary, 2001.
- J. W. Burton, “Breeding Soybean for Improved Protein Quantity and Quality,” In: R. Shibles, Ed., World Soybean Research Conference III: Proceedings, Westview Press, Boulder, 1984, pp. 361-367.
- L. R. Gibson and R. E. Mullen, “Soybean Seed Quality Reductions by High Day and Night Temperature,” Crop Science, Vol. 36, No. 6, 1996, pp. 1615-1619. doi:10.2135/cropsci1996.0011183X003600060034x
- D. L. Dornbos and R. E. Mullen, “Soybean Seed Protein and Oil Contents and Fatty-Acid Composition Adjustments by Drought and Temperature,” Journal of American Oil Chemists’ Society, Vol. 69, 1992, pp. 228-231.
- J. M. G. Thomas, K. J. Boote, L. H. Allen Jr., M. Gallo-Meagher and J. M. Davis, “Seed Physiology and Metabolism: Elevated Temperature and Carbon Dioxide Effects on Soybean Seed Composition and Transcript Abundance,” Crop Science, Vol. 43, No. 4, 2003, pp. 1548-1557. doi:10.2135/cropsci2003.1548
- N. Bellaloui, J. R. Smith, J. D. Ray and A. M. Gillen, “Effect of Maturity on Seed Composition in the Early Soybean Production System as Measured on Near-Isogenic Soybean Lines,” Crop Science, Vol. 49, No. 2, 2009, pp. 608-620. doi:10.2135/cropsci2008.04.0192
- R. W. Howell and J. L. Cartter, “Physiological Factors Affecting Composition of Soybeans: II. Response of Oil and Other Constituents of Soybeans to Temperature under Controlled Conditions,” Agronomy Journal, Vol. 50, No. 11, 1958, pp. 664-667. doi:10.2134/agronj1958.00021962005000110007x
- B. F. Carver, J. W. Burton, T. E. Carter Jr. and R. F. Wilson, “Response to Environmental Variation of Soybean Lines Selected for Altered Unsaturated Fatty Acid Composition,” Crop Science, Vol. 26, No. 6, 1986, pp. 1176- 1180. doi:10.2135/cropsci1986.0011183X002600060021x
- D. M. Maestri, D. O. Labuckas, J. M. Meriles, A. L. Lamarques, J. A. Zygadlo and C. A. Guzman, “Seed Composition of Soybean Cultivars Evaluated in Different Environmental Regions,” Journal of the Science of Food and Agriculture, Vol. 77, No. 4, 1998, pp. 494-498. doi:10.1002/(SICI)1097-0010(199808)77:4<494::AID-JSFA69>3.0.CO;2-B
- R. Shibles, J. Secor and D. M. Ford, “Carbon Assimilation and Metabolism,” In: J. R. Wilcox, Ed., Soybeans: Improvement, Production, and Uses, ASA, CSSA, and SSSA, Madison, 1987, pp. 535-588.
- I. F. T. Wardlaw, “The Control of Carbon Partitioning in Plants,” New Phytologist, Vol. 116, No. 3, 1990, pp. 341-381.
- J. E. Harper, “Nitrogen Metabolism,” In: J. R. Wilcox, Ed., Soybeans: Improvement, Production, and Uses, ASA, CSSA, and SSSA, Madison, 1987, pp. 497-533.
- R. J. Lawn and W. A. Brun, “Symbiotic Nitrogen Fixation in Soybeans. I. Effect of Photosynthetic Source Sink Manipulations,” Crop Science, Vol. 14, No. 1, 1974, pp. 11-16. doi:10.2135/cropsci1974.0011183X001400010004x
- F. H. Andrade and M. A. Ferreiro, “Reproductive Growth of Maize, Sun-Flower and Soybean at Different Source Levels during Grain Filling,” Field Crops Research, Vol. 48, No. 2-3, 1996, pp. 155-165. doi:10.1016/S0378-4290(96)01017-9
- T. A. T. Wahua and D. A. Miller, “Effects of Shading on the N2-Fixation, Yield, and Plant Composition of FieldGrown Soybeans,” Agronomy Journal, Vol. 70, No. 3, 1978, pp. 387-392. doi:10.2134/agronj1978.00021962007000030006x
- A. Mengistu, L. A. Castlebury, J. R. Smith, J. D. Ray and N. Bellaloui, “Seasonal Progress of Phomopsis longicolla Infection on Soybean Plant Parts and Its Relashionship to Seed Quality,” Plant Disease, Vol. 93, No. 10, 2009, 1009-1018. doi:10.1094/PDIS-93-10-1009
- A. Mengistu, J. R. Smith, N. Bellaloui, R. L. Paris and J. A. Wrather, “Irrigation and Time of Harvest Effects on Evaluation of Selected Soybean Accessions against Phomopsis longicolla,” Crop Science, Vol. 50, No. 5, 2010, pp. 2055-2064. doi:10.2135/cropsci2009.11.0657
- D. M. TeKrony, D. B. Egli, J. Balles, L. Tomes and R. E. Stuckey, “Effect of Date of Harvest Maturity on Soybean Seed Quality and Phomopsis sp. Seed Infection,” Crop Science, Vol. 24, No. 1, 1984, pp. 189-193. doi:10.2135/cropsci1984.0011183X002400010045x
- C. A. Bradley, G. L. Hartman, L. M. Wax and L. W. Pedersen, “Quality of Harvested Seed Associated with Soybean Cultivars and Herbicides under Weed-Free Conditions,” Plant Disease, Vol. 86, No. 9, 2002, pp. 1036- 1042. doi:10.1094/PDIS.2002.86.9.1036
- W. L. Mayhew and C. E. Caviness, “Seed Quality and Yield of Early-Planted, Short-Season Soybean Genotypes,” Agronomy Journal, Vol. 86, No. 1, 1994, pp. 16- 19. doi:10.2134/agronj1994.00021962008600010004x
- W. R. Fehr, C. E. Caviness, D. T. Burmood and J. S. Pennington, “Stage of Development Descriptions for Soybeans, Glycine max (L.) Merr.,” Crop Science, Vol. 11, No. 6, 1971, pp. 929-931. doi:10.2135/cropsci1971.0011183X001100060051x
- D. M. TeKrony, D. B. Egli, J. Balles, L. Tomes and R. E. Stuckey, “Effect of Harvest Maturity on Soybean Seed Quality and Phomopsis sp. Seed Infection,” Crop Science, Vol. 24, No. 1, 1980, pp. 189-193. doi:10.2135/cropsci1984.0011183X002400010045x
- K. W. Roy, B. C. Keith and C. H. Andrews, “Resistance of Hardseeded Soybean Lines to Seed Infection by Phomopsis, Other Fungi, and Soybean Mosaic Viru,” Canadian Journal of Plant Pathology, Vol. 16, No. 2, 1994, pp. 122-128. doi:10.1080/07060669409500769
- T. C. Kilen and E. E. Hartwig, “An Inheritance Study of Impermeable Seed in Soybeans,” Field Crops Research, Vol. 1, 1978, pp. 65-70. doi:10.1016/0378-4290(78)90007-2
- J. W. Mullin and W. Xu, “Study of Soybean Seed Coat Components and Their Relationship to Water Absorption,” Journal of Agriculture and Food Chemistry, Vol. 49, No. 11, 2001, pp. 5331-5335. doi:10.1021/jf010303s
- H. Marschner, “Mineral Nutrition of Higher Plants,” 2nd Edition, Academic Press, San Diego, 1995, pp. 379-396.
- N. Bellaloui, J. E. Hanks, D. K. Fisher and A. Mengistu, “Soybean Seed Composition Is Influenced by WithinField Variability in Soil Nutrients,” Crop Management, 2009.
- N. Bellaloui, J. R. Smith, A. M. Gillen and J. D. Ray, “Effects of Maturity, Genotypic Background, and Temperature on Seed Mineral Composition in Near-Isogenic Soybean Lines in the Early Soybean Production System,” Crop Science, Vol. 51, No. 3, 2011, pp. 1161-1171. doi:10.2135/cropsci2010.04.0187
- B. Rerkasem, R. W. Bell, S. Lodkaew and J. F. Lonergan, “Relationship of Seed Boron Concentration to Germination and Growth of Soybean,” Nutrient Cycling in Agroecosystems, Vol. 48, No. 3, 1997, pp. 217-223. doi:10.1023/A:1009725311624
- C. Dordas, “Foliar Boron Application Improves Seed Set, Seed Yield, and Seed Quality of Alfalfa,” Agronomy Journal, Vol. 98, 2006, pp. 907-913. doi:10.2134/agronj2005.0353
NOTES
*Mention of trade names or commercial products in this publication is solely for the purpose of providing specific information and does not imply recommendation or endorsement by the US Department of Agriculture.
#Corresponding author.