Advances in Computed Tomography
Vol. 2 No. 3 (2013) , Article ID: 37287 , 7 pages DOI:10.4236/act.2013.23021
Microcomputed Tomography Applications in Bone and Mineral Research
1Biomedical Engineering, Indiana University-Purdue University Indianapolis, Indianapolis, USA
2Orthopeadic Surgery, Indiana University School of Medicine, Indianapolis, USA
Email: jmwalla@iupui.edu
Copyright © 2013 Zachary Rart Bart, Joseph Michael Wallace III. This is an open access article distributed under the Creative Commons Attribution License, which permits unrestricted use, distribution, and reproduction in any medium, provided the original work is properly cited.
Received April 30, 2013; revised June 2, 2013; accepted July 1, 2013
Keywords: Bone CT; Mineralization; Vascularization; BMD; Modeling
ABSTRACT
Microcomputed tomography (µCT) has evolved as a development of simple X-ray imaging into an indispensable technique used in both laboratory research and clinical diagnostics. Commercially available systems are capable of creating images at sub-micrometer resolutions to map out the complex web of trabecular bone in small animals, and offer an accurate measurement of bone mineral density for patients at risk of osteoporotic fractures. This review describes the development of µCT, its ability to analyze bone, and how it can be used alongside other clinical and laboratory techniques. µCT offers a non-destructive alternative for imaging mineralized tissues with no required preparation and can also be utilized with living specimen to track skeletal development.
1. Introduction
There is often much to gain by redesigning and refitting technology for use in other disciplines. Radiographic imaging was first developed in the late 1800’s, and has evolved from its original state of X-ray imaging to include several techniques that can be used in a variety of clinical and scientific arenas [1-3]. The early stages of X-ray research were driven by developing light sources used to image a sample. A typical radiograph image in the body is produced due to differences in the attenuation coefficient of materials with which the X-rays interact (e.g. materials like bone, metal, or ceramics can better attenuate X-rays relative to soft tissues or polymer-based materials [4]). This difference in material density creates the quintessential X-ray image that most people would recognize from a visit to a hospital.
The advent of the modern computer processor in the 1960s allowed for the creation of a new technique known as computed tomography (CT) in 1972 [5]. CT is credited to Godfrey Hounsfield, an English engineer working for EMI Ltd, a company now known primarily as a prominent record label [6,7]. This invention led to Hounsfield being awarded the Nobel Prize for Medicine alongside physicist Allan Cromack in 1979 for their efforts in developing this technology. Initial limitations of CT were the cost and physical size of the necessary equipment, making the technology impractical for most laboratory settings. Fortunately, the technology quickly evolved. During the early 1980s, several micro-CT (µCT) scanners were created utilizing smaller, bench-top X-ray sources. This advancement made the technology accessible to many more researchers. Another novel method, synchrotron radiation, also came into use at this time and was utilized to some extent [8]. While synchrotron sources are capable of easily reaching sub-micrometer (µm) resolutions, the limited availability of suitable synchrotron sources has greatly slowed growth in this area. Over the last three decades, the use of µCT has grown exponentially in scientific studies, showing how the proliferation of the technology has made it more readily available to researchers. This exponential growth can be seen in Figure 1, showing both the number of general CT studies as well as ones directly related to analyzing bone samples.
Today, much of the research driving µCT development is moving towards improved resolutions for in vivo imaging of small animals and ex vivo scanning of tissues for utilization in experiments related to fields that study disease, organ structure, and drug treatments [9-12]. The first CT scans produced compelling results, giving im-
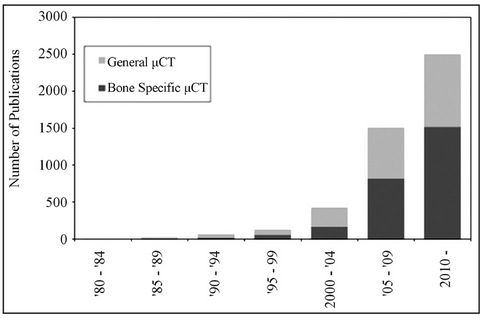
Figure 1. Studies involving the use of µCT technology. The above graph was created by performing a literature search for keywords “micro CT” and “micro CT bone” within the PubMed journal archives.
ages containing an 80 × 80 matrix of 3 mm × 3 mm × 13 mm voxel images of a patient’s brain [7]. A voxel represents a volume unit of material, similar to how pixels represent unit surfaces. This imaging technique was of great use for creating maps for surgeons to locate tumorous regions prior to surgery [13]. Moving forward, the technique has been refined, improved and adapted to be used in other parts of the body. Current bench-top systems utilizing X-ray sources can create images on the scale of several µm voxel size to just under the 1 µm level [14], which allows researchers to look at some of the smallest structures within a body.
2. Basic Operation
Details of the physical operation of a µCT could occupy a full chapter in a book. Without going into too much depth, the simplest form of a µCT scanner consists of four major components: an X-ray source, a device to convert X-ray signals into light, a stage to hold the specimen, and a mechanism to either rotate the specimen or the scanning array itself. There are several ways to arrange these parts, but the general form is used to accomplish the following. A thin X-ray beam is passed through a specimen onto a detector where the image is captured. This image is created by measuring the scattered X-ray signals and reconstructing it into a single image showing how the light was impeded by the specimen being scanned. The specimen or scanning array is then rotated by a defined angular increment and another image is captured. This process is repeated until images have been captured for every angle step around the sample. The images are then reconstructed by software capable of converting this set of X-ray images into a series of slices determined by the voxel dimensions. A variety of analytical techniques can then be applied to the resulting data set.
The capabilities of a scanner are strongly influenced by the power of the X-ray source and the ability to accurately convert X-rays into light. Current X-ray sources provide power levels ranging from 10 - 100 kVp, limiting their maximum power to 100 keV [15]. A source with higher power requires shorter exposure times and could increase spatial resolution. Efficiency losses in the conversion process can also lead to degraded image results [16].
3. Bone Specific Applications of µCT
3.1. Bone Biology
As with simple X-ray radiography, CT acquisition serves as an excellent method to image bone structures in the body. An understanding of the macrostructure and organization of bone at the tissue level gives good insight into how clinical CT scans can be useful for studying bones. Bone itself is a hierarchical structure, with different organizational patterns at the nano, micro, and macro scales (Figure 2).
At the largest length scales, there are two types of bone structure: trabecular and cortical bone. Cortical or compact bone largely makes up the shaft of each long bone and forms a protective shell around the ends of long bones and vertebral bodies in the spine. It serves as a major contributor to supporting loads that are transmitted through the shaft of long bones like the femur (thigh) or humerus (upper arm). Trabecular or cancellous bone has a different structure when compared to cortical bone, but still serves vital purposes. Unlike the compacted cortical bone, trabeculae create a web of small filaments interwoven inside a cortical shell, typically at the ends of long bones. This porous web serves to reinforce these vital
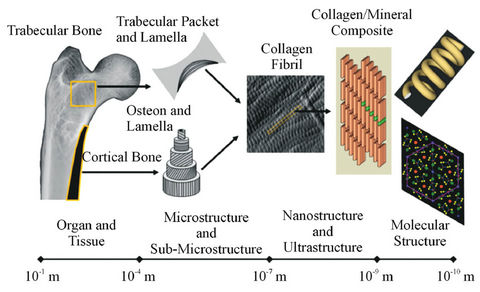
Figure 2. Bone exists as a multi-level material. Each level of structure is organized in a different fashion from the one above it. Study of trabecular and cortical structures through µCT provides insight into the larger scale structural properties while smaller scales require different techniques to see how single molecules are organized in the tissue. Image used with permission from: D.B. Burr and M.A. Allen (Eds.), “Basic and Applied Bone Biology,” Elsevier.
areas without greatly increasing the mass of the bone in doing so. Trabecular bone is also important for the other major roles that bone plays in the body (i.e. mineral ion homeostasis and hematopoiesis). The net result is that the volume occupied by bone relative to the total volume in trabecular regions is much smaller when compared to the cortical structure (porosity of 80% - 85% in trabeculae vs. 2% - 5% in cortical bone) [17-19].
From an imaging standpoint, trabecular dimensions can easily be 10 times smaller than the thickness of the cortical shell (Figure 3), which can range from 5 - 8 mm in humans [20], and as small as 0.2 mm in healthy mice aged 8 - 11 weeks. [21]. In humans this may not seem like such a small filament, but when considering rodent models, the need for high resolution scans readily becomes apparent. For smaller mammals such as dogs or mice, typical imaging studies have been performed with resolutions on the scale of 5 - 15 microns [22], typically fine enough to obtain structural information from trabecular regions.
Apart from reduced resolution alias artifacts, the imaging process itself can alter the image that is obtained due to imperfections in the scanning process. Two common flaws are ring artifacts, and beam hardening. Ring artifacts can occur from conditions such as having too much dust on the detector system or damaged pixels within the camera capturing the image [23]. Beam hardening is a different effect caused by ideal assumptions not holding true with a real sample. As X-rays pass through a bone, some of the energy of the photon is absorbed and is not passed through to the detector. While this is how X-ray images are obtained, this is also how beam hardening occurs. A typical µCT image is created by using a polychromatic spectrum of energy. Ideally, the energy absorbed by the sample would be the same throughout the spectrum. However, it has been shown that the lower energies are absorbed more by samples, essentially filtering the lower energy levels [24]. This
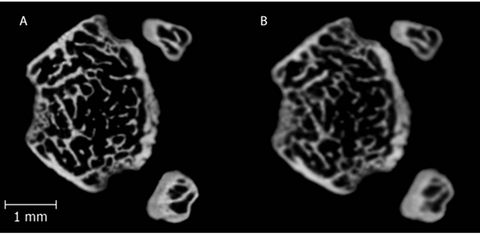
Figure 3. A single left mouse femur scanned at (A) 8 µm and (B) 12 µm isotropic voxel resolution in a region 0.5 mm superior to the distal epiphyseal plate. The cortical shell is clear in both images, but increasing resolution exposes additional, smaller trabecular fibers that would not be detected by the lower resolution image.
filtering causes the spectrum passed to the detector to be more heavily weighted by the higher energy end of the spectrum, creating the beam hardening effect. This effect can be lessened by using filters (e.g. 0.1 mm foils of Aluminum or Copper), before the sample or through software manipulation of the images to restore the balance of lower energy photons to the image [25]. Aside from lessening unavoidable artifacts, other problems can arise from metals absorbing too much energy, thus warping the image. In addition, sample slippage can cause severe alignment issues. While these problems can and do exist, care can be taken to minimize unwanted effects to produce high quality images for quantitative analysis.
3.2. µCT Measurements
Analysis of the captured images produces several variables related to the structure of the bone. Measurements directly related to cortical bone include the cortical area, average cortical thickness, total cross-sectional area, and cortical bone volume fraction (BV/TV). Additionally, general geometric measurements like width, diameter and thickness also give information used to calculate material properties. Area moment of inertia at a given location in the bone can be used to normalize whole bone structural properties from bending tests to obtain material-level properties which are independent of the size/shape of the bone [26,27]. This CT data set can be used to standardize variables like toughness or stiffness to BV/TV [28]. If a reference material is used during scanning, it is possible to measure the volumetric bone mineral density (vBMD) of a cross section, typically calculated in Hounsfield units. Reference materials of known mineral density then allow the user to convert these Hounsfield units into units of mass per unit volume (e.g. g/cm3).
Calculation and measurements taken from the cortical envelope also give valuable structural information about the bone. Different mineralization patterns within a bone can create a higher BMD in particular regions, showing how the material can change as a function of location along the length of the bone [29]. In vivo studies of these surfaces can show growth or adaptation over time in an animal without requiring the use of fluorochrome injections to track bone formation [30]. These types of studies are generally limited to two discrete time points in order to reduce the amount of radiation an animal must experience [31]. Scans done on anesthetized animals typically suffer from poor resolution in order to include the entire skeleton. While it is possible to image whole skeletons at better resolutions, the size of the animals would greatly increase the amount of time required to obtain highly detailed images. Longer scans like these can lead to excessive radiation exposure, arresting skeletal development. Additionally, it is possible to track the progression of damage induced to a bone. Imaging done before and after small deformation tests can be used to show the propagation of small cracks through bones, but requires higher resolution scans to track smaller cracks [32]. For trabecular regions in the bone, BV/TV is considerably lower due to the web structure. Measurements such as the BV/TV or the surface density of the trabeculae (BS/TV) can be directly measured from the images. Further analysis of trabecular structure includes counting the total number of trabeculae (Tb. N) as well as their thickness (Tb. Th) and the separation (Tb. Sp) between each filament in the web (Table 1). These values are all derived from an ideal model that assumes the trabecular structure takes on either a rodlike or platelike structure [23]. Idealized rods or cones represent the two ends of the Structure Model Index (SMI), a scale used to generalize the complex trabecular shape into something that can be more easily modeled. Actual trabecular filaments fall somewhere between these two geometric extremes, but the ratio of the models existing within a region of interest can give some idea as to what the general structure is within the trabecular region. These measured and derived variables can be used to evaluate the overall health of the specimen’s bones to analyze the progression of a disease state.
4. Applications
In medicine, bone health is evaluated primarily as a means to track growth, detect fractures, and look for signs of degenerative bone diseases. While fractures and growth can typically be seen with standard X-rays, early detection of degenerative diseases can require more rigorous imaging. Several techniques exist to accomplish this, and do so with varying degrees of accuracy. Detection of osteoporosis is often done through a measure of BMD after a fracture has occurred [33]. Patients with known risk factors are also assessed in order to have a baseline BMD prior to receiving pharmaceutical interventions (e.g. bisphosphonates or teriparatide) [34]. Dual-Energy X-ray Absorptiometry (DEXA) is a technique created in the late 1980’s [35] that is capable of measuring BMD in the clinical arena. However, it is only capable of performing areal analysis of BMD, limiting its usefulness in evaluating the whole bone [36]. This weakness is due to a proportional link between mineral content and total bone area. DEXA relies on a projected area to calculate BMD, so there are often size-related artifacts [37]. Misinterpretation of these data can cause misdiagnosis of osteoporosis in any patients with a smaller skeletal structure, especially children [38]. Another technique, Peripheral Quantitative Computed Tomography (pQCT) exists as a clinical application of CT scanners [39]. pQCT is capable of performing volumetric BMD analysis of extremities to better detect signs of osteoporosis, but does so at lower resolutions than a traditional µCT [40].
Orthopaedic research as a field is spanned by multiple disciplines, included but not limited to biology, mechanical engineering, tissue engineering, biomedical engineering, and cell mechanics. µCT can be utilized for bone imaging to some extent for research within all of these fields. While imaging a single bone may be useful for mechanical testing purposes, imaging an entire animal can show skeletal growth as a whole. Single bone imaging as shown in Figure 3 can demonstrate how a disease state can perturb the whole bone structure. In comparison, whole animal imaging can be done at multiple time points to track how a disease affects overall growth of the entire skeleton [41]. The major limiting factor for doing this is a loss in resolution due to a larger scanning field. A secondary concern for research as well as clinical applications is the radiation exposure experienced by the patient or specimen. For humans, a typical chest X-ray has radiation exposure at 1 - 25 mSv [42] (1 Sv = 1 Gy), while a full body CT scan can range from 5 - 15 mSv [43]. However, DEXA and pQCT techniques only have exposures of 2.5 µSv and 0.3 - 1 mSv respectively [44]. Comparatively, in vivo µCT for mice specimens is as low as 0.4 - 1 mSv for a given full body in vivo scan [15].
Imaging bone is not necessarily limited to the mineralized structure. Within each bone exists a complex network of blood vessels that provide support to surround-
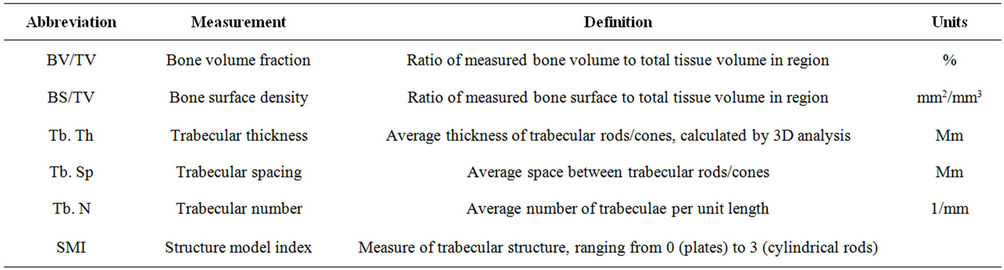
Table 1. List of common measurements and their associated descriptions taken from orthopaedic µCT scan.
ing tissues. Smaller capillaries in bone carry preosteoblast and preosteoclast cells [45] that proliferate to drive remodeling. Using injections of barium sulfate (BaSO4), it has been shown that mapping the previously unseen blood vessels within the mineralized structure is possible [46]. BaSO4 is a heavy metal compound that strongly absorbs X-rays, appearing bright white in a CT image, but is generally safe as it has very low solubility in the body. It is also commonly used for gastrointestinal diagnostics, creating a bright map of a patient’s intestines. Understanding this vasculature may provide more insight into what drives the process of bone remodeling.
In tissue engineering of musculoskeletal tissues, research efforts are often targeted towards creating a tissue scaffold in vitro to be implanted to replace or repair damaged or missing tissues in vivo. Included in this are scaffolds that attempt to create mineralized growths inside a polymer structure [47]. When imaged, the attenuation due to the polymer is negligible compared with mineral, effectively removing it from the image. This feature allows researchers to monitoring how the mineralized scaffold changes over time to determine when it would be feasible to be utilized as an implantable material or how that material is being remodeled and broken down. Often times when performing a bone study, it is necessary to destroy a sample during large-scale mechanical testing. While these tests provide insight into material properties, there are other, less destructive tests that could potentially produce relevant results. CT mapping can be utilized to a great extent to create three-dimensional models (Figure 4) for finite element analysis (FEA) packages such as ANSYS or COMSOL [48]. The images can be imported into the software and used to create a three-dimensional model that is then subjected to theoretically relevant loading conditions. However, bone is not homogeneous as both the material and structural properties vary as a function of location in the bone [49]. In typical engineering materials, elastic modulus shows the material’s ability to resist deformation, and is a measure of material strength in general. FEA packages can

Figure 4. Pictured here is a right tibia and fibula from a mouse, imaged using a µCT scanner, reconstructed, and reformed into a three-dimensional image. This is actually a collection of several hundred images stacked together to form a single structure that can be analyzed in various ways with modeling software packages.
use this value to predict how a structure might deform when subjected to arbitrary forces. While estimates of elastic modulus can be made from the literature, coupling this modeling with a non-destructive test for modulus allows for more accurate calculations to be made.
5. Future Directions/Technologies
Similar to the consumer digital camera market, the main factore driving CT development is to create images faster, and with higher resolutions [14]. Synchrotron radiation sources can serve this purpose, as they can deliver twice as much energy as a standard X-ray source [50]. However, the need for a dedicated facility containing a largescale particle accelerator to create this synchrotron beam has severely limited its availability. While these sources have shown imaging potential below the 1 µm threshold [8], the proliferation of this technique has been slow. In addition, other non-synchrotron based CT systems (Phoenix Nanotom S from GE, SkyScan 2011 Nano-CT from Bruker) are now capable of obtaining resolutions below 500 nm (closer to 150 nm voxel sizes in some cases). These new system are able to achieve such high resolutions due to advances in increasing the energy output of the main limiting factor in CT, the X-ray source. While there are other small things that can be done to enhance resolution, some amount of energy will always be absorbed by the specimen being tested and the walls of the cabinet. Current existing light sensors are already highly efficient, reducing the chances of improving the latter aspects of CT design.
Other growing technologies could open new avenues for µCT uses in bone studies. Transcutaneous micro scale indentation has recently become possible through new clinical testing techniques [51,52]. Measurements taken from such a device could theoretically be used along with CT to create better physiological models of a bone under loading conditions. This could reduce the number of animals required for scientific studies, or potentially create new clinical measures to quantify bone health or diagnose disease which are superior to areal bone mineral density.
Computed tomography still possesses considerable room to grow in the ever-widening scientific community. While radiology has existed for well over a century, CT imaging has continuously shown advancement in the field since its inception. µCT, and the emerging nano-CT provide great insight into the structure, development, and growth of not only bones, but all tissues within the human body. This field will continue to grow and will be utilized far into the future.
REFERENCES
- C. Gauthier, O., et al., “In Vivo Bone Regeneration with Injectable Calcium Phosphate Biomaterial: A Three-Dimensional Micro-Computed Tomographic, Biomechanical and SEM Study,” Biomaterials, Vol. 26, No. 27, 2005, pp. 5444-5453. doi:10.1016/j.biomaterials.2005.01.072
- D. B. Chaffin, et al., “Lumbar Muscle Size and Locations from CT Scans of 96 Women of Age 40 to 63 Years,” Clinical Biomechanics, Vol. 5, No. 1, 1990, pp. 9-16. doi:10.1016/0268-0033(90)90026-3
- E. M. Braunstein, et al., “Computed Tomography and Plain Radiography in Experimental Fracture Healing,” Skeletal Radiology, Vol. 15, No. 1, 1986, pp. 27-31. doi:10.1007/BF00355070
- G. W. Grodstein, “X-Ray Attenuation Coefficients from 10 keV to 100 MeV,” DTIC Document, 1957.
- G. N. Hounsfield, “Computerized Transverse Axial Scanning (Tomography): Part 1. Description of System,” British Journal of Radiology, Vol. 46, No. 552, 1973, pp. 1016-1022. doi:10.1259/0007-1285-46-552-1016
- C. A. Bartlett, “EMI and the CT Scanner,” Harvard Business School Case 383-194, Boston, 1983.
- E. C. Beckmann, “CT Scanning the Early Days,” British Journal of Radiology, Vol. 79, No. 937, 2006, pp. 5-8. doi:10.1259/bjr/29444122
- D. Bowen, et al. “X-Ray Microtomography with Synchrotron Radiation,” Proceedings of SPIE X-Ray Imaging II, San Diego, 12 August 1986. doi:10.1117/12.936625
- S. M. Jorgensen, O. Demirkaya and E. L. Ritman, “Threedimensional Imaging of Vasculature and Parenchyma in Intact Rodent Organs with X-Ray Micro-CT,” American Journal of Physiology-Heart and Circulatory Physiology, Vol. 275, No. 3, 1998, pp. H1103-H1114.
- R. Guldberg, et al., “Analyzing Bone, Blood Vessels, and Biomaterials with Microcomputed Tomography,” Engineering in Medicine and Biology Magazine, Vol. 22, No. 5, 2003, pp. 77-83. doi:10.1109/MEMB.2003.1256276
- X. Yao, et al., “Gender-Dependence of Bone Structure and Properties in Adult Osteogenesis Imperfecta Murine Model,” Annals of Biomedical Engineering, Vol. 41, No. 6, 2013, pp. 1-11.
- M. Ding, et al., “Canine Cancellous Bone Microarchitecture after One Year of High-Dose bisphosPhonates,” Calcified Tissue International, Vol. 72, No. 6, 2003, pp. 737- 744. doi:10.1007/s00223-002-2066-6
- L. D. Lunsford, A. E. Rosenbaum and J. Perry, “Stereotactic Surgery Using the ‘Therapeutic’ CT Scanner,” Surgical Neurology, Vol. 18, No. 2, 1982, pp. 116-122. doi:10.1016/0090-3019(82)90369-X
- E. L. Ritman, “Micro-Computed Tomography-Current Status and Developments,” Annual Review of Biomedical Engineering, Vol. 6, 2004, pp. 185-208. doi:10.1146/annurev.bioeng.6.040803.140130
- J. M. Boone, O. Velazquez and S. R. Cherry, “SmallAnimal X-Ray Dose from Micro-CT,” Official Journal of the Society for Molecular Imaging, Vol. 3, No. 3, 2004, p. 149.
- J. Hsieh, “Computed Tomography: Principles, Design, Artifacts, and Recent Advances,” SPIE Press, Bellingham, 2009.
- J. Gong, J. Arnold and S. Cohn, “Composition of Trabecular and Cortical Bone,” The Anatomical Record, Vol. 149, No. 3, 1964, pp. 325-331. doi:10.1002/ar.1091490303
- P. Roschger, et al., “Alendronate Increases Degree and Uniformity of Mineralization in Cancellous Bone and Decreases the Porosity in Cortical Bone of Osteoporotic women,” Bone, Vol. 29, No. 2, 2001, pp. 185-191. doi:10.1016/S8756-3282(01)00485-9
- R. Müller, et al., “Morphometric Analysis of Human Bone Biopsies: A Quantitative Structural Comparison of Histological Sections and Micro-Computed Tomography,” Bone, Vol. 23, No. 1, 1998, p. 59. doi:10.1016/S8756-3282(98)00068-4
- P. Zioupos and J. Currey, “Changes in the Stiffness, Strength, and Toughness of Human Cortical Bone with Age,” Bone, Vol. 22, No. 1, 1998, pp. 57-66. doi:10.1016/S8756-3282(97)00228-7
- T. Kohler, et al., “Compartmental Bone Morphometry in the Mouse Femur: Reproducibility and Resolution Dependence of Microtomographic Measurements,” Calcified Tissue International, Vol. 77, No. 5, 2005, pp. 281-290. doi:10.1007/s00223-005-0039-2
- M. J. Paulus, et al., “High Resolution X-Ray Computed Tomography: An Emerging Tool for Small Animal Cancer Research,” Neoplasia (New York), Vol. 2, No. 1-2, 2000, p. 62.
- C. H. Turner and D. B. Burr, “Basic Biomechanical Measurements of Bone: A Tutorial,” Bone, Vol. 14, No. 4, 1993, pp. 595-608. doi:10.1016/8756-3282(93)90081-K
- M. L. Bouxsein, et al., “Guidelines for Assessment of Bone Microstructure in Rodents Using Micro-Computed Tomography,” Journal of Bone and Mineral Research, Vol. 25, No. 7, 2010, pp. 1468-1486. doi:10.1002/jbmr.141
- J. Hsieh, et al., “An Iterative Approach to the Beam Hardening Correction in Cone Beam CT,” Medical Physics, Vol. 27, 2000, p. 23.
- R. J. Jennings, “A Method for Comparing Beam-Hardening Filter Materials for Diagnostic Radiology,” Medical physics, Vol. 15, 1988, p. 588.
- S. A. Goldstein, R. Goulet and D. McCubbrey, “Measurement and Significance of Three-Dimensional Architecture to the Mechanical Integrity of Trabecular Bone,” Calcified Tissue International, Vol. 53, 1993, pp. 127- 133. doi:10.1007/BF01673421
- J. E. M. Brouwers, B. van Rietbergen and R. Huiskes, “No Effects of in Vivo Micro-CT Radiation on Structural Parameters and Bone Marrow Cells in Proximal Tibia of Wistar Rats Detected after Eight Weekly Scans,” Journal of Orthopaedic Research, Vol. 25, No. 10, 2007, pp. 1325-1332. doi:10.1002/jor.20439
- J. Waarsing, et al., “Detecting and Tracking Local Changes in the Tibiae of Individual Rats: A Novel Method to Analyse Longitudinal in Vivo Micro-CT Data,” Bone, Vol. 34, No. 1, 2004, pp. 163-169. doi:10.1016/j.bone.2003.08.012
- J. Day, et al., “Bisphosphonate Treatment Affects trAbecular Bone Apparent Modulus through Micro-Architecture Rather Than Matrix Properties,” Journal of Orthopaedic Research, Vol. 22, No. 3, 2004, pp. 465-471. doi:10.1016/j.orthres.2003.05.001
- J. M. Wallace, et al., “The Mechanical Phenotype of Biglycan-Deficient Mice Is Boneand Gender-Specific,” Bone, Vol. 39, No. 1, 2006, pp. 106-116. doi:10.1016/j.bone.2005.12.081
- E. Ferrié, et al., “Fatigue Crack Propagation: In Situ Visualization Using X-Ray Microtomography and 3D Simulation Using the Extended Finite Element Method,” Acta Materialia, Vol. 54, No. 4, 2006, pp. 1111-1122. doi:10.1016/j.actamat.2005.10.053
- J. Damilakis, et al., “Radiation Exposure in X-Ray-Based Imaging Techniques Used in Osteoporosis,” European Radiology, Vol. 20, No. 11, 2010, pp. 2707-2714. doi:10.1007/s00330-010-1845-0
- S. M. Cadarette, et al., “Development and Validation of the Osteoporosis Risk Assessment Instrument to facilitate Selection of Women for Bone Densitometry,” Canadian Medical Association Journal, Vol. 162, No. 9, 2000. pp. 1289-1294.
- J. Haarbo, et al., “Validation of Body Composition by Dual Energy X-Ray Absorptiometry (DEXA),” Clinical Physiology (Oxford, England), Vol. 11, No. 4, 1991. pp. 331. doi:10.1111/j.1475-097X.1991.tb00662.x
- T. Lang, et al., “Volumetric Quantitative Computed Tomography of the Proximal Femur: Precision and Relation to Bone Strength,” Bone, Vol. 21, No. 1, 1997, pp. 101- 108. doi:10.1016/S8756-3282(97)00072-0
- A. Prentice, T. J. Parsons and T. J. Cole, “Uncritical Use of Bone Mineral Density in Absorptiometry May Lead to Size-Related Artifacts in the Identification of Bone Mineral Determinants,” The American Journal of Clinical Nutrition, Vol. 60, No. 6, 1994, pp. 837-842.
- R. I. Gafni and J. Baron, “Overdiagnosis of Osteoporosis in Children Due to Misinterpretation of Dual-Energy X-Ray Absorptiometry (DEXA),” The Journal of Pediatrics, Vol. 144, No. 2, 2004, pp. 253-257. doi:10.1016/j.jpeds.2003.08.054
- A. Muller, E. Ruegsegger and P. Ruegsegger, “Peripheral QCT: A Low-Risk Procedure to Identify Women Predisposed to Osteoporosis,” Physics in Medicine and Biology, Vol. 34, No. 6, 1989, p. 741. doi:10.1088/0031-9155/34/6/009
- J. A. Gasser, “Assessing Bone Quantity by pQCT,” Bone, Vol. 17, No. 4, 1995, pp. S145-S154. doi:10.1016/8756-3282(95)00287-N
- R. E. Guldberg, et al., “Microcomputed Tomography Imaging of Skeletal Development and Growth,” Birth Defects Research Part C: Embryo Today: Reviews, Vol. 72, No. 3, 2004, pp. 250-259. doi:10.1002/bdrc.20016
- J. R. Mayo, J. Aldrich and N. L. Müller, “Radiation Exposure at Chest CT: A Statement of the Fleischner Society,” Radiology, Vol. 228, No. 1, 2003, pp. 15-21. doi:10.1148/radiol.2281020874
- D. J. Brenner and C. D. Elliston, “Estimated Radiation Risks Potentially Associated with Full-Body CT Screening,” Radiology, Vol. 232, No. 3, 2004, pp. 735-738. doi:10.1148/radiol.2323031095
- W. Huda and R. Morin, “Patient Doses in Bone Mineral Densitometry,” British Journal of Radiology, Vol. 69, No. 821, 1996, pp. 422-425. doi:10.1259/0007-1285-69-821-422
- M.-H. Lafage-Proust, et al., “Bone Vascularization and Remodeling,” Joint Bone Spine, Vol. 77, No. 6, 2010, pp. 521-524. doi:10.1016/j.jbspin.2010.09.009
- B. Roche, et al., “Structure and Quantification of Microvascularisation within Mouse Long Bones: What and How Should We Measure? Bone, Vol. 50, No. 1, 2012, pp. 390-399. doi:10.1016/j.bone.2011.09.051
- S. H. Cartmell, et al., “Effects of Medium Perfusion Rate on Cell-Seeded Three-Dimensional Bone Constructs in Vitro,” Tissue Engineering, Vol. 9, No. 6, 2003, pp. 1197- 1203. doi:10.1089/10763270360728107
- S. J. Shefelbine, et al., “Prediction of Fracture Callus Mechanical Properties Using Micro-CT Images and Voxel-Based Finite Element Analysis,” Bone, Vol. 36, No. 3, 2005, pp. 480-488. doi:10.1016/j.bone.2004.11.007
- D. C. Wirtz, et al., “Critical Evaluation of Known Bone Material Properties to Realize Anisotropic FE-Simulation of the Proximal Femur,” Journal of Biomechanics, Vol. 33, No. 10, 2000, pp. 1325-1330. doi:10.1016/S0021-9290(00)00069-5
- C. Hall, et al., “Synchrotron Energy-Dispersive X-Ray Diffraction Tomography,” Nuclear Instruments and Methods in Physics Research Section B: Beam Interactions with Materials and Atoms, Vol. 140, No. 1, 1998, pp. 253-257. doi:10.1016/S0168-583X(97)00994-4
- Y. Y. Ding, et al., “Validation of BioDent TDI as a New Clinical Diagnostic Method,” Advanced Materials Research, Vol. 275, 2011, pp. 151-154. doi:10.4028/www.scientific.net/AMR.275.151
- A. Diez-Perez, et al., “Microindentation for in Vivo Measurement of Bone Tissue Mechanical Properties in Humans,” Journal of Bone and Mineral Research, Vol. 25, No. 8, 2010, pp. 1877-1885. doi:10.1002/jbmr.73