American Journal of Climate Change
Vol.05 No.02(2016), Article ID:67599,16 pages
10.4236/ajcc.2016.52020
Trends and Geostatistical Interpolation of Spatio-Temporal Variability of Precipitation in Northern Cameroon
Elisabeth Fita Dassou1*, Auguste Ombolo2, Steven Chouto3, Guillaume Ewodo Mboudou2, Jean Marcel Abate Essi4, Etienne Bineli2
1Department of Climatology, Hydrology and Pedology, Higher Institute of Sahel, University of Maroua, Maroua, Cameroon
2Department of Hydraulics and Water Management, Higher Institute of Sahel, University of Maroua, Maroua, Cameroon
3Department of Environmental Sciences, Higher Institute of Sahel, University of Maroua, Maroua, Cameroon
4Institute for Geological and Mining Research (IRGM), Center for Geological and Mining Research, Garoua, Cameroon

Copyright © 2016 by authors and Scientific Research Publishing Inc.
This work is licensed under the Creative Commons Attribution International License (CC BY).
http://creativecommons.org/licenses/by/4.0/


Received 10 February 2016; accepted 17 June 2016; published 22 June 2016
ABSTRACT
This paper examines the spatial and temporal variability of the mean annual precipitation in the Northern Cameroon on the context of climate change during the time period 1950-2013. The study used homogeneous monthly and annual precipitations database of twenty-five stations located in the Northern Cameroon and Southern Chad Republic. Geostatisticals interpolation methods (Kriging and Inverse Distance Weighting method) associated with Digital Elevation Model were used to establish the spatial distribution of annuals precipitations. The non-parametric Mann- Kendall test and Sen’s slope method were performed to determine respectively trend and magnitude. The result indicates a spatial distribution of precipitation mainly determined by the topography and the geography of the study area. The trend analysis shows a decrease of annual average precipitation across the Northern Cameroon at a rate of −0.568 mm/year over the time period 1950-2013. The magnitude of decreasing trends ranged between 0.11 and 3.92 mm/year. Statistically significant decreasing trends at the 95% level of confidence were noted at 10% while 5% of stations showed statistically significant increasing. However, 60% of stations indicate a decreasing trend. Monthly analysis of rainfall shows a decreasing trend during June and September while July and August present an increasing trend.
Keywords:
Precipitation, Kriging, Inverse Distance Weighting, Mann-Kendall Test, Trends, Northern Cameroon

1. Introduction
The study of rainfall variability in space and time is important and pertinent for sustainable management of water resources and future development in the context of climate change. Several studies have been carried out by researchers around the world and particularly in Africa [1] - [4] . According to [5] , the sub-Saharan Africa was the most affected by hydro-climatic variability these last decades compared to other regions of the world. This variability is one of the most relevant characteristics of Sahelian regions [4] .
Recent studies have analyzed the variability of precipitation in Northern Cameroon [6] - [12] . [13] reported that for this last three decades, this area has been subject to many fluctuations in rainfall regimes over time. Changes in annual rainfall have been analyzed by [6] using Pettit test and principal component analysis. The study conducted by [14] showed that this part of Cameroon was the most vulnerable to extreme hydrological events such as floods and droughts. Therefore, there is growing awareness about extreme events particularly floods events describe by [11] . [9] shows that this zone which belongs to the Sudano-Sahelian climate is a fragile region with vulnerable water resources. In addition, socials and economics activities like agriculture and livestock are largely depending on climate [15] particularly on the amount of precipitation. Associated with global warming, the implication of these changes will be particularly significant for this region already under stress [5] .
Recent studies applied geostatisticals analysis in spatial interpolation and in precipitation trends research for mapping rainfall data [16] - [18] . [19] demonstrated the convenience of performing geostatistical analysis for mapping rainfall data in different geographical locations. Geostatistical methods of interpolation, such as Kriging or Inverse Distance Weighting (IDW), have been applied to describe changes in magnitude. These methods offer a good approach to the spatial distribution of magnitude of change, but provide no information on their significance [16] .
Some applications such as hydrological modeling require precipitation data that are spatially continuous [20] . As suggested by [16] , Kriging method is a true interpolation technique and is found to be the optimal scheme for irregularly spaced rainfall data. Associated with Digital Elevation Model (DEM), the result seems to be more optimal and least biased according to [20] . These methods of association with DEM help to understand the physical relationships between precipitation data, geographic and topographic variables, and the spatial correlation between the information recorded at the rainfall station.
In spite of several studies to examine the precipitation trends in Northern Cameroon during the last decades, no comprehensive research was conducted to understand the spatio-temporal variability of precipitation by using geostatistical analysis and Mann-Kendall statistic test. The estimation of the spatial distribution of rainfall data remains an important part of studies helping to understand climate change and its effects on water resources [21] .
The aim of this paper is to understand the spatial and temporal variability of rainfall in the Northern part of Cameroon during the period of 1950-2013 by using geostatistical analysis, local interpolation and statistics tests. We used in this study Kriging and Inverse Distance Weighting methods associated with Mann-Kendall and Sen’s slope estimator to overview the spatio-temporal variability of rainfall in this part of Cameroon under stress.
2. Study Area and Data
2.1. Study Area
The study area (Figure 1) is the Northern part of Cameroon. It is located between the latitude 6˚N and 13˚N and between longitude 11˚E and 16˚E and covers three administrative regions (Far North, North and Adamaoua). It shares its boundaries with Nigeria, Central African Republic and Chad Republic.
Based on the topography, the elevation ranges from 95 to about 2374 m with a much contrasted relief. It can be divided into three main units:

Figure 1. Location of the studied area.
- The hilly regions which is characterized by the Mandara and Alantika Mountains. The elevation ranges between 900 - 1885 m;
- The Adamawa plateau (around 1100 m) in the southern part of the region which is surrounded by volcanic mountains reaching up to 2400 m;
- The Northward plain which is characterized by low altitudes around 300 m. It consists of degraded shrubby steppes on sandy clay soils.
The area is characterized by three main climatic zones: the Sahelian zone, the Sudano-Sahelian and the Sudano-Guinean zone located southward in the Adamawa region. The climate is under the influence of the African monsoon which brings rains between May and October and by the Harmattan winds coming from Sahara which brings dryness between November and April [9] - [12] . The mean annual rainfall ranges between 400 mm to 1800 mm. The mean annual temperature during the period 1960-2010 ranges between 24˚C and 27.9˚C in the Adamaoua region and from 28˚C to 34˚C to the Sahelian region [9] .
The study area is drained by many streams. The most important permanent rivers are Benue, Chari, Faro and Logone with seasonal rivers largely dependent on rainfall like Mayo Tsanaga, Mayo Louti and Mayo Oulo.
2.2. Precipitations Data
In order to conduct our study, monthly and annual data were collected in 25 stations (20 stations in Cameroon and 5 in Chad Republic) (Figure 2(a)). The recording period varies from 44 years to 64 years. This period was used in this study because it represents the longest period available and the highest quality data.
The database was provided from Regional Meteorology Directorate of Far North, North and Adamawa, Cotton Development Company (SODECOTON) of Cameroon and Climatology Directorate of Chad. The stations are irregularly distributed throughout the study area. Five stations of Chad Republic are used in this study in order to complete the database for a better interpolation. Table 1 shows the statistical characteristic of data used including length, mean, minimum, maximum, coefficient of variation and standard deviation.
2.3. Digital Elevation Model (DEM)
Digital Elevation Model of Northern Cameroon was used in the interpolation process to reduce prediction error. Figure 2(b) shows the spatial distribution of rainfall stations on the DEM map. The elevation data used in this study are extracted from the ASTER Digital Elevation Model (Advanced Space borne Thermal Emission and Reflection Radiometer) version 2 (GDEM V2) on October 17, 2011 from USGS/EROS (http://earthexplorer.usgs.gov/) a contribution from METI and NASA.
3. Methodology
The spatial distribution of the mean annual precipitation is studied using the Kriging and IDW interpolation method. Trend significance was analyzed using the non-parametric Mann-Kendall test (MK) at significant level of 0.5 and Sen’s slope estimator. The homogeneity of precipitations data have been tested before their application.
3.1. Homogeniety Tests
The available collected data presents some voids due to missing values. Missing values which records having small gaps least than 5 % have been estimated by using linear regression.
The homogeneity of the rainfall data was analyzed by Pettitt test and Standard Normal Homogeneity (SNH) Test using Anclim software created by [22] .

Figure 2. Location of stations used in the study (a) and digital elevation model of northern cameroon (b).

Table 1. Statistical characteristics of precipitation data used in the study.
C = Cameroon and Ch = Chad; SD = Standard Deviation; CV = Coefficient of variation.
3.2. Geostatistical Analysis: Kriging Method
Kriging is a geostatistical method of interpolation (prediction) for spatial data [23] [24] . It is used to estimate the unknown precipitation value at the unsampled location as a linear combination of neighboring observations. This method assumes that the distance or direction between sample points reflects a spatial correlation that can be used to explain the variation of rainfall in the studied areas.
Semivariograms were calculated for each year using some algorithms developed by Isaaks and Srivastava [25] :

where, γ*(h) the estimated value of the semi-variance for lag h; n the number of pairs stations separated by h distance; x(i) and x(i + h) values of variable x at time i and i + h, respectively; i and i + h are position in two dimensions.
3.3. Local Interpolation: Inverse Distance Weighting (IDW)
Inverse Distance Weighting (IDW) is a local interpolation method which was defined as distance reverse function of each point from neighboring points. This method estimates values at un-sampled points by the weighted average of observed data at surrounding points. It determines cell values using a linear-weighted combination set of sample points. The weight assigned is a function of the distance of an input point from the output cell location [20] [25] .
According to [20] , IDW relies on the theory that, the unknown value of a point is more influenced by closer points than by points further away. It is based on the following equations:

where Di is the distance between sampled and un-sampled points and d parameter which is specified as a geometric form for the weight while other specifications are possible.
3.4. Mann-Kendall Test for Trend Analysis
The Mann-Kendall test is a test developed by Mann in 1945 and completed by Kendall in 1975 [26] . It is a non-parametric statistical procedure that is widely used to detect trend significance in time series for hydrological and climate analysis [27] . The Mann-Kendal (MK) test searches for a trend in a time series without specifying whether the trend is linear or nonlinear.
It is based on the test statistics Z, which is defined by [25] as follow:

The Mann-Kendall statistic (S) is defined as the sum of the number of positive differences minus the number of negative differences as follows:

Sign (xj − xk) is an indicator function that results in the values −1, 0, or 1 according to the sign of xj − xk, where j > k, the function is calculated as follows:

Var(s) is defined as:

where n is the length of data set and t is the number of data value in a group of determination.
The statistical significance of the Z values is tested at 95% levels of significance. The computed probability associated with this normalized statistic test is given by the following equation [28] :

At 95% levels of significance, the critical value of Z is ranging between [−1.96; +1.96]. The trend is said to be decreasing if Z is negative and the computed probability is greater than the level of significance. However, it is said to be increasing if the Z is positive and the computed probability is greater than the level of significance. There is no trend if the computed probability is less than the level of significance [25] .
3.5. Sen Estimator Analysis
The Sen’s slope method is a non-parametric procedure developed by Sen in 1968 [29] . It is a method that gives a robust estimation of the trend if linear trend is present in a time series [30] . This method proceeds by calculating the slope as a change in measurement per change in time [18] . It is requires a time series of equally spaced data. The slope estimates of N pairs of data are first computed by:
 for
for 
where xj, xk data measured at time j and k. The Sen’s estimator is computed by [18] :
 if N is odd
 if N is even
where n is the number of calculated slopes.
4. Results and Discussion
4.1. Temporal and Spatial Variability of Precipitation
Annual mean rainfall for the period 1950-2013 shows a high spatial variation (Figure 3(a) and Figure 3(b)), with values ranging from 451 mm in the Far North to 1763 mm in the Southern regions (Banyo and Tibati stations). Interpolation maps of annual rainfall were generated by using QGIS 2.8.2 software in order to obtain more precipitation information at any point of Northern Cameroon, whether there is a rainfall station there or not.

Figure 3. Spatial distribution of the mean annual rainfall by Kriging and IDW method during time period 1950-2013.
The geostatistical interpolation obtained by Kriging and IDW shows a spatial distribution of precipitation mainly determined by the topography and the geography of the study area.
The map obtained by IDW method (Figure 3(a)), presents a division corresponding to high and low rainfall values. Highest precipitation values are found in the south of the study area coinciding with a mountainous relief, while lower values are shown in the north on the plain region, coinciding with the lowest elevation areas.
The mean annual rainfall for this period is access to 1236 mm over Northern Cameroon (Table 2).
The map performed by kriging method (Figure 3(b)), illustrates a relatively similar pattern to map obtained by IDW with higher values of precipitation in mountainous region and lower in plain one.
The comparison between the two methods by Root-Mean-Square Error showed a higher value on IDW method. Kriging method offers the best interpolation according to the value of Root Mean Square Error despite the fact that the mean error was the lowest among them. However, IDW method presents had a smaller mean error of estimates than the Kriging one (Table 2).
These results are in line with the works of [20] and [27] . Nevertheless [24] noted that the best method depends of the area and the spatial scale desired for mapping. The combination of these two methods helped to improve the understanding of spatio-temporal variability of rainfall in the Northern part of Cameroon.
Coefficients of variation (CV) which corresponds to the ratio of the standard deviation to the mean rainfall shows that inter-annual variability was high in the whole area, with values ranging from 10% to more than 38% (Figure 4). The lowest values of CV were observed in the mountainous regions with high elevation and the highest in the plains regions (Makari and Waza). This result provides evidence of the large spatio-temporal variability of rainfall in this part of Cameroon. The complex spatial pattern illustrates the spatial heterogeneity of precipitations and indicates that topography factor may be responsible of this variability. High values of CV have been obtained by [31] in Southern part of Chad Republic for the same climate. However, values acquired by [8] in South of Cameroon is lower (least than 16%) compared to the North one.
Spatially, the value of precipitation declined from the southward to northward. High values of precipitation are observed in the stations located at mountainous areas with altitudes ranging between 700 - 1700 m.
According to [32] , the mountains range act as a barrier and plays a great role in activating rainfall and provided a trigger mechanism for potentially unstable air masses. In our study area, the higher values of precipitation observed at the mountainous zone is related to the dynamic convection of orographic type due to the presence of the Cameroon volcanic line (CVL) which influences the monsoon winds that comes from the Atlantic Ocean [8] . The authors located this line from Mount Cameroon (4095 m) to Mount Mandara in the Far North passing by Mounts Oku (3008 m) and Adamawa plateau (1100 m). Stations located at this line (Ngaoundere, Meiganga, Poli, Mokolo…) present high value of precipitation. The same observation was done by [8] on the Sanaga watershed.
In the other hand, the decrease of precipitation from Southern to Northern part of studied areas can also be explained by the movement of Inter-Tropical Zone (ITCZ). The ITCZ separates the monsoon, moist and cool air masses and the Harmattan, a dry air masses coming from the Sahara desert [11] [27] . Its migration from the South and the North causes a frequency reduction of moist air masses and indirectly involves in amount of precipitation.
Harmattan wind remains the most dominant on the Northern part of studied areas [33] . Therefore we can easily understand why this region is fragile and vulnerable. This element shows the role of the elevation in the genesis of rainfall and the effects of dry air masses on the reduction of rainfall.
Several studies in the Soudano-Sahelian region of West and central Africa indicate that annual and monthly rainfall decreased during the second-half of the twentieth century [2] [10] [34] . An annual decrease of 14% and 31% was reported by [6] in Soudano-Sahelian region of Cameroon by using Pettitt and Hubert statistics tests. This explains and confirms the great variability of rainfall observed in the Northern Cameroon.
Table 2. Statistics for the two different methods of interpolation.

Figure 4. Spatial distribution of interannual variability of annual rainfall (CV).
4.2. Monthly Precipitation Variability
Figure 5 presents the repartition of isohyets on the study areas and monthly precipitation of twenty stations of Northern Cameroon. The isohyets values decrease from South to North.
Monthly rainfall in Northern Cameroon usually occurs in March-April to October in mountainous region and May-June to October in the stations located on the plain (Figure 5). However, four main months concentrate the major part of annual precipitations: June, July, August and September. These rainy months represent 72% to 90% of the annual precipitation amount.
All the stations recorded the maximum rainfall during the month of August, followed by July (more than 150 mm) and September (between 100 and 150 mm), whereas, no precipitation is observed during the dry season (between November to March or April).
Spatial distribution of monthly precipitation shows more detailed assessment about precipitation regime in the studied area (Figures 6(a)-(d)). June precipitations varies from 40 mm to 240 mm where the highest values are observed in mountainous regions and the lowest one in plain areas, this month is characterized by an important evaporation [31] . Precipitations of July, August and September range respectively between 120 - 300 mm, 100 - 320 mm and 70 - 300 mm. However, we noticed some particularities for August amount of precipitation. The gradient of spatial distribution is observed firstly from the eastern to the western of studied areas and secondly from the South to the North with highest values in mountainous areas.
This emphasis what has already been noticed in the spatial distribution of annual amount of precipitation, a general decreasing from South to North explained by atmospheric dynamics and reliefs. We can also add the presence or the absence of evaporation sources and humans activities in urban areas.

Figure 5. Isohyets showing mean annual precipitation from 1950 to 2013 and monthly precipitation of Northern Cameroon.
4.3. Trends in Precipitation
The trend analysis of annual average rainfall time series by Mann-Kendall test combined with Sen’s slope (Figure 7) reveals the presence of positive and negative trends at the 95% level of significance. About 60% of stations experienced a decrease trend of rainfall amount but only 10% of stations are statistically significant

Figure 6. Spatial distribution of four main monthly precipitations in Northern Cameroon (1950-2013).
(Ngaoundere and Meiganga). The magnitudes of the insignificant decreasing trends in annual rainfall ranged between 0.11 and 3.92 mm/year in the study area.
However, 25% of station indicates an increasing trend of precipitation but only 5% of station is statistically significant (Waza) at the 95% level of confidence. This result must be taken a special attention because the extension of database of Waza station was the least (just 44 years).

Figure 7. Spatial distribution of annual precipitation trends in Northern Cameroon (1950-2013); SS: statistically significant at α = 0.05.
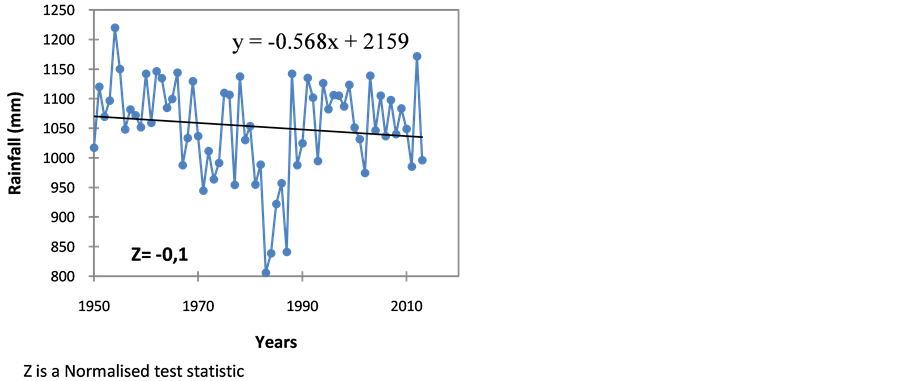
Figure 8. Trend of average precipitation across the Northern Cameroon during the time period 1950-2013.
The mean trend across the Northern Cameroon was estimated at −0.568 mm/year (Figure 8), clearly showing that annual precipitation declined and this trend was most pronounced in upstream areas.

Figure 9. Spatial distribution of monthly precipitation trends in northern Cameroon (1950-2013).
Regarding the monthly trends, the result shows that negative trends are most dominant over the study area that negative trends but both are not statistically significant. The most important increase in rainfall amount was recorded in august and July, but the trend was not statistically significant (Figure 9). In June and September, the decreasing trends are dominant over the studied area, but these trends were not statistically significant. This result does not show any clear pattern in terms of spatial or temporal distribution as suggested by [35] , but we notice that the decrease of precipitation affected most the beginning and the ending of rainfall season and not the two important rainfall months. According to [19] , increases and decreases in precipitation may be due to changes in atmospheric circulation patterns during the past century.
In the other case, the increase trend observed in July and August months does not necessarily indicate a positive impact as availability of water resource but can help to understand the occurrence of floods events. [18] demonstrated that wet events observed during the monsoons are often responsible of floods, increase of soil moisture and development of crop productivity. This observation explains why extreme floods event occurs during August in Northern Cameroon [36] . In addition, the gradient of spatial distribution observed in August corroborates the result and explains why the Eastern area of Northern Cameroon is a great agricultural region [14] .
Moreover decrease trends may be responsible of the reduction of water discharge noted in the Benue watershed, groundwater resource [10] [28] natural vegetation and crop. Understanding the spatial and temporal distribution of rainfall and their characteristics remains important to agriculture managers, farmers, hydrology analysis and human activities.
5. Conclusions
The study of spatial and temporal variability of precipitation is one of the most important requirements for a wide variety of human activities and for water resources access. Spatial and temporal variability of annual rainfall in the Northern part of Cameroon were analyzed during the period 1950-2013 by using geostatistical analysis, local interpolation (Kriging and IDW), Mann-Kendall test and Sen’s slope. Results show that precipitation trends on the Northern part of Cameroon are highly variable in both space and time.
Spatial annual mean rainfall pattern showed that high values, of about 1800 mm per year, were seen in the higher elevation at the mountainous regions, while low values of about 400 mm appeared in plains regions of Far North Cameroon. The spatial distribution of precipitation is highly influenced by the topography of the study area and by the migration of Inter-Tropical Convergence Zone.
The trend analysis shows a decrease of annual average precipitation across the Northern Cameroon at a rate of −0.568 mm/year over the time period 1950-2013. This result clearly shows the effect of climate change on the precipitation amount. On the other case, the positive and negative trends indicate the vulnerability of this area and may explain the occurrence of droughts and floods events in this part of Cameroon. Also, the results of this study are helpful for planning and efficient use of water resources for socio-economic activities. For future research, it will be important to corroborate this result with the hydrological data and atmospheric circulation patterns in order to understand the cause of trends and to access the effect of trend decrease of precipitation on the water resource in this area.
Acknowledgements
Authors acknowledge regional Meteorology Directorate of Northern Cameroon (Far North, North and Adamawa regions) and Chad Republic Climatology Agency for providing precipitation data and they also thank anonymous reviewers for their useful comments.
Cite this paper
Elisabeth Fita Dassou,Auguste Ombolo,Steven Chouto,Guillaume Ewodo Mboudou,Jean Marcel Abate Essi,Etienne Bineli, (2016) Trends and Geostatistical Interpolation of Spatio-Temporal Variability of Precipitation in Northern Cameroon. American Journal of Climate Change,05,229-244. doi: 10.4236/ajcc.2016.52020
References
- 1. Sebbar, A., Fougrach, H., Hsain, M., Saloui A. and Badri, W. (2011) Etude de la variabilité du régime pluviométrique au Maroc septentrional (1935-2004). Sécheresse, 22, 139-148.
- 2. Ardoin-Bardin, S. (2004) Variabilité hydro-climatique et impacts sur les ressources en eau de grands bassins hydrographiques en zone soudano-sahélienne. Ph.D. Thesis, University of Montpellier II, Montpellier.
- 3. Servat, E., Paturel, J.E., Lubès-Niel, H., Kouamé, B. and Masson, J.M. (1997) Variabilité des régimes pluviométriques en Afrique de l’Ouest et centrale non sahélienne. Comptes Rendus de l'Académie des Sciences—Series IIA—Earth and Planetary Science, 324, 835-838.
http://dx.doi.org/10.1016/s1251-8050(97)82518-9 - 4. Paturel, J.E., Servat, E., Kouamé, B., Lubès, H., Fritsch, J.M. and Masson, J.M. (1997) Manifestations d’une variabilité hydrologique en Afrique de l’Ouest et Centrale. Sustainability of Water Resources under Increasing Uncertainty. Proceeding Rabat Symposium, IAHS Publ., 23 avril-03 mai 1997, 21-30.
- 5. IPCC (2014) Climate Change: Impacts, Adaptation, and Vulnerability. Part B: Regional Aspects. Contribution of Working Group II to the Fifth Assessment Report of the Intergovernmental Panel on Climate Change. Cambridge University Press, Cambridge and New York.
- 6. Fita Dassou, E., Ombolo, A., Ewodo Mboudou, G., Chouto, S., Bineli Ambomo, E. and Abate Essi, J.M. (2015) Caractérisation de la variabilité spatio-temporelle des précipitations dans la zone soudano-sahélienne du Cameroun au cours des cinq dernières décennies. Afrique Science, 11, 331-348.
- 7. Djoufack, V., Fontaine, B., Martiny, N. and Tsalefack, M., (2012) Climatic and Demographic Determinants of Vegetal Cover in Northern Cameroun. International Journal of Remote Sensing, 33, 6904-6926.
http://dx.doi.org/10.1080/01431161.2012.693968 - 8. Kpoumié, A., Ndam Ngoupayou, J.R., Rusu, E., Sfica, L, Ichim, P. and Ekodeck, E.G. (2012) Spatiotemporal Evolution of Rainfall Regimes in the Sanaga Basin-Cameroon in a Deficit Context. Present Environment and Sustainable Development, 6, 55-68.
http://www.pesd.ro/articole/nr.6/2/06SEORRITSBCIADC151020125568.pdf - 9. Aretouyap, Z., Njandjock Nouck, P., Bisso, D., Nouayou, R., Lengue, B. and Lepatio Tchieg, A. (2014) Climate Variability and Its Possible Interactions with Water Resources in Central Africa. Journal of Applied Sciences, 14, 2219- 2233.
http://scialert.net/abstract/?doi=jas.2014.2219.2233
http://dx.doi.org/10.3923/jas.2014.2219.2233 - 10. Liénou, G., Mahé, G., Paturel, J.E., Servat, E., Ekodeck, G.E. and Tchoua, F. (2009) Variabilité climatique et transport de matières en suspension sur le bassin versant de Mayo-Tsanaga (Extrême-Nord Cameroun). Sécheresse, 20, 139-144.
- 11. Sighomnou, D. (2004) Analyse et redéfinition des régimes climatiques et hydrologiques du Cameroun: Perspectives d’évolution des ressources en eau. An Unpublished Ph.D. Thesis, Université of Yaoundé I, Yaoundé.
- 12. Bring (2005) Evaluation des ressources en eau atmosphérique sur le Nord-Cameroun à l’aide des méthodes conventionnelles et satellitales. An Unpublished PhD. Thesis, University of Ngaoundere, Ngaoundere.
- 13. Molua, E.L. and Lambi, C.M. (2001) Climate, Hydrology and Water Resources in Cameroon. Environmental Issues: Problems and Prospects, Bamenda: Unique Printers, 45-66.
- 14. Tchotsoua, M., Fotsing, J.M. and Moussa, A. (2007) évaluation des risques d’inondation dans la vallée de la Bénoué en aval du barrage de Lagdo (Cameroun). Actes de Colloque, JSIRAUF, Hanoi, 6-9 Novembre 2007.
- 15. GWS (2009) Etat des lieux du Secteur Eau et Environnement au Cameroun. Plan d’action national de gestion integrée des ressources en eau (PANGIRE), 213.
- 16. De Luis, M., Raventos, J., Gonzalez-Hidalgo, J.C., Sanchez, J.R. and Cortina, J. (2000) Spatial Analysis of Rainfall Trends in the Region of Valencia (East Spain). International Journal of Climatology, 20, 1451-1469.
http://dx.doi.org/10.1002/1097-0088(200010)20:12<1451::AID-JOC547>3.0.CO;2-0 - 17. Feizi, V., Mollashahi, M., Frajzadeh, M. and Azizi, G. (2014) Spatial and Temporal Trend Analysis of Temperature and Precipitation in Iran. ECOPERSIA, 2, 727-742.
- 18. Shahid, S. (2010) Rainfall Variability and the Trends of Wet and Dry Periods in Bangladesh. International Journal of Climatology, 30, 2299-2313.
http://dx.doi.org/10.1002/joc.2053 - 19. Mirás-Avalos, J.M., Paz-González, A., Vidal-Vázquez, E. and Sande-Fouz, P. (2007) Mapping Monthly Rainfall Data in Galicia (NW Spain) Using Inverse Distances and Geostatistical Methods. Advances in Geosciences, 10, 51-57.
http://dx.doi.org/10.5194/adgeo-10-51-2007 - 20. Ly, S., Charles, C. and Degré, A. (2011) Geostatistical Interpolation of Daily Rainfall at Catchment Scale: The Use of Several Variogram Models in the Ourthe and Ambleve Catchments, Belgium. Hydrology and Earth System Science, 15, 2259-2274.
http://dx.doi.org/10.5194/hess-15-2259-2011 - 21. Piticar, A. and Dumitru, R. (2013) Spatial Distribution and Temporal Variability of Precipitation in Northeastern Romania. Riscuri si Catastrofe, 13, 35-46.
- 22. Price, D.T., McKenney, D.W., Nalder, I.A., Hutchinson, M.F. and Kesteven, J.L. (2000) A Comparison of Two Statistical Methods for Spatial Interpolation of Canadian Monthly Mean Climate Data. Agricultural and Forest Meteorology, 101, 81-94.
http://dx.doi.org/10.1016/S0168-1923(99)00169-0 - 23. Stèpànek, P. (2008) AnClim-Software for Time Series Analysis. Vol. 1, Department of Geography, Faculty of Natural Sciences, Masaryk University, Brno.
- 24. Vicente-Serrano, S.M., Sanchez, M.A. and Cuadrat, J.M. (2003) Comparative Analysis of Interpolation Methods in the Middle Ebro Valley (Spain): Application to Annual Precipitation and Temperature. Climate Research, 24, 161-180.
http://www.int-res.com/abstracts/cr/v24/n2/p161-180/
http://dx.doi.org/10.3354/cr024161 - 25. Al-Mashagbah, A. and Al-Farajat, M. (2013) Assessment of Spatial and Temporal Variability of Rainfall Data Using Kriging, Mann Kendall Test and the Sen’s Slope Estimates in Jordan from 1980 to 2007. Research Journal of Environmental and Earth Sciences, 5, 611-618.
- 26. Kendall, M.G. (1975) Rank Correlation Methods. 4th Edition, Charles Griffin, London.
- 27. Tewolde, M.G., Beza, T.A., Costa, A.C. and Painho, M. (2010) Comparison of Different Interpolation Techniques to Map Temperature in the Southern Region of Eritrea. 13th AGILE International Conference on Geographic Information Science, Guimaraes, 1-5.
- 28. Rai, R.K., Upadhyay, A. and Ojha, C.S.P. (2000) Temporal Variability of Climatic Parameters of Yamuna River Basin: Spatial Analysis of Persistence, Trend and Periodicity. The Open Hydrology Journal, 4, 184-210.
http://dx.doi.org/10.2174/1874378101004010184 - 29. Sen, P.K (1968) Estimates of the Regression Coefficient Based on Kendall’s Tau. Journal of the American Statistical Association, 63, 1379-1389.
http://dx.doi.org/10.1080/01621459.1968.10480934 - 30. Olofintoye, O., Adeyemo, J. and Otieno, F. (2015) Impact of Regional Climate Change on Freshwater Resources and Operation of the Vanderkloof Dam System in South Africa. In: Singh, B.R., Ed., Global Warming—Impacts and Future Perspective, InTech, 165-184.
http://dx.doi.org/10.5772/50414 - 31. Bedoum, A., Bouka Biona, C., Alladoum, M., Adoum, I. and Baohoutou, L. (2014) Impact de la variabilité pluviométrique et de la sécheresse au Sud du Tchad: Effets du changement climatique. Revue Ivoirienne des Sciences Technologiques, 23, 13-30. www.revist.ci/REVIST_23/REVIST_23_2.pdf
- 32. Millan, M., Estrela M.J., and Caselles V. (1995) Torrential Precipitations on the Spanish East Coast: The Role of the Mediterranean Sea Surface Temperature. Atmospheric Research, 36, 1-16.
http://dx.doi.org/10.1016/0169-8095(94)00048-I - 33. Olivry, J.C. (1986) Fleuves et rivières du Cameroun. Collection Monographies Hydrologiques, No. 9, ORSTOM, Paris.
- 34. Mahé, G., Diello, P., Paturel, J.E, Barbier, B., Karambiri, H, Dezetter, A., Dieulin, C. and Rouche, N. (2010) Baisse des pluies et augmentation des écoulements au Sahel: Impact climatique et anthropique sur les écoulements du Nakambe au Burkina Faso. Sécheresse, 21, 330-332.
- 35. Brunetti, M., Buffoni, L., Maugeri, M. and Nanni, T. (2000) Precipitation Intensity Trends in Northern Italy. International Journal of Climatology, 20, 1017-1031.
http://dx.doi.org/10.1002/1097-0088(200007)20:9<1017::AID-JOC515>3.0.CO;2-S - 36. Sighomnou, D., Tanimoun, B., Alio, A., Zomodo, L., Ilia, L., Koné, S., Zinsou, D. and Desouasi, R. (2012) Crue exceptionnelle et inondations au cours des mois d’aout et Septembre 2012 dans le Niger Moyen et Inferieur. AFD, Autorité du Bassin du Niger, 11 p.
NOTES

*Corresponding author.