Open Journal of Fluid Dynamics
Vol.3 No.4(2013), Article ID:40441,16 pages DOI:10.4236/ojfd.2013.34036
Effect of Laryngopharyngeal Anatomy on Expiratory Airflow and Submicrometer Particle Deposition in Human Extrathoracic Airways
1Department of Engineering, Calvin College, Grand Rapids, USA
2Department of Mechanical and Biomedical Engineering, Central Michigan University, Mount Pleasant, USA
Email: *xi1j@cmich.edu
Copyright © 2013 Xiuhua Si et al. This is an open access article distributed under the Creative Commons Attribution License, which permits unrestricted use, distribution, and reproduction in any medium, provided the original work is properly cited.
Received September 4, 2013; revised October 4, 2013; accepted October 11, 2013
Keywords: Medical Image-Based Modeling; Nasal Airflow; Uvula; Breathing Resistance; Nanoparticle Deposition
ABSTRACT
The objective of this study is to systematically assess the influences of the larynopharyneal anatomical details on airflow and particle behaviors during exhalation by means of image-based modeling. A physiologically realistic nose-throat airway was developed with medical images. Individual airway anatomy such as uvula, pharynx, and larynx were then isolated for examination by progressively simplifying this image-based model geometry. Low Reynolds number (LRN) k - w model and Langrangian tracking model were used to simulate the dynamics of airflow and particle transport for a wide range of exhalation conditions (4 - 45 L/min) and particle sizes (1 nm - 1 μm). Results showed that pharyngeal anatomical details exerted a significant impact on breathing resistance and particle profiles. Abrupt pressure drop resulting from the uvula-related airway obstruction was observed. Even though the total deposition rate in the nasal airway is largely unaffected by the upstream effect, the local deposition patterns vary notably. Results of this study also indicate that the pressure drop appears to be an appropriate parameter to characterize the geometric variations for diffusive depositions. Inclusion of pressure drop (D0.5Q−0.62dp0.07) gives an improved correlation than using the conventional diffusion factor (D0.5Q−0.28).
1. Introduction
A significant issue in evaluating nasal airflow and aerosol deposition during exhalation is determining the extent to which the larynx and pharynx affect their behaviors before entering the nasal cavity. The larynx consists of vocal folds that form an elliptical or triangular crosssectional area of flow constriction (i.e., glottal aperture). It is approximately 6 cm long and its cross-sectional area varies with mean flow rate [1] and oscillates during a breathing cycle [2]. The pharynx is a region that connects the nose, mouth, larynx, and esophagus, and is highly variable in its morphology. Especially, the uvula, which is a projection of the tissue suspended from the soft palate and resides between the nasoand oro-pharynx, can remarkably alter the pharyngeal airway structure. Air exhaled from the lungs enters the larynx, travels through the pharynx and nasal passages, and exits the nostrils. In addition to the geometric curvature from the larynx through the nasopharynx, the airflow experiences two dramatic geometric constrictions (i.e., the glottal aperture and the uvula) before it enters the nasal cavity, yielding recirculating zones downstream of the glottis and within the nasopharynx. As a result, the airflow and particle profiles entering the nasal cavity are far from uniform.
The nasal deposition of submicrometer aerosols during exhalation has been considered in human volunteers in a limited number of studies [3-5]. A common disadvantage of such in vivo studies is the difficulty in determining local deposition values even though imaging methods now make it possible [6]. Because of the inaccessibility of respiratory airways, modeling has long been a primary component of respiratory aerosol research. Both in vitro and computer models seek to simplify the complex airway geometry while still capturing the relevant physics. In vitro experimental studies that have evaluated expiratory resistance and aerosol deposition in human nasal replicas include Cheng et al. [7], Cheng et al. [8], and Swift et al. [9]. The nasal geometries used in these studies are typically derived from medical scan data (e.g., MRI) or casts of cadavers and extend from the nostrils to the upper trachea. As with in vivo tests, no in vitro study so far has been reported in addressing the influences of larynx and pharynx on expiratory extrathoracic depositions.
A number of numerical studies have considered the transport and deposition of fine and ultrafine particles in the nasal airways [10-15]. Similar CFD studies have also evaluated the transport and absorption of vapors in the nasal passages [16-18]. Comparisons of CFD results to experimental deposition data in the nasal cavity are often difficult due to differences in the geometric models that vary in their physical realisms. Untested modeling assumptions limit the accuracy of both in vitro and numerical models. During exhalation, the influence of the upstream laryngeal and pharyngeal anatomy on transport and deposition in the nasal cavity may be significant. Longest and Vinchurkar [19] studied aerosol depositions in a multi-bifurcating airway geometry and showed the necessity of including the upstream effects to validate CFD predictions with experimental measurements. Xi and Longest [20] evaluated the effects of physical realism on deposition patterns for micrometer aerosols in a mouth-throat model with varying degree of geometric complexity. This study reported that geometric realism had a major effect on local inertia-based depositions and highlighted the importance of a realistic glottal aperture and angled trachea on deposition localization and particle profiles entering the lungs. Similar observations on the laryngeal effect have been reported by Li [21], Brouns et al. [22], Liu et al. [10], and Xi et al. [23] that the presence of larynx can significantly affect airflows and depositions downstream of the glottis. Furthermore, highly accurate respiratory models could be transformative to clinical diagnosis, treatment, and pre-surgical planning of associated respiratory disorders.
The validity of assuming simplified airway geometry to facilitate modeling is routinely adopted in previous studies but remains largely untested. The objective of this study is to systematically evaluate the effect of the laryngopharyngeal anatomical details on both airflow and aerosol depositions in the nasal airways of an adult. Starting from an image-based anatomically accurate airway model, we will progressively simplify this geometry, one anatomy at a time, to gain a more accurate understanding of the physiological roles of each anatomy in regulating airflows, breathing resistance, and particle filtering. The glottal aperture, pharynx, and uvula are especially of interest in this study.
2. Methods
2.1. Construction of the Airway Models
In order to assess the impact of the laryngopharyngeal anatomy on airflow and particle deposition in the nasal airways, four computational models with varying geometric details have been considered. We started from a highly realistic nasal-laryngeal airway model that was recently developed based on MRI images of a 53-yearold male (weight 73 kg and height 173 cm) [24]. The MRI tracings were first segmented in MIMICS (Materialise, Ann Arbor, MI) according to the contrast between osseous structures and intranasal air to convert the raw image data into a set of cross-sectional contours that define the airway of interest. Based on these contours, an internal nasal surface geometry was constructed in Gambit (Ansys, Inc.) as shown in Figure 1. This same MRI image set has also been used in a number of nasal particle deposition experiments [7,25-27], and therefore a direct comparison between simulated and experimental results is possible.
Bedsides the anatomically accurate nasal passages, three other key features characterize this image-based model, namely, a hanging uvula, a flat-plated pharynx, and a triangular-shaped glottal aperture. Movement of the uvula alters the airway morphology that connects the nasoand oropharynx. In this study, the uvula rests on the back of the throat and partially obstructs the inferior nasopharynx, resulting in two flow passages. This might be attributed to the supine position of the patient during image acquisition. Posterior to the uvula, the pharynx is featured by narrow and flat air channels, which converge into the wedge-shaped glottis in the larynx. In order to approximate the in vivo airway morphology that was captured in the images, anatomical details such as the epiglottis and the two pharyngeal sinuses on either side of the larynx were also retained, as shown in Figure 1(a). In light of the glottis, several studies have reported a triangular-shaped cross-section based on bronchoscope images in living subjects [28,29]. The triangular cross section is formed by the vocal folds with one point of the triangle resting on the ventral surface and two points on the dorsal surface, as shown in the plane E-E’ in the right panel of Figure 1(a). In contrast to this, in vitro studies with larynx replica casts have reported a more elliptical shape [1]. In this study, the triangular shape of the glottis observed in the CT data has also been retained.
As a first simplification, the hanging uvula was removed in Model 1, resulting in an un-obstructed nanopharynx in Model 2 (Figure 1(b)). This model represents the condition when a subject takes the upright position and the soft palate bends downward due to its own weight. Further simplifications have been made to generate Model 3. This model consists of a much simpler, elliptical pharynx. The oropharynx, epiglottis, and the two laryngeal sinuses (Figure 1(c)), has been eliminated as most previous studies did [7-9,30]. Rodenstein et al. [31] reported that pharynx had a transverse to anterior-posterior
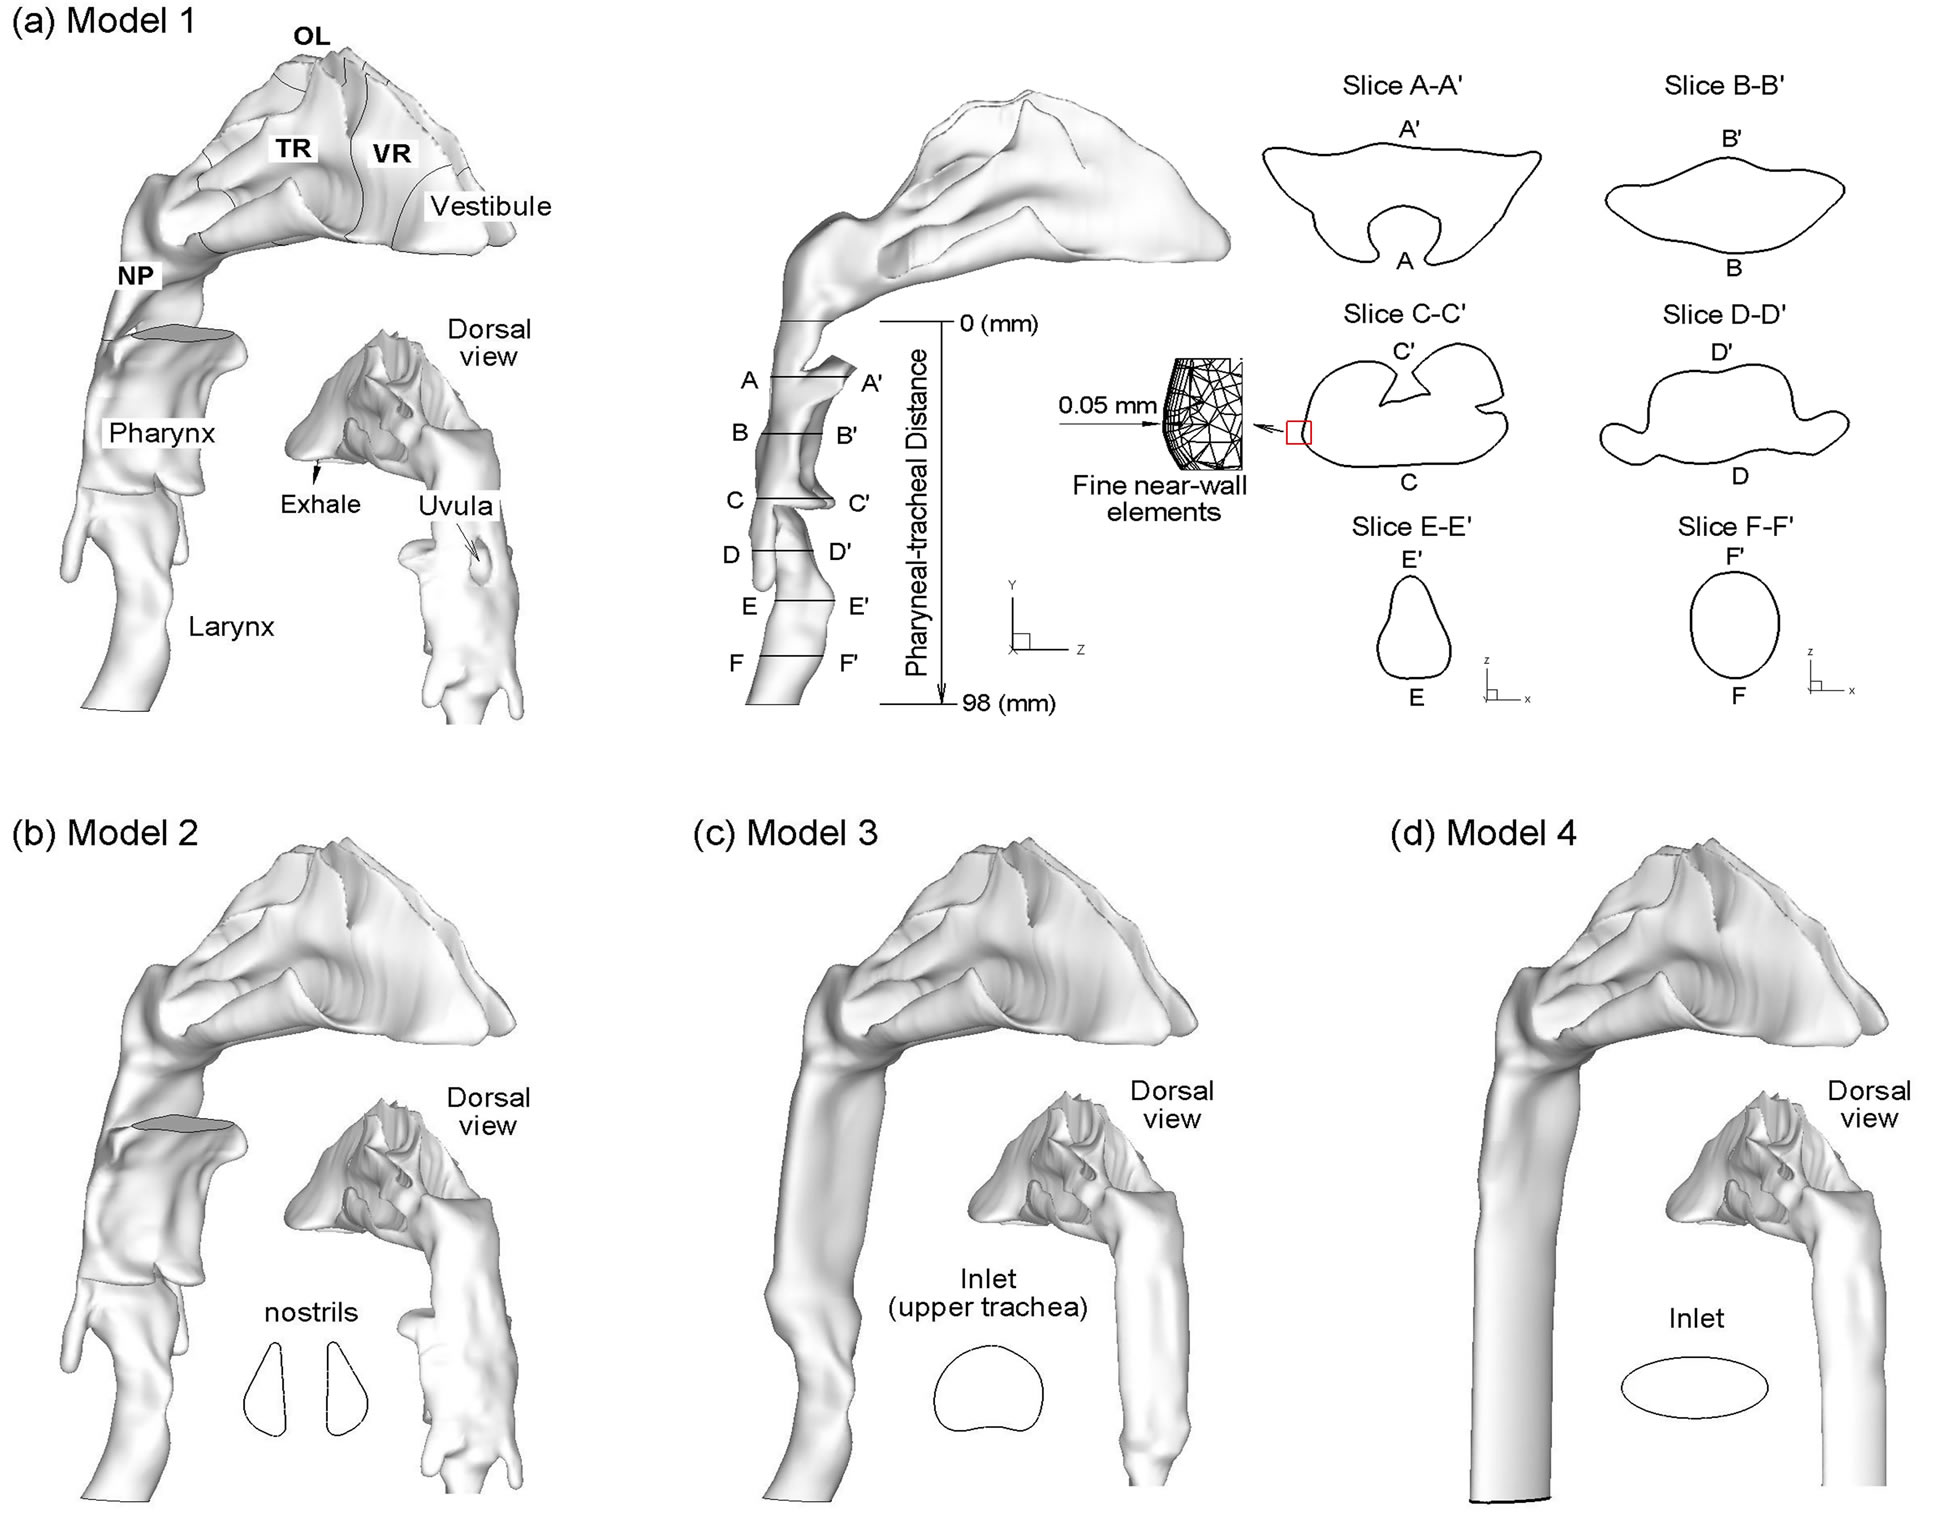
Figure 1. Surface models of the nasal-laryngeal airway with decreasing geometric complexity.
ratio of 2.5 for healthy subjects. Thus, for Model 3, we assume that the pharynx is approximately an elliptical pipe with the major axis 2.5 times as large as the minor axis. The fourth geometry model (i.e., Model 4) excludes the triangular-shaped larynx and is composed of an elliptical pipe downstream of the nasal cavity (Figure 1(d)).
During exhalation, airflow enters the upper trachea, travels through the larynx, pharynx, and nasal turbinates, and exits the nostrils. By retaining the laryngeal-pharyngeal region, more physiologically realistic inlet flow conditions are provided to the nasal cavity. As a result, the flow field and particle deposition characteristics in the nasal cavity considered in this study will better represent in vivo conditions compared with some previous studies that had excluded the larynx and pharynx. Therefore, inclusion of the laryngeal-pharyngeal region allows for the results of this computational study to be directly compared with previous in vivo nasal deposition data. In order to characterize deposition distributions, the nosethroat airway were divided into different sub-regions that include the vestibule, valve region (VR), turbinate region (TR), olfactory region (OR), nasopharynx (NP), pharynx, and larynx (Figure 1(a)). In order to quantify the airflow distributions within the nasal passages, a coronal slice in the turbinate region was further divided into superior, middle, inferior meatus (abbreviated as SM, MM, and IM, respectively) and the medial passage (MP), which will be discussed in later sections.
2.2. Boundary Conditions
Steady exhalation was assumed for all simulations with uniform velocity profiles and particle distributions at the tracheal inlet (Figure 1(a)). Initial particle velocities were assumed to match the local fluid velocity. Atmospheric pressure conditions were assumed at the two nostrils (outlets). The airway surface was assumed smooth and rigid with no-slip (uwall = 0) and perfect absorption conditions. In the body, the extrathoracic airway is lined with a thin layer of mucus, which captures particles at initial contact and clears them to the throat or nasal vestibule by mucocilliary movement within a time period of 10 to 15 minutes. Mass diffusion and metabolism of deposited particles may occur within the mucus layer and may change the zero-concentration conditions at the wall. However, due to the slow speed of the mucocilliary movement compared with the intranasal airflow and relatively low deposition rates, the no-slip and perfect absorption conditions are reasonable approximations in this study.
2.3. Fluid and Particle Dynamics Equations
The flow conditions considered in this study are assumed to be isothermal and incompressible. The mean inlet Reynolds number at the trachea varies from 368 to 3302. The maximum Reynolds number based on the hydraulic diameter of the glottal aperture is approximately 8037. Therefore, laminar, transitional, and fully turbulent conditions in the nasal-laryngeal model are expected. To resolve these multiple flow regimes, the low Reynolds number (LRN) k - w model was selected based on its ability to accurately predict pressure drop, velocity profiles, and shear stress for transitional and turbulent flows. Moreover, the LRN k - ω model was shown to provide an accurate solution for laminar flow as the turbulent viscosity approaches zero [32].
The transport and deposition of the submicrometer particles are simulated with a well-tested discrete Lagrangian tracking model, which is enhanced with userdefined functions (UDFs) accounting for the finite particle inertial effects that might be significant for submitcrometer particle depositions. The aerosols evaluated in this study had a tracheal Stokes number (Stk =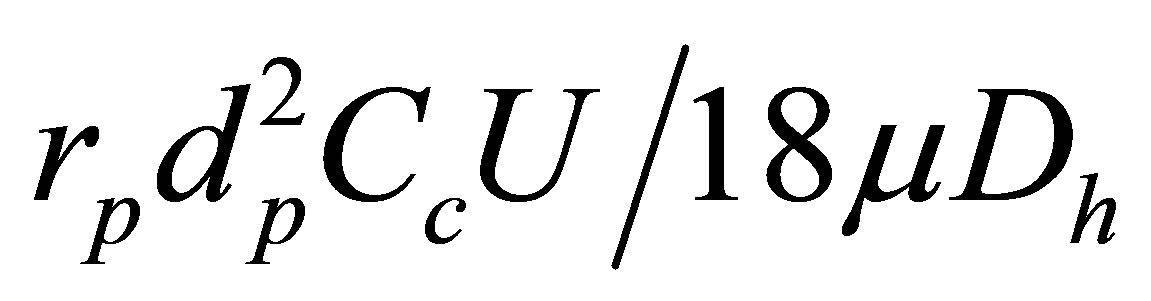 ) with a range of 1.68 ´ 10−8 to 1.0 ´ 10−3 and were assumed to be dilute and to not influence the continuous-phase, i.e., one-way coupled particle motion. In our previous studies, the UDF-enhanced Lagrangian model with near-wall interpolation algorithm [33,34] has been shown to provide close agreement with experimental deposition data in upper respiratory airways for both submicrometer [34] and micrometer particles [35]. More details of the Largrangian tracking model can be found in [34].
2.4. Numerical Method and Convergence Sensitivity Analysis
To solve the governing mass and momentum conservation equations in each of the cases considered, the CFD package ANSYS Fluent was employed. User-supplied Fortran and C programs were implemented for the calculation of initial particle profiles, particle deposition factors, grid convergence, and deposition enhancement factors. For this study, a specific set of user-defined functions were applied that considered the Brownian force, anisotropic turbulence effect, and near-wall velocity interpolation. All transport equations were discretized to be at least second order accurate in space. A segregated implicit solver was applied to evaluate the resulting linear system of equations. This solver uses the Gauss-Seidel method in conjunction with an algebraic multigrid approach to improve the calculation performance on tetrahedral meshes. Convergence of the flow field solution was assumed when the global mass residual was reduced from its original value by five orders of magnitude and the residual-reduction-rates for both mass and momentum were sufficiently small.
The computational meshes of the four nasal-laryngeal airway models were generated with ANSYS IECM CFD (Ansys, Inc). Due to the high complexity of the model geometries, unstructured tetrahedral meshes were generated with high-resolution prismatic cells in the near-wall region (Figure 1(a)). A grid sensitivity analysis was conducted by testing the effects of different mesh densities with approximately 620,800, 1,140,400, 1,975,600 and 3,212,000 control volumes while keeping the nearwall cell height constant at 0.05 mm. Since the changes in both total and sub-regional depositions were less than 1% when increasing mesh size from 1,975,600 to 3,212,000, the final grid for reporting flow field and deposition conditions consisted of approximately 1,975,600 cells with a thin five-layer pentahedral grid in the nearwall region and a first near-wall cell height of 0.05 mm.
For discrete Lagrangian tracking, the number of seeded particles required to produce count-independent depositions was considered. Particle count sensitivity testing was performed by incrementally releasing groups of 10,000 particles. The number of groups was increased until the deposition rate change was less than 1%. Due to the low deposition rates, more particles were required for fine aerosols to generate count-independent results compared with ultrafine aerosols. The final number of particles tracked for 1 - 40 nm and 100 - 1000 nm aerosols were 150,000 and 600,000, respectively.
3. Results
3.1. Nasal Airway Dimensions
Dimensions of the four models considered are shown in Figure 2 in terms of perimeter, cross-sectional area and hydraulic diameter as a function of distance downstream of the nasopharynx as denoted in Figure 1(a) (middle panel). As expected, Model 1 exhibits the highest variability in reported geometric parameters. The minimum hydraulic diameter at a distance of 7 mm corresponds to the airway obstruction associated with the hanging uvula. It is interesting to note that Model 1 has substantially smaller effective flow area (i.e., dh) in the oropharynx region than Model 2. A further examination of the axial cross-sections of Model 1 in this region reveals highly irregular contours as exhibited in Slice A-A’ and B-B’ in
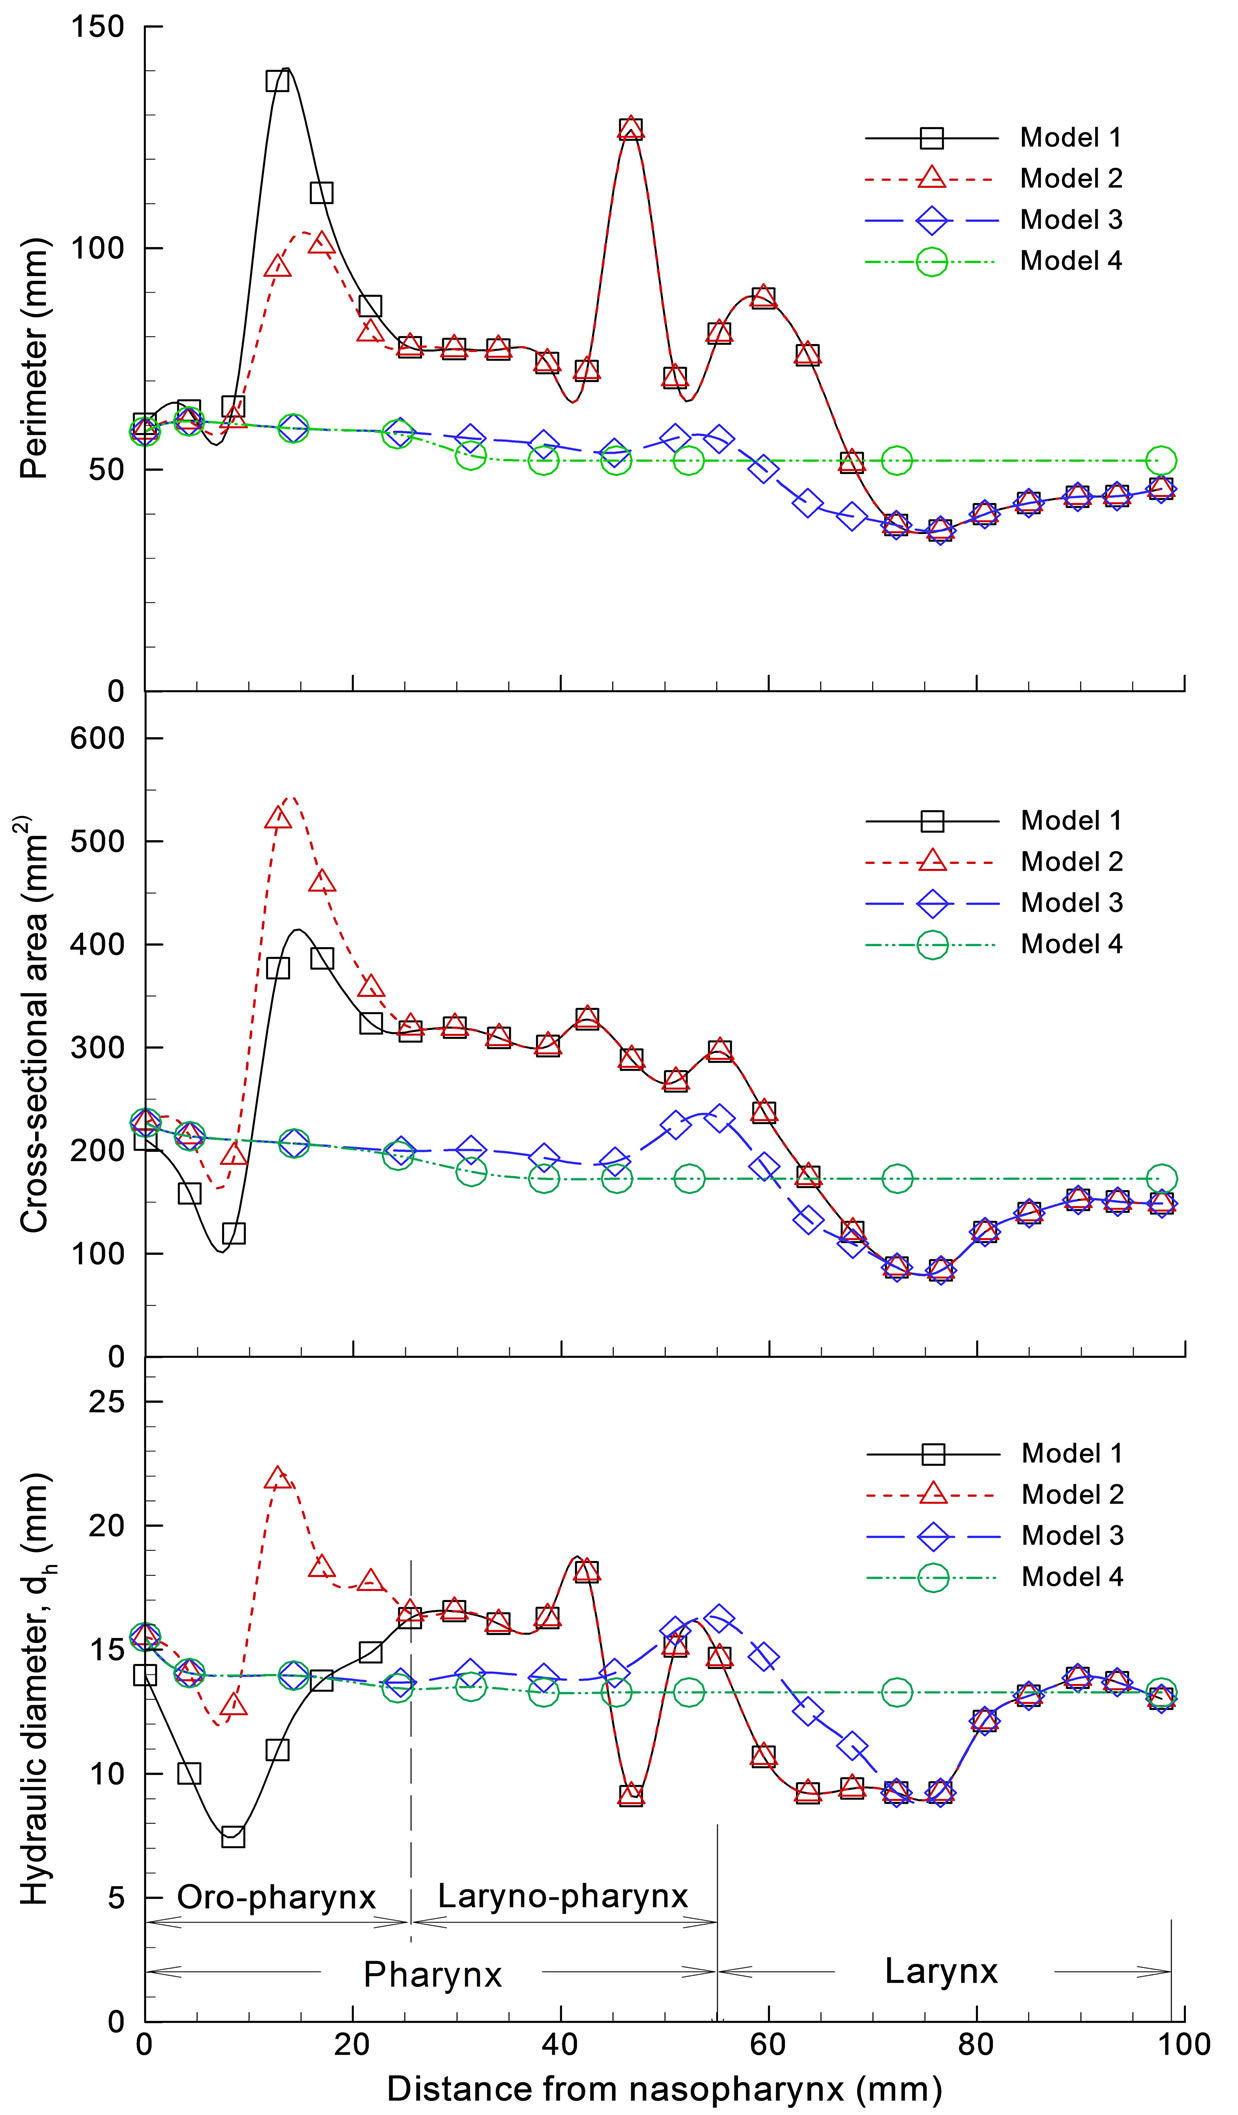
Figure 2. Airway dimensions: (a) perimeter; (b) cross sectional area; (c) hydraulic diameter.
Figure 1(a). This shape irregularity, accompanied by a much reduced effective flow area, is expected to induce significant jet effect and turbulence generation, and therefore significant energy dissipation in this region.
There is less variation in the geometric parameters of Models 3 and 4. In the laryngeal-pharyngeal region, both models (i.e., 3 and 4) have smaller flow area (dh) than Models 1 and 2. The dip in cross-sectional area at a distance of 47 mm corresponds to the epiglottis that spreads above the glottal aperture at an angle of approximately 30˚ to the posterior wall of the pharynx (Fig ure 1(a), Slice C-C’). The larynx is located at a distance of 78 mm or so downstream of the nasopharynx.
3.2. Breathing Resistance
The influence of the pharyngo-laryngeal geometries on exhalation breathing resistance is illustrated in Figure 3. Figure 3(a) shows the pressure distribution in the airway
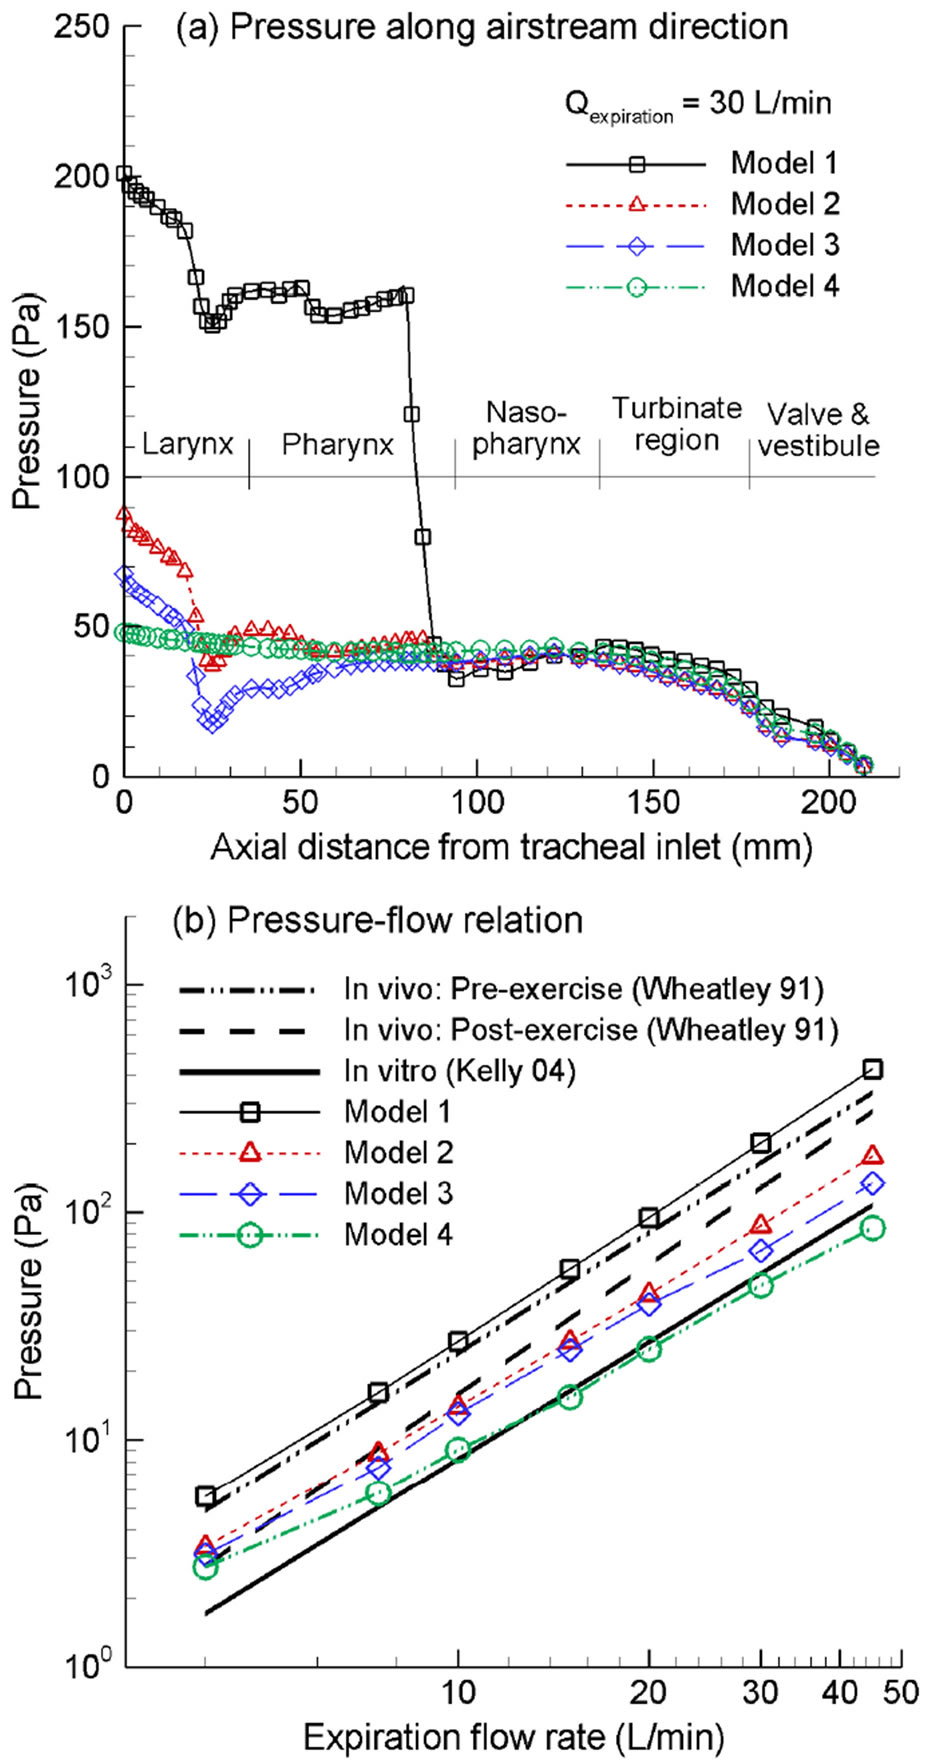
Figure 3. Expiratory pressure drop among the four nasal airway models: (a) pressure variation along the airstream direction as a function of the axial distance from the tracheal inlet; (b) expiratory pressure drop vs. flow rate with comparison to in vivo and in vitro measurements.
as a function of the axial distance from the tracheal inlet at an exhalation flow rate of 30 L/min for the four models considered. For Model 1, the maximum pressure drop is observed in the pharynx/nasopharynx region which is about 170 Pa in magnitude and is about 76% of the expiratory pressure drop between the upper trachea and nostrils. This abrupt pressure drop results from the airway obstruction as the hanging uvula partially blocks the pharyngeal passage. As discussed, Model 1 was based on images of a subject in a supine position during image acquisition. It is expected that changing from upright to supine position has the potential of causing pharyngeal obstruction as the uvula yields due to its own weight and that the degree of obstruction varies depending on the elasticity properties of the subject’s soft palate and uvula. Considering that this pressure drop is about three times that of the laryngeal region, which is the maximum of the other three models (Models 2, 3, 4), it is possible that the patient of Model 1 has an over-flexible uvula and hence a high degree of airway obstruction. Respiratory tissues in the pharyngeal region are quite collapsible. Severe pressure drop could possibly trigger or expedite the collapse of airway walls and induce the symptoms of hyponea (i.e., reduced airflow capacity) or apnea (i.e., complete airway obstruction). Meanwhile, flow instability may cause vibration of the pliable pendant uvula, resulting in snoring of the supine subject. It is therefore interesting to postulate that an over-flexible uvula may be one major reason for sleep disorders such as sleep apnea, whose constriction of the pharyngeal airway and the resultant elevated pressure drop induces further pharyngeal airway collapse.
For Models 2 and 3, which corresponds to the upright position, the glottis and nasal cavity each constitutes a breathing resistance of about 50 Pa. However, there is less pressure recovery in the pharynx of Model 2 comparing to that of Model 3. Considering the fourth model, which totally excludes the anatomical details of glottis and pharynx, there is negligible pressure drop within the larynx-pharynx region, and almost all the pressure drop comes from the convoluted nasal passages.
Figure 3(b) shows the logrithmatic diagram of the pressure drop vs. exhalation flow rate in comparison to in vitro [26] and in vivo measurements [36]. Overall, the predicted pressure drop agrees well with that of a comparable physiological condition. For example, the in vitro nasal replica in Kelly et al. [26] retains the nasal cavity only and is equivalent with Model 4 in this study. As expected, the pressure drops of the above two cases also match well. Similar observations were also found in the comparison between post-exercise in vivo data [36] and Model 2, or the comparison between pre-exercise in vivo data [36] and Model 1. Therefore, the numerical predictions appear to adequately capture the nasal breathing resistances.
3.3. Turbulent Vortices and Flow Fields
Typical coherent structures (vortices) can be identified via different methods such as eigen-helicity, Q-criterion, vorticity, l2-criterion, swirling strength, etc. Among these methods, l2-criterion has been reported in better representing the topology of vortex cores for transitional flows [37], which is the case of human respiratory flows such as in this study. Figure 4 depicts instantaneous coherent structures among the four models obtained using large eddy simulations (LES) for a steady exhalation rate
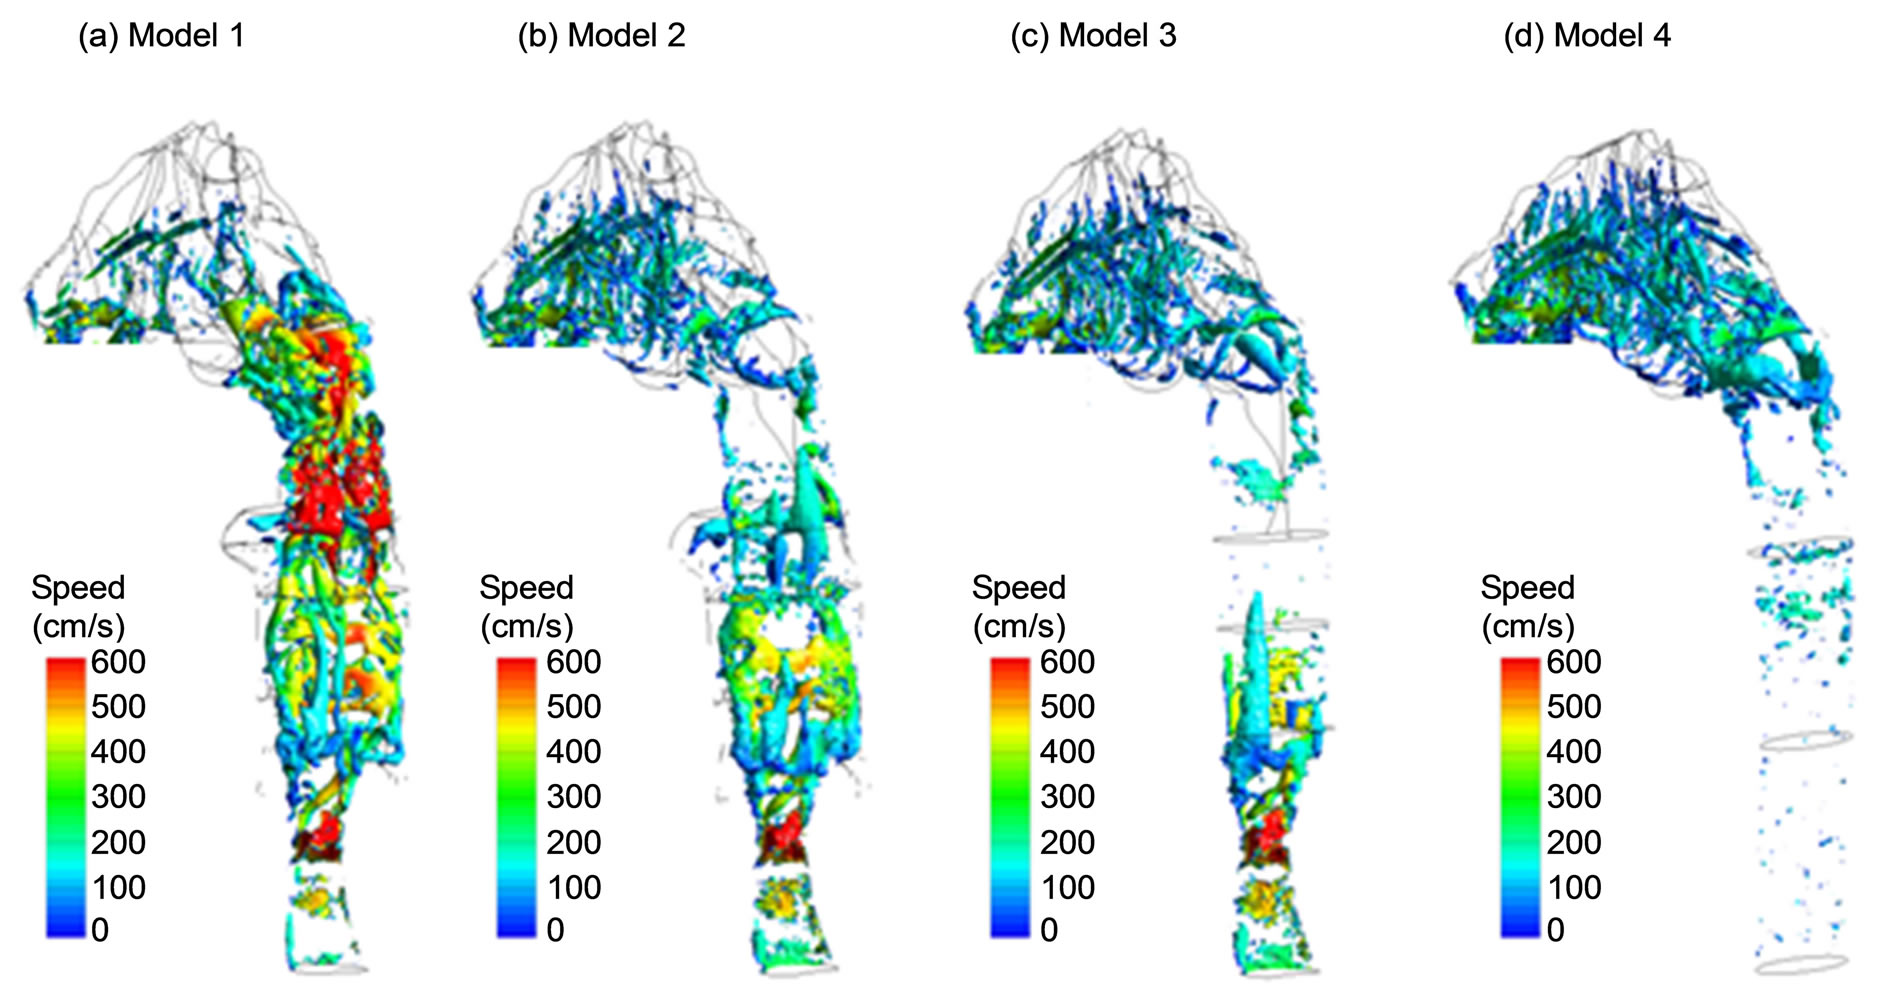
Figure 4. Instantaneous coherent structures (vortices).
of 20 L/min. These vortices are identified by the isosurfaces of l2-criterion at the magnitude of 0.013 and are colored by the local airflow speed. Three observations are noteworthy in Figure 4. First, for Models 1-3 that retain the glottal aperture, vortex rings are observed to generate at the glottis and subsequently break into stream wise vortices with the pharynx. Second, in Model 1 with uvula constriction, a second array of strong vortex rings forms around the uvula and plays an important role in quick turbulence generation and abrupt pressure drop in this region as shown in Figure 3(a). Beyond the middle nasal cavity, vortex structures decay, indicating that turbulence becomes weak and relaminarization is progressing. For the other three models without uvula constriction, similar vortex structures are observed in the nasal cavity, with standing rings that are induced by the narrow passages and streamwise vortices that are stretched along the meanstream direction. Thirdly, in Model 4 that replaces the realistic larynx and pharynx with an idealized elliptic pipe, vortices are absent in the pipe, and are limited primarily to the nasal cavity.
Representative velocity fields in the sagittal plane and at selected axial cross-sections are displayed in Figure 5 for the exhalation flow rate of 30 L/min. Complex main and secondary flow motions are observed arising from geometrical details such as glottal constriction, epiglottal recess, pharynx, and uvula obstruction. Again, the presence of uvula obstruction in Model 1 induces remarkable variations in airflows within the nasopharynx (see Slice 1’1’ in Figure 5), and to a lesser degree within the downstream nasal turbinate regions (a figure not shown here). Retaining the uvula in Model 1 significantly reduces the flow area, and splits the exhaled air into two jet flows that subsequently merge in the nasopharynx before entering the nasal passages. Meanwhile, these two jet flows need to negotiate through the 90˚ curvature in the nasopharynx. As a result, one strip of high-speed flow zone is formed near the dorsal (upper) wall of the nasopharynx in Model 1, as illustrated in Figure 5(a). In contrast, for Models 2 and 3 without uvula obstruction, airflow within the pharynx interacts with the nasal septum carina and gradually bifurcates into the two nasal passages, therefore exhibiting two velocity peaks at the side walls of the Slice 1-1’ (Figures 5(b) and (c)). Considering Model 4 that excludes both the glottis and pharynx, velocity patterns within the trachea are characterized by a developing laminar flow (Figure 5(d)). Similar as the other three models, the core flow in Model 4 is also observed to shift upward in the nasopharyngeal region due to the 90˚ airway curvature (Slice 1-1’ in Figure 5(d)).
Particle profiles prior to nasal cavity (i.e., slice 1-1’) are compared among the four models for 200 nm particles and moderate activity conditions (Q = 30 L/min), as shown in Figure 5. The particles were tracked with both mean-flow and turbulent tracking algorithms after they were released at the trachea inlet, and their locations were recorded whenever a particle crossed the sample plane (Slice 1-1’). The disparities in particle profiles are evident among the four models considered. Generally speaking, the mean flow field is a good indicator of particle transport, with elevated particle concentrations at high-speed flow zones. Considering Model 1, a stripe of dense particles is observed the middle line of Slice 1-1’, with even higher concentration near the upper wall and
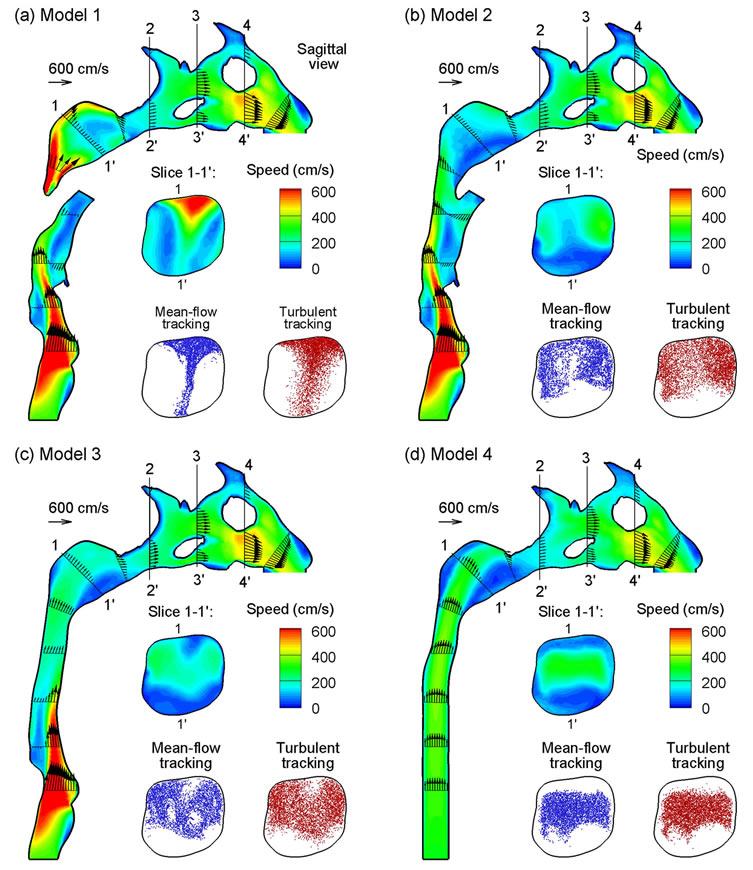
Figure 5. Velocity fields (contours and vectors) among the four models at an exhalation flow rate of 20 L/min in sagittal and cross-sectional (coronal) views.
nearly no particles at two lateral sides. As a result, stronger interactions between the particulate-laden fluid and the nasal septum carina ridge are expected for Model 1 than the other three models, leading to enhanced particle deposition in the carina and nasal septum. In the absence of uvula obstruction, quite similar particle profiles develop in Models 2 and 3, with high concentration of particles at the two lateral sides of the Slice 1-1’. Furthermore, high concentration of particles are also observed in the immediate proximity to the upper wall of Models 2 and 3, presumably due to outward secondary motions and turbulent dispersions. In contrast, the developing laminar boundary layer in the larynx region of Model 4 keeps the particle from reaching the wall surface (see Figure 5(d), Slice 1-1’). In comparison to meanflow tracking, the seemingly more random particle distributions with turbulent tracking indicates strong influences from local vortical flows in this region, as depicted in Figure 4. However, it should be reminded that local particle profiles are a function not just of the local flow conditions, but of the entire flow history that the particles have experienced.
Downstream of the nasopharynx, particles enter the narrow convoluted turbinate passages and start to fill up the projecting meatus driven by the secondary flow motions. To quantify the influence of the flow fields inside the nasal passages, the Slice 3-3’ of the four models as defined in Figure 5 is further divided into four sections, namely the inferior, middle, superior meatuses, and the median passage. Figure 6 shows the flow partition percentage through each section in the right nasal passage of the four models at an exhalation flow rate of 20 L/min. It
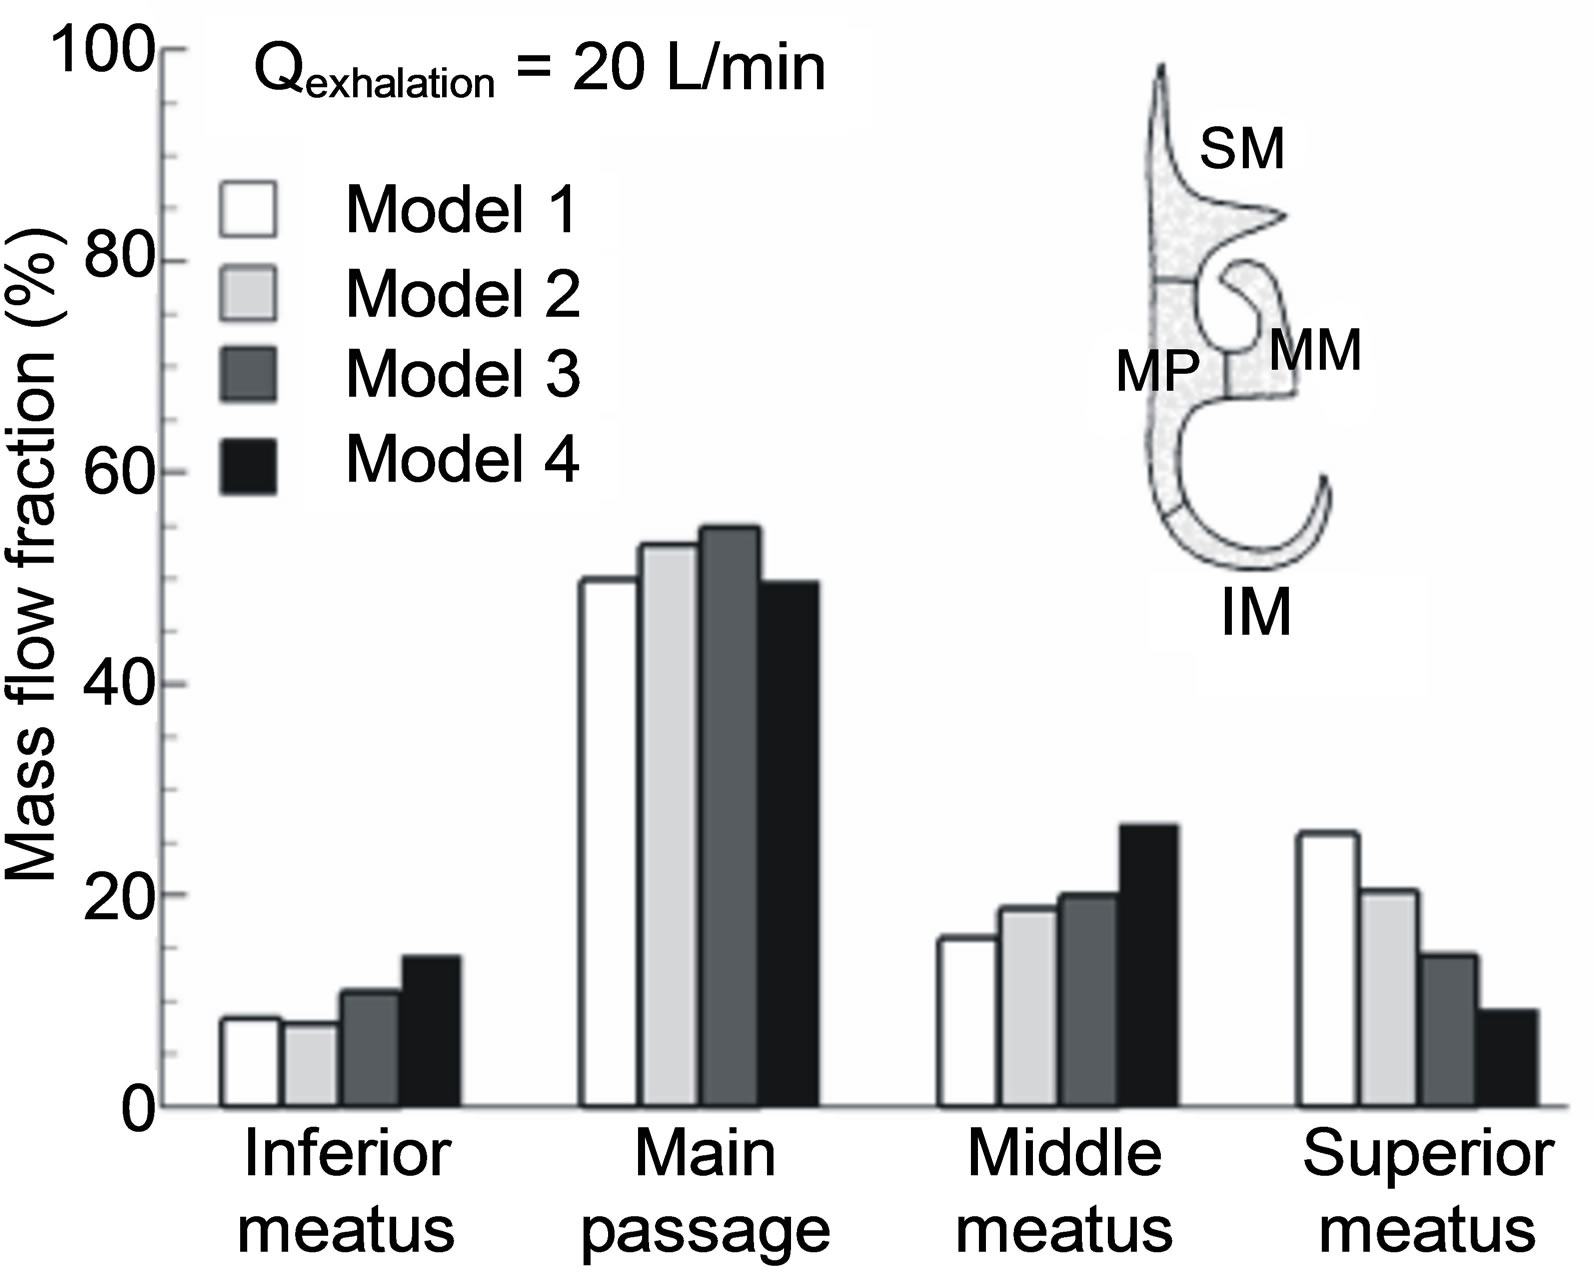
Figure 6. Flow partition into designated sections in the turbinate region. Sections of interest consist of medial passage (MP), superior meatus (SM), middle meatus (MM) and inferior meatus (IM).
is not surprising that in Model 1, whose core flow at Slice 1-1’ shifts toward the upper wall, the inferior meatus receives the minimum flow partition while the superior meatus receives the maximum. On the other hand, in Model 4, the maximum flow portion is observed in the inferior meatus while the minimum in the superior meatus. Further, the middle meatus of Model 4 receives more flow than that of any other three models. It is of special interest to examine the flow partition into the superior meatus where the olfactory nerves are cached and smell can be sensed only when chemical particles or vapors reach these nerves. Taking Model 2 (i.e., upright position without geometry simplification) as the reference, the flow deviation of the models 1, 3, 4 from 2 in the superior meatus is +27%, −30%, and −55%, respectively. In light of Model 4, excluding the larynx and pharynx will significantly underestimate the flow rate that could reach the olfactory nerves.
3.4. Particle Deposition
Numerically determined deposition fractions in the four models for exhalation flow rates of 10 and 20 L/min and particle sizes of 1 - 1000 nm were presented in Figure 7. They were also compared with in vitro deposition data obtained in geometrically comparable nasal replicas [7,8]. As expected, the deposition rate decreases with increasing particle size and flow rates due to decreased molecular diffusivity particle residence times, respectively. Considering that the computational geometry of this study and the nasal replica ANOT2 (Adult-Nasal-Oral-Tracheal) [7] were both constructed based on the same set of nasal images, a direct comparison of deposition data between computational and in vitro data is possible. As shown in Figure 7, the predicted deposition results appear to provide a reasonable match with in vitro measurements with slight under predictions by the numerical models. Specifically, for an expiratory flow rate of 10 L/min, the simulation results in the realistic model (Model 1) agree with the ANOT2 data to a high degree.
Concerning the geometric effects, deposition rates are observed to decrease progressively from Model 1 (the most complex) to Model 4 (the least complex). It is interesting to note that, for an identical particle size and flow rate in this study, the disparity in deposition (or airflow) between any two models can only result from their geometric variations. Therefore, respiratory anatomy such as uvula, pharynx, and larynx can be isolated to investigate its effect upon airflow and depositions by comparing two consecutive models. For example, the influence of the throat, which induce a turbulent laryngeal jet and subsequently enhanced convection and turbulent dispersion, can be quantified by comparing depositions between Models 3 and 4. Based on this idea, the relative impact of the uvula constriction considered in this study is found to be slightly larger than that of the larynx, which is further larger than that of the pharynx. Furthermore, considering that the pressure drop also decreases progressively in the four models with reducing geometric realism, the scatter of deposition fractions among the four models in Figures 7(a) and (b) can be largely collapsed by normalization with the pressure drop of each model (Figures 7(c) and (d)), suggesting that pressure drop (dp) might be a good indicator of the geometric variations among the four models.
To further evaluate the geometrical effects, the computational and experimental results are plotted as a function of two different diffusion parameters with and without including the pressure drop effect. Exhalation flow rates considered herein include 4, 7.5, 10, 15, 20, 30, and 45 L/min with particle sizes ranging from 1 to 1000 nm. The first parameter (i.e., x1 = D0.5Q−0.28), which was first proposed by Cheng et al. [38] and was well adopted in later studies [15,24], signifies the dependence of nanoparticle depositions on particle diffusive properties (“D” with an exponent of 0.5, molecular diffusion) and breathing conditions (“Q” with an exponent of 0.28, convective diffusion). In order to account for the geometric variations of the four models consider, a new correlation parameter with the form (x2 = D0.5Q−adpb) was introduced, with “dp” signifying the geometric effects, and “a, b” being constants to be determined. Accordingly, a new correlation format, DF = 1 − exp(−cD0.5Q−adpb), was used to regress the expiratory simulation data in the four computational models. The best-fit values of a, b and c were 20.8, 0.62 and 0.07, respectively, suggesting insignificant influences upon the total deposition fraction from the laryngopharyngeal anatomical details. The resulting correlation for expiratory deposition for submitcrometer aerosols in the nasal-laryngeal airway is expressed,
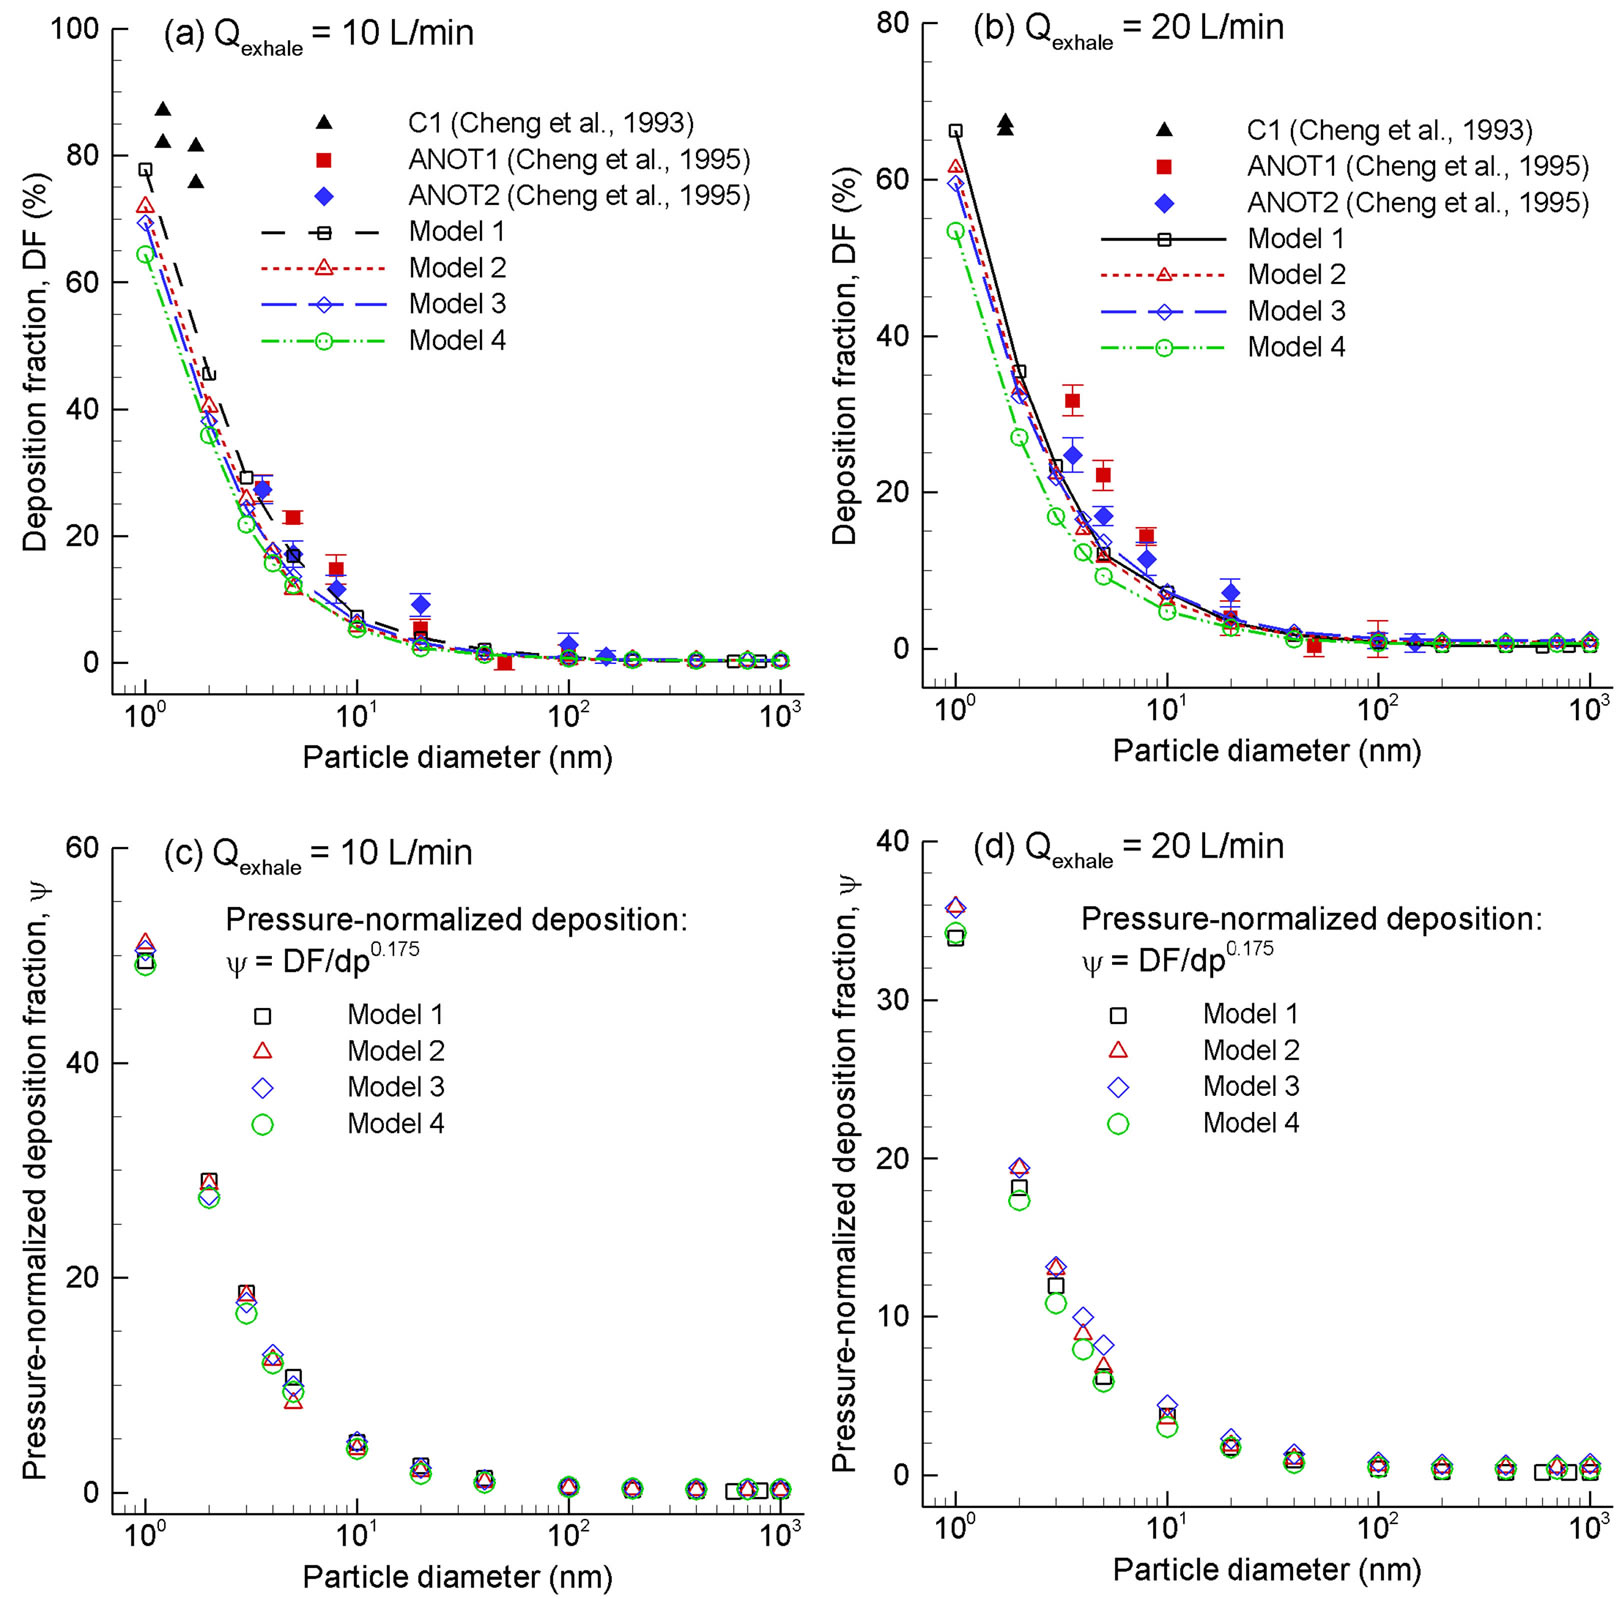
Figure 7. Predicted deposition fractions vs. particle diameter for submicrometer aerosols in the four models for an expiratory flow rate of (a) 10 L/min and (b) 20 L/min. Good agreement is obtained between predictions and in vitro measurements. The deposition rates can be collapsed by being normalized by the pressure drop (dp), suggesting that dp might be a good indictor of the geometric differences among the four models, (c) 10 L/min and (d) 20 L/min.
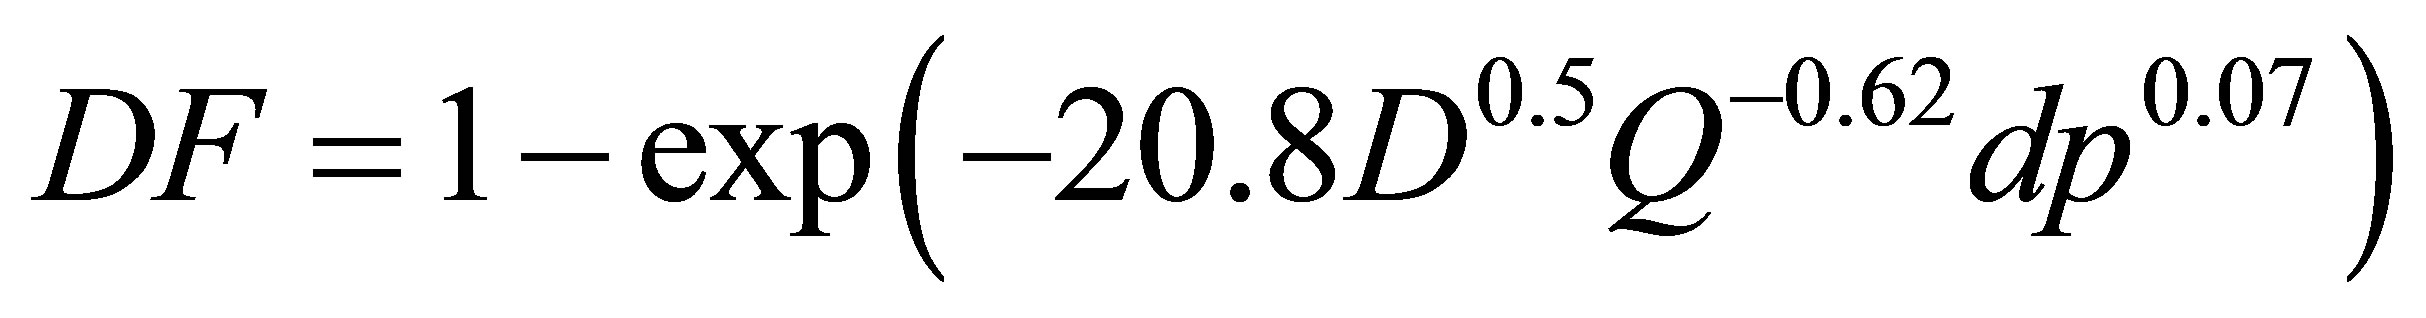 (1)
(1)
As shown in Figure 8, inclusion of the pressure drop results in a more precise approximation of the numerically predicted deposition data.
3.5. Sub-Regional and Local Depositions
The sub-regional deposition of sub-micrometer particles in different sections of the nasal cavity is shown in Figure 9 at an exhalation flow rate of 20 L/min. The designnated sections include, in an order of the distance from the nostrils, the vestibule, nasal valve region (VR), turbinate region (TR), olfactory region (OR), and nasaopharynx (NP). Four particle sizes were considered that include particles in both ultrafine (5 nm, 40 nm) and fine (200 nm, 1000 nm) regimes. One observation from Figure 9 is the significantly higher nasopharynx (NP) deposition of Model 1 than the other three models for particles of 40, 200, and 1000 nm. Our previous studies indicate that aerosols as small as 40 - 50 nm start to exhibit non-negligible inertial effect and will affect deposition via a concurrent mechanism of both impaction and diffusion [33,39]. In the case above, dramatic impactions are expected upon the dorsal walls of the nasopharynx in Model 1 from the particulate-laden jet flows generated by the severe uvula constriction, resulting in much elevated depositions in this region. We do not observe the same high level of NP deposition in Model 1 for 5 nm particles owing to their negligible inertial effects. Another interesting observation is that Model 3 and, to a lesser degree, Model 2 persistently receives higher dosage in the turbinate region among the four models considered. This difference may presumably be traced back to the airflow and particle profiles inside the nasopharynx
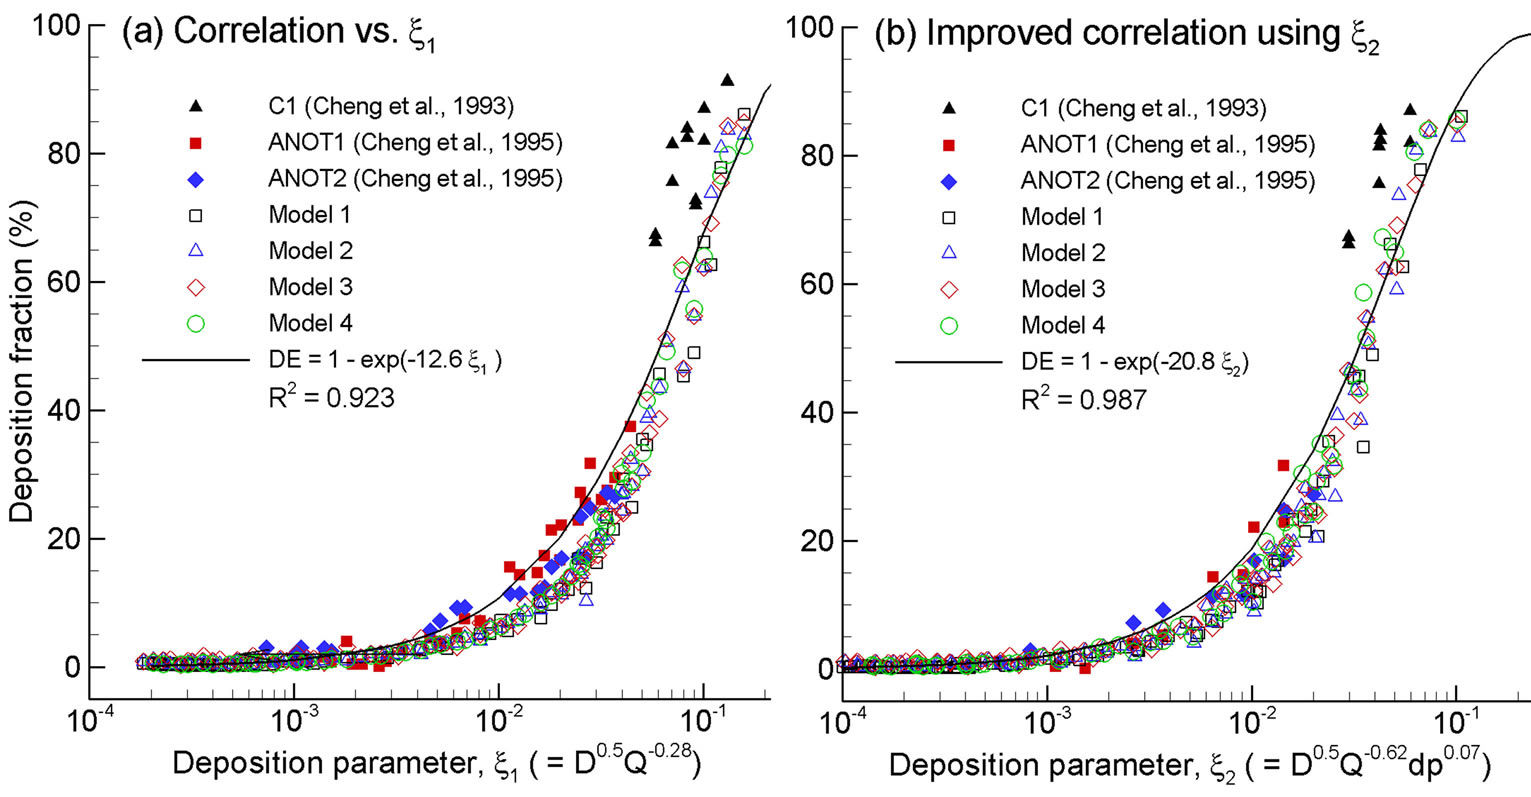
Figure 8. Improved empirical correlation by including the pressure drop in the diffusive deposition parameter: (b) D0.5Q−0.62dp0.07 vs. (a) D0.5Q−0.28.
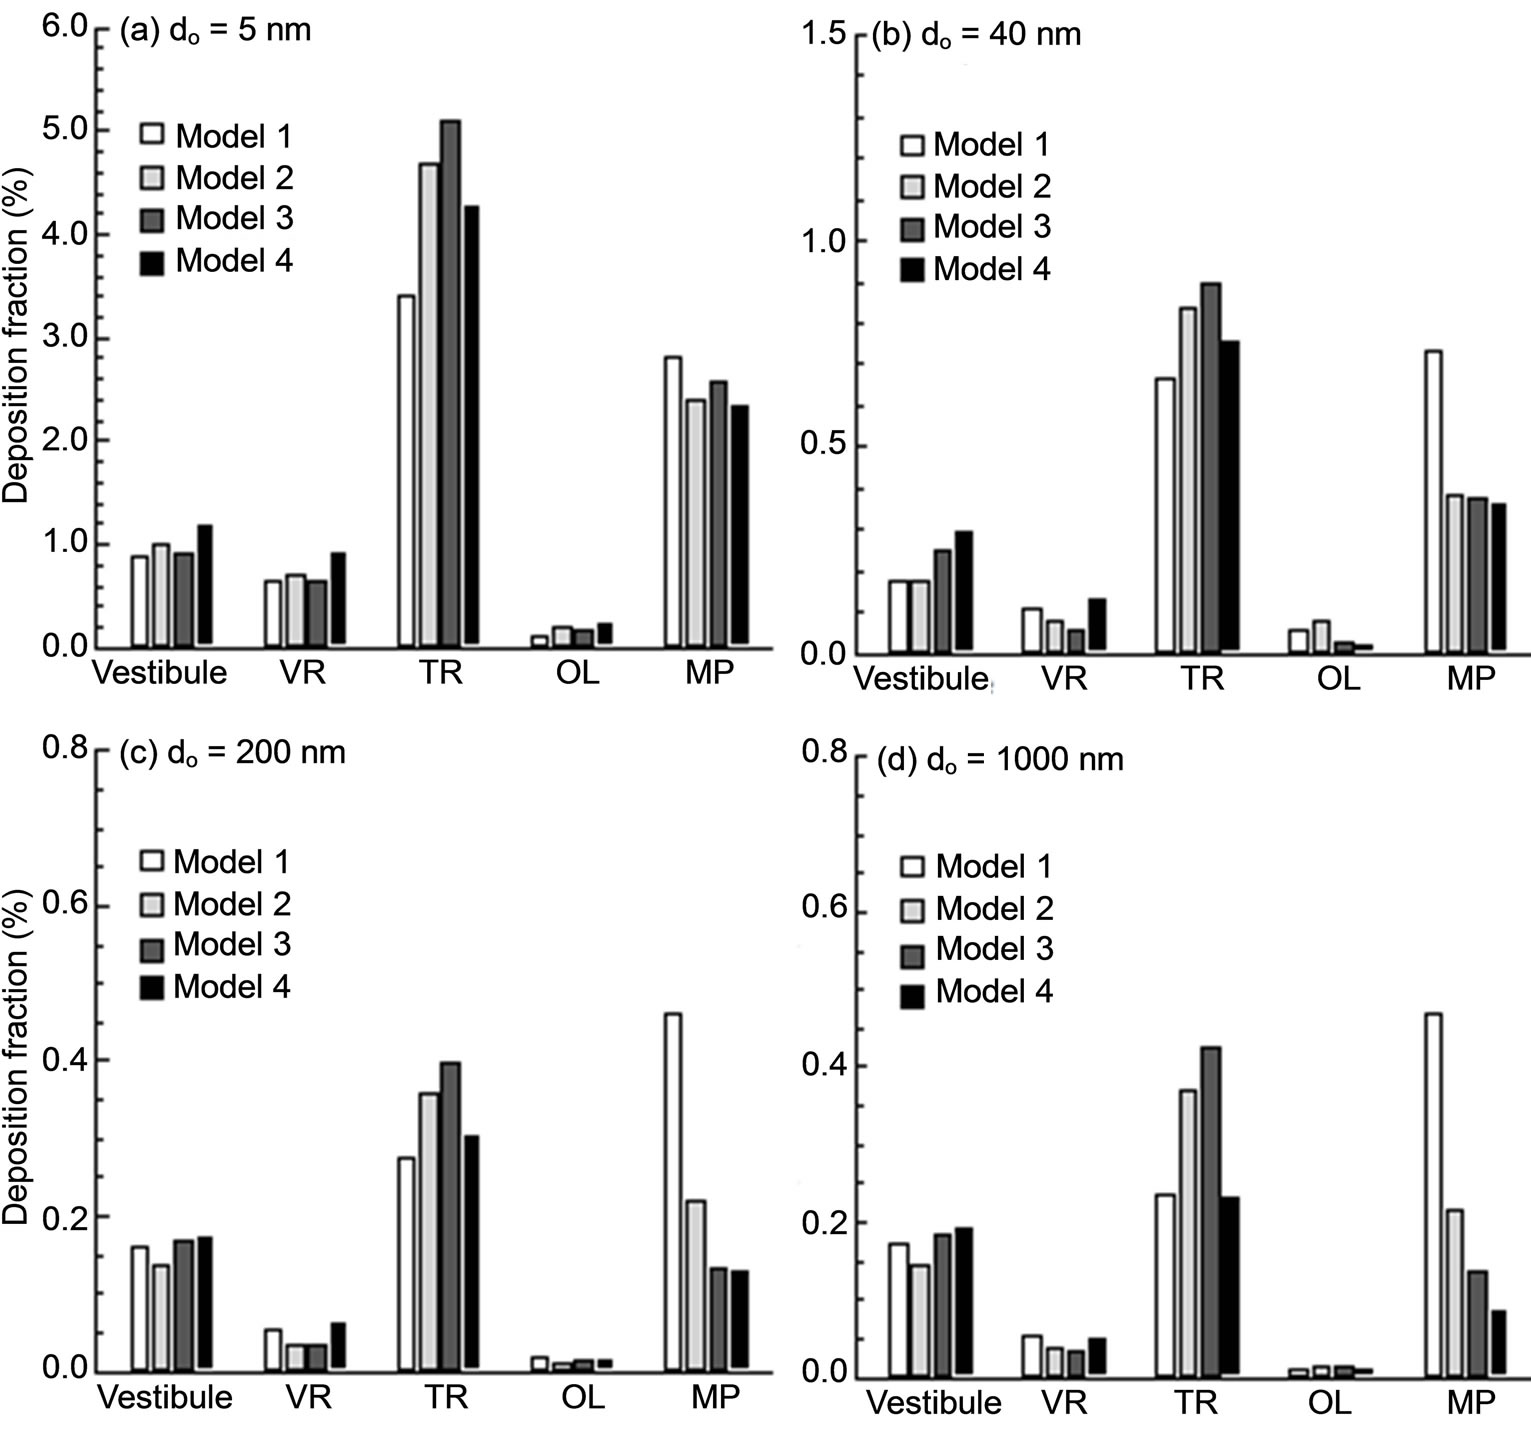
Figure 9. Sub-regional deposition fractions.
before entering the nasal turbinate region. As discussed, there are two discrete peaks of airflow speed and particle concentration occurring at both lateral side of Slice 1-1’ in Models 2 and 3, which are absent in the other two models (Figures 5(b) and (c)). These two peaks, which are generated by the flow-carina interaction, convey airflows and particles into the turbinate region in a more evenly distributed manner that favors more particle contact in this region. This presumption is also corroborated by the higher flow partitions of Models 2 and 3, as shown in Figure 6. As regard to the nasal vestibule and valve regions, the variation of depositions is less pronounced and displays an irregular pattern as well. This result is reasonable because the upstream influences of both airflow and particles are nearly damped out when reaching these two regions after traveling through the narrow convoluted passages of the nasal turbinate.
To highlight the laryngopharyngeal anatomical effect on microdosimetry, deposition enhancement factor (DEF) values in the four models are illustrated in Figure 10 for light activity conditions (Qex = 20 L/min) and 200 nm particles. As discussed, the DEF parameter quantifies aerosol accumulation with respect to the overall deposition rate and denotes the microdosimetry on the local tissue of interest. The maximum DEF value in Model 1 occurs at the carina ridge of the nasal septum (DEFmax = 269) and is nearly one order of magnitude larger than the maximum values for the other three models (DEFmax = 31 - 49). Minimum DEF values are observed in Model 4, representing a conservative estimate of particle localization in nasal passages. In view of the enhanced deposition locations, or hot spots, DEF patterns vary significantly among the four models considered. In general, the hot spots are observed to shift from the nasal septum outward to the lateral walls and from the nasopharynx toward the anterior turbinate. In contrast to the nasal septum (and carina ridge in particular) for Model 1, hot spots are observed mainly at the caudal turbinate regions in Models 2 and 3. Besides, the extent of particle deposition in these two models appears more widespread than that in Model 1. This deposition spreading is more pronounced in Model 4 (i.e., the most simplified geometry), which displays hot spots throughout the whole turbinate region.
4. Discussion
In this study, the effects of laryngopharyngeal geometries on expiratory airflow and aerosol depositions in the nasal cavity have been assessed in four model geometries. The most realistic model considered was constructed based on medical images of two health human subjects and was intended to be physiologically accurate with minor surface smoothing and simplifications. The other three models were generated from successive simplifications of the realistic model so that functions of one particular airway anatomy could be isolated for examination, namely the uvula, pharynx, and larynx. Respiratory airflow dynamics for the four models have been considered in terms of breathing resistance and airflow distribution under different activity conditions. Particle transport and deposition was evaluated for submicron aerosols using
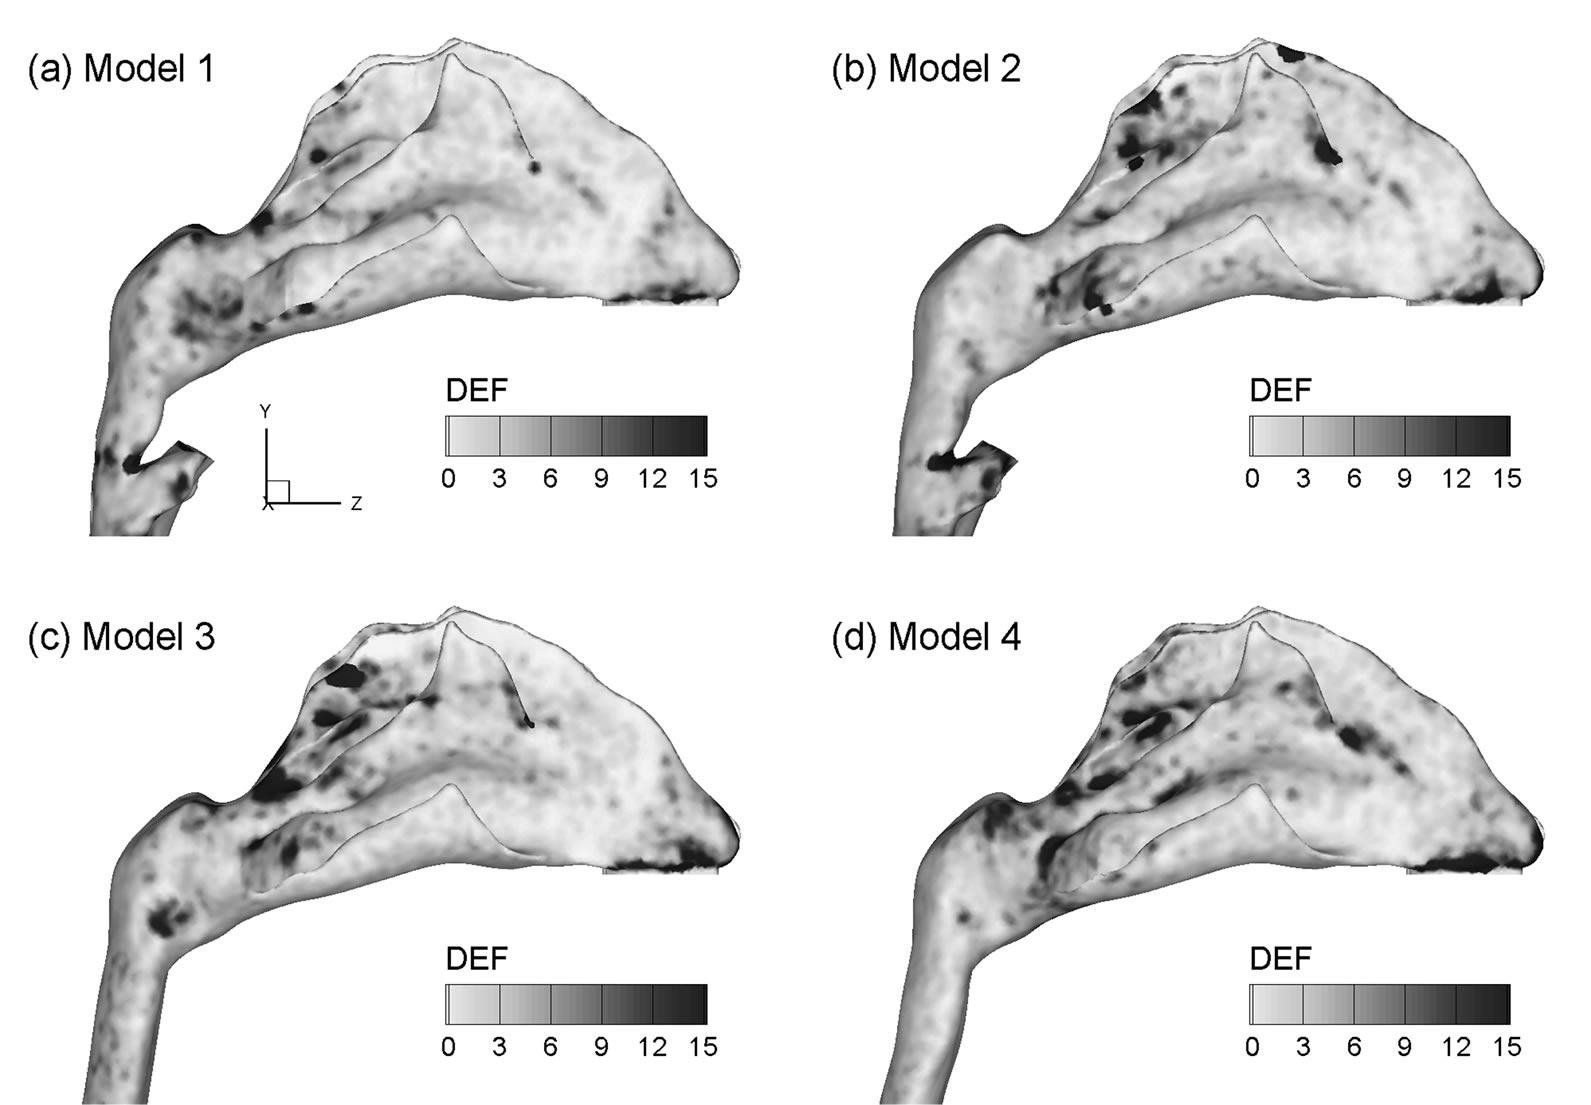
Figure 10. Deposition enhancement factors (DEF) in the four airway models for 200 nm aerosols for an exhalation flow rate of 20 L/min.
the discrete Lagrangian tracking approach on a regional, sub-regional and highly localized basis. Overall, the geometry modifications considered were found to exert substantial effects upon exhaled airflow and particle profiles within the nasal-laryngeal airways, but at varying degree of importance. Among the three anatomies studied (uvula, pharynx, and larynx), the pharynx has a much lesser impact on the airflow and particle deposition than the hanging uvula and the glottal aperture, both of which induce high velocity jet-flow and enhanced turbulent mixing. Furthermore, the variation of the uvula position remarkably alters the breathing resistance, and may constitute a major reason for sleep disorders such as snoring and apnea symptoms. For exhaled respirable aerosols, we did not observe large effects from the upstream geometrical details upon the total deposition rate in the nasal cavity. However, the local deposition patterns vary noticeably , with deposition hot spots shifting outward from nasal septum to side walls and forward from nasopharynx to the anterior turbinate as the upstream geometries being progressively simplified. In addition, the two realistic models (i.e., Model 1 and 2) provided the closest prediction of the total deposition rates in comparison to experimental data, while the most simplified model (i.e., Model 4) gave the worst agreement.
Breathing resistance was found to be highly sensitive to the position of uvula. Significantly elevated pressure jump was captured in the realistic model (i.e., Model 1) due to the uvula obstruction in the nasopharynx. This model was developed from medical images of a 53-yearold male in supine position. Therefore, the uvula-associated flow constriction may result from the combination of an over-flexible soft palate and its own weight that make the uvula hanging over the nasopharynx. Airway tissues in the nasopharynx and pharynx region are normally flexible. Dramatic pressure change may induce further collapse of the airway walls and, in the worst scenario, causes complete obstruction of the airway (i.e., sleep apnea). In addition, turbulent flows may cause fluctuations quivering of the flexible hanging uvula, producing snoring symptoms of the sleeping subject. Based on the above observations, it appears that an over-flexible uvula and weak pharynx walls are two major causes of the sleep apnea and snores [40,41]. The patient in this study (a 53-year-old male) was radiologically diagnosed because of health problems other than sleep apnea or snoring; therefore, no medical record is available at this moment to corroborate the above hypothesis. However, at senior ages as that of the patient concerned or even older, people possess higher possibilities in developing weaker soft palate and pharynx walls, and subsequently higher chances to have sleep apnea or snoring symptoms [42,43].
While multiple empirical correlations of nasal nanoparticle depositions exist, very few correlations including intersubjective variability have been reported. A critical issue in considering this variability is to determine the appropriate parameters that can adequately account for the respiratory physiological differences between different subjects. This parameter could be biological data such as age, height, weight, head circumference, respiratory rate, or nasal airway dimension itself such as volume, surface area, hydraulic diameter, or even a combination of them. From this study, pressure drop appears to be an appropriate candidate to account for the inter-subject geometric variations in light of the fact that the flow history experienced across the entire airway is inclusively characterized by its pressure drop. This does not necessarily imply that pressure drop can replace the flow rate Q in (D0.5Q−0.28) in correlating submicrometer depositions. Rather, the pressure drop is introduced as a new parameter to account for the geometry effect, whereas the flow rate Q accounts for the breathing condition (convective diffusion), and the diffusion coefficient D for the particle properties (molecular diffusion). In this study, by including the pressure drop in the diffusion factor (i.e., D0.5Q−0.62dp0.07), the relevant deposition mechanisms has been shown to be better captured (R2 = 0.987 vs. 0.923 in Figures 8(b) and (a)). The resultant exponent of each parameter signifies the relative effect from that parameter, with large effect from breathing condition (Q exponent = 0.62) and particle diffusive properties (D exponent = 0.5) and small effect from geometry details (dp) for submitcrometer particles. Even though the pressure drop has been a candidate in correlating deposition data (e.g., Dadpb for ultrafine, and  for micrometer particles) [38,44-47], no other study has been reported that utilizes (DaQbdpc) to differentiate the effects from the particle properties (D), breathing condition (Q), and geometric variation (dp), respectively.
Effects of the upstream geometrical realisms on localized deposition in the nasal airway were found to be more dramatic than on regional averages. The locations and extents of the deposition hot spots are significantly different in the four models considered. Microdosimetry is critical in accurately predicting dose-outcome relations in case of rapid absorbed components and fast acting relief medications. Results of this study demonstrate a significant difference in the occurrence of particle localization or hot spot formation in the airways of varying physical realism. As a result, models that are intended to predict cellular dose and response for rapidly absorbed components should preserve a high degree of geometric details even of the upstream anatomies. Interestingly, enhanced particle localizations were observed to be closely coincident with the regions of strong vortex structures (Figures 4 vs. 10).
One uncertainty that may cause the predictions to differ from in vivo conditions is the actual uvula position during normal expiratory breathing. The current pharynxgeal-laryngeal model was based on CT images acquired with the patient in the supine position and at the end of exhalation. It is likely that the actual upper airway geometry over the exhalation period with an upright position is different from the current model. In particular, the uvula is a highly dynamic structure whose position predominately influences the nasopharynx lumen, and subsequently the airflow and particle profiles entering the nasal cavity during exhalation. In this study, the uvula is positioned within the dorsal nasopharynx and divides the nasopharynx into two narrow channels. The resultant flow acceleration and turbulent dispersion may significantly alter the deposition in the downstream nasal cavity of particles entrained in the exhaled stream.
Other factors that limit the physiological realism of the current study include the assumptions of steady flow, simplified inlet conditions, a smooth and rigid airway surface, no humidity, and a constant glottal aperture and nasal valve for various breathing conditions. Other studies have highlighted the physical significance of transient breathing [13,48], inlet velocity profiles [49,50], nasal wall motion [51], glottal aperture variation [2], and nasal valve change during respiratory maneuvers [52,53]. Moreover, the nasal cavity model in this study is based on images of a single subject, which does not account for intersubject [54] variability.
In conclusion, the laryngopharyngeal anatomical details have been shown to dramatically alter breathing resistance and cellular-level deposition values in nasal airways during exhalation. Breathing resistance was found to be highly sensitive to the position of uvula, which might be a major cause of snoring and obstructive sleep apnea syndrome for patients with an over-flexible soft palate and weak pharynx walls. Even though the total nasal depositions was largely unaffected by the upstream geometrical details, the local deposition patterns, or hot spots, vary considerably. Results of this study indicate that the larynx and pharynx should be retained in order to reliably predict cellular-level dosages, and that patient-specific scan-based airway models are necessitated if respiratory functions in a pathological or postersurgical situation are at stake. Further numerical analyses are needed to better evaluate the effects of tidal flows, compliable walls, variable glottal aperture and nasal valve, and intra-subject variability before the results can be transformed to clinical diagnosis, treatment and presurgical planning.
REFERENCES
- T. B. Martonen, “Mathematical-Model for the Selective Deposition of Inhaled Pharmaceuticals,” Journal of Pharmaceutical Sciences, Vol. 82, No. 12, 1993, pp. 1191- 1199. http://dx.doi.org/10.1002/jps.2600821202
- T. Brancatisano, P. W. Collett and L. A. Engel, “Respiratory Movements of the Vocal Cords,” Journal of Applied Physiology, Vol. 54, No. 5, 1983, pp. 1269-1276.
- K. H. Cheng, Y. S. Cheng, H. C. Yeh, R. A. Guilmette, S. Q. Simpson, S. Q. Yang and D. L. Swift, “In Vivo Measurements of Nasal Airway Dimensions and Ultrafine Aerosol Depositing in Human Nasal and Oral Airways,” Journal of Aerosol Science, Vol. 27, No. 5, 1996, pp. 785-801. http://dx.doi.org/10.1016/0021-8502(96)00029-8
- Y. S. Cheng, H. C. Yeh, R. A. Guilmette, S. Q. Simpson, K. H. Cheng and D. L. Swift, “Nasal Deposition of Ultrafine Particles in Human Volunteers and Its Relationship to Airway Geometry,” Aerosol Science And Technology, Vol. 25, No. 3, 1996, pp. 274-291. http://dx.doi.org/10.1080/02786829608965396
- D. L. Swift and J. C. Strong, “Nasal Deposition of Ultrafine 218Po Aerosols in Humna Subjects,” Journal of Aerosol Science, Vol. 27, No. 7, 1996, pp. 1125-1132. http://dx.doi.org/10.1016/0021-8502(96)00031-6
- Z. Lee and M. S. Berridge, “PET Imaging-Based Evaluation of Aerosol Durgs and Their Delviery Devices: Nasal and Pulmonary Studies,” IEEE Transactions on Medical Imaging, Vol. 21, No. 10, 2002, pp. 1324-1331. http://dx.doi.org/10.1109/TMI.2002.806273
- K. H. Cheng, Y. S. Cheng, H. C. Yeh and D. L. Swift, “Deposition of Ultrafine Aerosols in the Head Airways during Natural Breathing and during Simulated Breath- Holding Using Replicate Human Upper Airway Casts,” Aerosol Science and Technology, Vol. 23, No. 3, 1995, pp. 465-474. http://dx.doi.org/10.1080/02786829508965329
- Y. S. Cheng, Y. F. Su, H. C. Yeh and D. L. Swift, “Deposition of Thoron Progeny in Human Head Airways,” Aerosol Science and Technology, Vol. 18, No. 4, 1993, pp. 359-375. http://dx.doi.org/10.1080/02786829308959610
- D. L. Swift, N. Montassier, P. K. Hopke, K. Karpenhayes, Y. S. Cheng, Y. F. Su, H. C. Yeh and J. C. Strong, “Inspiratory Deposition of Ultrafine Particles in Human Nasal Replicate Cast,” Journal of Aerosol Science, Vol. 23, No. 1, 1992, pp. 65-72.
- Y. Liu, E. A. Matida, J. Gu and M. R. Johnson, “Numerical Simulation of Aerosol Deposition in a 3-D Human Nasal Cavity Using RANS, RANS/EIM, and LES,” Aerosol Science, Vol. 38, No. 7, 2007, pp. 683-700. http://dx.doi.org/10.1016/j.jaerosci.2007.05.003
- T. B. Martonen, Z. Q. Zhang, G. Yue and C. J. Musante, “Fine Particle Deposition within Human Nasal Airways,” Inhalation Toxicology, Vol. 15, No. 4, 2003, pp. 283-303. http://dx.doi.org/10.1080/08958370304458
- J. D. Schroeter, C. J. Musante, D. M. Hwang, R. Burton, R. Guilmette and T. B. Martonen, “Hygroscopic Growth and Deposition of Inhaled Secondary Cigarette Smoke in Human Nasal Pathways,” Aerosol Science and Technology, Vol. 34, No. 1, 2001, pp. 137-143.
- H. Shi, C. Kleinstreuer and Z. Zhang, “Laminar Airflow and Nanoparticle or Vapor Deposition in a Human Nasal Cavity Model,” Journal of Biomechanical Engineering, Vol. 128, No. 5, 2006, pp. 697-706. http://dx.doi.org/10.1115/1.2244574
- G. Yu, Z. Zhang and R. Lessmann, “Fluid Flow and Particle Diffusion in the Human Upper Respiratory System,” Aerosol Science and Technology, Vol. 28, No. 2, 1998, pp. 146-158. http://dx.doi.org/10.1080/02786829808965517
- P. Zamankhan, G. Ahmadi, Z. Wang, P. K. Hopke, Y. S. Cheng, W. C. Su and D. Leonard, “Airflow and Deposition of Nano-Particles in a Human Nasal Cavity,” Aerosol Science and Technology, Vol. 40, No. 6, 2006, pp. 463- 476. http://dx.doi.org/10.1080/02786820600660903
- E. A. C. Hubal, J. S. Kimbell and P. S. Fedkiw, “Incorporation of Nasal-Lining Mass-Transfer Resistance into a CFD Model for Prediction of Ozone Dosimetry in the Upper Respiratory Tract,” Inhalation Toxicology, Vol. 8, No. 9, 1996, pp. 831-857. http://dx.doi.org/10.3109/08958379609034267
- P. W. Scherer, K. Keyhani and M. M. Mozell, “Nasal Dosimetry Modeling for Humans,” Inhalation Toxicology, Vol. 6, Suppl. S, 1994, pp. 85-97.
- K. Zhao, P. W. Scherer, S. A. Hajiloo and P. Dalton, “Effects of Anatomy on Human Nasal Air Flow and Odorant Transport Patterns: Implictions for Olfaction,” Chemical Senses, Vol. 29, No. 5, 2004, pp. 365-379. http://dx.doi.org/10.1093/chemse/bjh033
- P. W. Longest and S. Vinchurkar, “Validating CFD Predictions of Respiratory Aerosol Deposition: Effects of Upstream Transition and Turbulence,” Journal of Biomechanics, Vol. 40, No. 2, 2007, pp. 305-316. http://dx.doi.org/10.1016/j.jbiomech.2006.01.006
- J. Xi and P. W. Longest, “Transport and Deposition of Micro-Aerosols in Realistic and Simplified Models of the Oral Airway,” Annals of Biomedical Engineering, Vol. 35, No. 4, 2007, pp. 560-581. http://dx.doi.org/10.1007/s10439-006-9245-y
- Z. Li, “Particle Deposition in Oral-Tracheal Airway Models with Very Low Inhalation Profiles,” Journal of Bionic Engineering, Vol. 9, No. 2, 2012, pp. 252-261. http://dx.doi.org/10.1016/S1672-6529(11)60106-6
- M. Brouns, S. Verbanck and C. Lacor, “Influence of Glottic Aperture on the Tracheal Flow,” Journal of Biomechanics, Vol. 40, No. 1, 2007, pp. 165-172. http://dx.doi.org/10.1016/j.jbiomech.2005.10.033
- J. Xi, P. W. Longest and T. B. Martonen, “Effects of the Laryngeal Jet on Nanoand Microparticle Transport and Deposition in an Approximate Model of the Upper Tracheobronchial Airways,” Journal of Applied Physiology, Vol. 104, No. 6, 2008, pp. 1761-1777. http://dx.doi.org/10.1152/japplphysiol.01233.2007
- J. Xi and P. W. Longest, “Characterization of Submicrometer Aerosol Deposition in Extrathoracic Airways during Nasal Exhalation,” Aerosol Science and Technology, Vol. 43, No. 8, 2009, pp. 808-827. http://dx.doi.org/10.1080/02786820902950887
- R. A. Guilmette, Y. S. Cheng, H. C. Yeh and D. L. Swift, “Deposition of 0.005 - 12 Micrometer Monodisperse Particls in a Computer-Milled, MRI-Based Nasal Airway Replica,” Inhalation Toxicology, Vol. 6, Suppl. 1, 1994, pp. 395-399.
- J. T. Kelly, B. Asgharian, J. S. Kimbell and B. Wong, “Particle Depositon in Human Nasal Airway Replicas Manufactured by Different Methds. Part I: Inertial Regime Particles,” Aerosol Science and Technology, Vol. 38, No. 11, 2004, pp. 1063-1071. http://dx.doi.org/10.1080/027868290883360
- J. T. Kelly, B. Asgharian, J. S. Kimbell and B. Wong, “Particle Depositon in Human Nasal Airway Replicas Manufactured by Different Methds. Part II: Ultrafine Particles,” Aerosol Science and Technology, Vol. 38, No. 11, 2004, pp. 1072-1079. http://dx.doi.org/10.1080/027868290883432
- T. Gemci, T. E. Corcoran and N. Chigier, “A Numerical and Experimental Study of Spray Dynamics in a Simple Throat Model,” Aerosol Science and Technology, Vol. 36, No. 1, 2002, pp. 18-38. 0http://dx.doi.org/10.1080/027868202753339050
- K. Oho and R. Amemiya, “Practical Fiberopitc Bronscopy,” Igaku-Shoin, Tokyo, 1980.
- Y. S. Cheng, Y. Yamada, H. C. Yeh and D. L. Swift, “Diffusional Deposition of Ultrafine Aerosols in a Human Nasal Cast,” Journal of Aerosol Science, Vol. 19, No. 6, 1988, pp. 741-751. http://dx.doi.org/10.1016/0021-8502(88)90009-2
- D. O. Rodenstein, G. Dooms, Y. Thomas, G. Liistro, D. C. Stanescu, C. Culee and G. Auberttulkens, “Pharyngeal Shape and Dimensions in Healthy Subjects, Snorers, and Patients with Obstructive Sleep Apnoea,” Thorax, Vol. 45, No. 10, 1990, pp. 722-727. http://dx.doi.org/10.1136/thx.45.10.722
- D. C. Wilcox, “Turbulence Modeling for CFD,” 2nd Ed., DCW Industries, Inc., California, 1998.
- P. W. Longest and J. Xi, “Computational Investigation of Particle Inertia Effects on Submicron Aerosol Deposition in the Respiratory Tract,” Journal of Aerosol Science, Vol. 38, No. 1, 2007, pp. 111-130. http://dx.doi.org/10.1016/j.jaerosci.2006.09.007
- P. W. Longest and J. Xi, “Effectiveness of Direct Lagrangian Tracking Models for Simulating Nanoparticle Deposition in the Upper Airways,” Aerosol Science and Technology, Vol. 41, No. 4, 2007, pp. 380-397. http://dx.doi.org/10.1080/02786820701203223
- J. Xi and P. W. Longest, “Effect of Improved Near-Wall Modeling on Micro-Particle Deposition in Oral Airway Geometries,” Proceedings ASME 2007 Summer Bioengineering Conference, Keystone, CO, 20-24 June 2007, pp. SBC2007-176227.
- J. R. Wheatley, T. C. Amis and L. A. Engel, “Oronasal Partitioning of Ventilation during Exercise in Humans,” Journal of Applied Physiology, Vol. 71, No. 2, 1991, pp. 546-551.
- J. Jeong and F. Hussain, “On the Identification of a Vortex,” Journal of Fluid Mechanics, Vol. 285, 1995, pp. 69-94. http://dx.doi.org/10.1017/S0022112095000462
- Y. S. Cheng, “Aerosol Deposition in the Extrathoracic Region,” Aerosol Science and Technology, Vol. 37, No. 8, 2003, pp. 659-671. http://dx.doi.org/10.1080/02786820300906
- J. Xi and P. W. Longest, “Numerical Predictions of Submicrometer Aerosol Deposition in the Nasal Cavity Using a Novel Drift Flux Approach,” International Journal of Heat and Mass Transfer, Vol. 51, No. 23-24, 2008, pp. 5562-5577. http://dx.doi.org/10.1016/j.ijheatmasstransfer.2008.04.037
- T. Young, L. Finn and H. Kim, “Nasal Obstruction as a Risk Factor for Sleep-Disordered Breathing,” Journal of Allergy and Clinical Immunology, Vol. 99, No. 2, 1997, pp. S757-S762. http://dx.doi.org/10.1016/S0091-6749(97)70124-6
- F. Lofaso, A. Coste, M. P. d’Ortho, F. Zerah-Lancner, C. Delclaux, F. Goldenberg and A. Harf, “Nasal Obstruction as a Risk Factor for Sleep Apnoea Syndrome,” European Respiratory Journal, Vol. 16, No. 4, 2000, pp. 639-643. http://dx.doi.org/10.1034/j.1399-3003.2000.16d12.x
- E. Lindberg, A. Elmasry, T. Gislason, C. Janson, H. Bengtsson, J. Hetta, M. Nettelbladt and G. Boman, “Evolution of Sleep Apnea Syndrome in Sleepy Snorers—A Population-Based Prospective Study,” American Journal of Respiratory and Critical Care Medicine, Vol. 159, No. 6, 1999, pp. 2024-2027. http://dx.doi.org/10.1164/ajrccm.159.6.9805070
- S. T. Pendlebury, J. L. Pepin, D. Veale and P. Levy, “Natural Evolution of Moderate Sleep Apnoea Syndrome: Significant Progression over a Mean of 17 Months,” Thorax, Vol. 52, No. 10, 1997, pp. 872-878. http://dx.doi.org/10.1136/thx.52.10.872
- L. Golshahi, M. L. Noga, R. B. Thompson and W. H. Finlay, “In Vitro Deposition Measurement of Inhaled Micrometer-Sized Particles in Extrathoracic Airways of Children and Adolescents during Nose Breathing,” Journal of Aerosol Science, Vol. 42, No. 7, 2011, pp. 474-488. http://dx.doi.org/10.1016/j.jaerosci.2011.04.002
- J. Heyder, J. Gebhart, G. Rudolf, C. F. Schiller and W. Stahlhofen, “Deposition of Particles in the Human Respiratory Tract in the Size Range of 0.005 - 15 Microns,” Journal of Aerosol Science, Vol. 17, No. 5, 1986, pp. 811-825. http://dx.doi.org/10.1016/0021-8502(86)90035-2
- R. F. Hounam, A. Black and M. Walsh, “The Deposition of Aerosol Particles in the Nasopharyngeal Region of the Human Respiratory Tract,” Journal of Aerosol Science, Vol. 2, No. 1, 1971, pp. 47-61. http://dx.doi.org/10.1016/0021-8502(71)90007-3
- G. J. M. Garcia, E. W. Tewksbury, B. A. Wong and J. S. Kimbell, “Interindividual Variability in Nasal Filtration as a Function of Nasal Cavity Geometry,” Journal of Aerosol Medicine and Pulmonary Drug Delivery, Vol. 22, No. 2, 2009, pp. 139-155. http://dx.doi.org/10.1089/jamp.2008.0713
- Z. Li and C. Kleinstreuer, “Airflow Analysis in the Alveolar Region Using the Lattice-Boltzmann Method,” Medical & Biological Engineering & Computing, Vol. 49, No. 4, 2011, pp. 441-451. http://dx.doi.org/10.1007/s11517-011-0743-1
- K. Keyhani, P. W. Scherer and M. M. Mozell, “Numerical Simulation of Airflow in the Human Nasal Cavity,” Journal of Biomechanical Engineering—Transactions of the ASME, Vol. 117, No. 4, 1995, pp. 429-441. http://dx.doi.org/10.1115/1.2794204
- R. P. Subramaniam, R. B. Richardson, K. T. Morgan, J. S. Kimbell and R. A. Guilmette, “Computational Fluid Dynamics Simulations of Inspiratory Airflow in the Human Nose and Nasopharynx,” Inhalation Toxicology, Vol. 10, No. 2, 1998, pp. 91-120. http://dx.doi.org/10.1080/089583798197772
- R. Fodil, L. Brugel-Ribere, C. Croce, G. Sbirlea-Apiou, C. Larger, J. F. Papon, C. Delclaux, A. Coste, D. Isabey and B. Louis, “Inspiratory Flow in the Nose: A Model Coupling Flow and Vasoerectile Tissue Distensibility,” Journal of Applied Physiology, Vol. 98, No. 1, 2005, pp. 288- 295. http://dx.doi.org/10.1152/japplphysiol.00625.2004
- G. P. Bridger, “Physiology of Nasal Valve,” Archives of Otolaryngology, Vol. 92, No. 6, 1970, pp. 543-553. http://dx.doi.org/10.1001/archotol.1970.04310060015005
- G. P. Bridger and D. F. Proctor, “Maximum Nasal Inspiratory Flow and Nasal Resistance,” Annals of Otology Rhinology and Laryngology, Vol. 79, No. 3, 1970, pp. 481-488.
- D. N. Pickering and C. S. Beardsmore, “Nasal Flow Limitation in Children,” Pediatric Pulmonology, Vol. 27, No. 1, 1999, pp. 32-36. http://dx.doi.org/10.1002/(SICI)1099-0496(199901)27:1<32::AID-PPUL7>3.0.CO;2-O
NOTES
*Corresponding author.