Open Journal of Medical Psychology
Vol.2 No.1(2013), Article ID:27251,7 pages DOI:10.4236/ojmp.2013.21008
Factors Determining Wait-Time and Patient Satisfaction at Post-Operative Orthopaedic Follow-Up
1Orthopedics Department, Toronto Western Hospital, Toronto, Canada
2Faculty of Medicine, University of Toronto, Toronto, Canada
Email: khalid.syed@uhn.on.ca, david.parente@mail.utoronto, Samuel.Johnson@uhn.ca, joel.davies@mail.utoronto.ca
Received October 16, 2012; revised November 23, 2012; accepted December 2, 2012
Keywords: Wait Times; Orthopedic Consultation
ABSTRACT
Introduction: There has been increasing attention on the evaluation of the efficiency and delivery of healthcare while trying to maintain the quality of service patients expect. A variety of studies have looked at various, non-orthopaedic surgical outpatient clinics and the factors involved in patient satisfaction and wait-time. The purpose of this study was to identify if such a relationship exist between the environmental, patient, and social-demographic factors to patient wait-time and satisfaction at an orthopaedic follow-up clinic. Methods: Patients were tracked through the clinic at various time points: appointment time, registration time, time to diagnostic imaging, time to being called into an exam room, time to being seen by a trainee, time to being seen by the staff surgeon, and time of leaving the clinic were collected. Overall satisfaction scores were calculated as per the VSQ-9. Patients who presented for their two or six week follow-up appointment were compared to those presenting for their three, six, or 12 month follow-up appointment. Result: A total of 80 patients were enrolled in this study. There was a good distribution of age and level of education. Ethnicity was heavily weighted towards the white population (76.6%) with the next largest ethnic group being East/Southeast Asian (7.8%). The mean total wait-time in clinic was 126.7 ± 46.5 minutes and the mean total VSQ-9 score was 78.5 ± 14.6. The longest time interval experienced by the patients in clinic was waiting for a consultation room after completion of imaging investigations (46.3 ± 33.3 min). The shortest time interval occurred once patients were in the consultation room and waited to be seen by the trainee or surgeon (15.0 ± 9.7 min. There were no statistically significant differences between the total wait-time in clinic, total VSQ-9 scores and age, gender, ethnicity, education, location of injury and overall health. Environmental variables were analyzed and it was found that patients reported greater satisfaction when seen only by the surgeon and not the trainee. Conclusion: Measurement variables have focused on patient satisfaction and wait-time as markers for improving healthcare. Although our study showed that there appears to be no association between any of the variables studied and wait-time or patient satisfaction, interventions at the patient level like using a custom designed clinic traffic flow board to track the position of each patient throughout their follow-up providing patients with a visual estimate of their position relative to other patients in queue may improve patient satisfaction and wait-time.
1. Introduction
In light of the recent difficult economic times compounded by ballooning healthcare costs, there has been increasing attention on the evaluation of the efficiency and delivery of healthcare while trying to maintain the quality of service patients expect. Therefore, wait-time in follow-up clinic has important implications, not only for the patient, but also for the hospital and healthcare system in general.
Measurement of patient satisfaction has become commonplace in many healthcare settings due to its impact on quality of care. It has been known for some time that satisfied patients are more compliant with treatmentremaining with a physician, and maintain appointments [1]. There have been many studies that have investigated the factors that influence patient satisfaction in the health care setting. However, there is still limited data related to the factors that may be important in an outpatient setting [2].
Outpatient clinics have been the subject of recent attention in the literature due to their ability to increase efficiency and reduce healthcare costs. Recent studies have shown that patient wait-time is an important indicator of patient satisfaction in plastic surgery clinics [3]. There is no reason to believe that this would be any different in the orthopedic clinic [4], Levesque et al., showed that patient expectation of time in clinic and actual clinic times were independent determinants of satisfaction. However, the actual factors associated with increased waittime in clinic have never been studied in the orthopedic population.
A variety of studies have looked at various, non-orthopedic surgical outpatient clinics and the factors involved in satisfaction. Variables that have been measured include age, ethnicity, level of education, timing of postoperative visit, overall health, and satisfaction with surgery [5,6]. There is also interest in understanding patient expectations regarding wait-time in clinic. Patient expectations have been shown to have a significant effect on satisfaction during the current visit [6]. Further, due to the nature of orthopedic surgery, many patients do not remain in the clinic for the entirety of the follow-up visit as they require other hospital services, such as diagnostic imaging. Therefore, there is also an ambulatory component to their overall clinic wait-time which is unique among the orthopedic population. Given that this population may also demonstrate difficulties with ambulation, this may be an important consideration. These factors together represent the variety of environmental, patient, and socio-demographic variables that have the potential to affect the wait-time in clinic for this post-operative orthopedic patient population.
The interest of the current study is to determine the relationships between the environmental, patient, and sociodemographic factors as they pertain to patient wait-time and satisfaction at an orthopedic post-operative followup clinic at Toronto Western Hospital.
2. Methods
The Toronto Western Hospital has been servicing the Toronto Community for more than 100 years. It is situated amongst a strong Italian, Portuguese, and Chinese community, which constitutes a large proportion of the patient population at the hospital. The clinic is staffed by the Department of Orthopaedic Surgery and provides two services for the hospital. Primarily, the clinic functions as a post-operative follow-up clinic for patients receiving surgical correction of their orthopaedic pathology. Secondarily, the clinic also serves as a referral service for the Emergency Department for patients presenting with an acute bony or ligamentous injury. The types of surgeries vary greatly within the clinic. Surgical intervention can be performed on a variety of joints and long bones and for a variety of aetiologies, including trauma, osteoarthritis, and bony angulation deformities. Although operations required on the spine and hands are also performed at the Toronto Western Hospital, they have their own separate outpatient clinics and therefore are not seen in the Fracture Clinic. The Fracture Clinic operates Monday to Friday from approximately 8 am until 5 pm depending on surgeon preference, patient scheduling, and unforeseen circumstances (including emergencies). A total of 7 orthopaedic surgeons utilize the clinic for followup of their post-operative patients.
Patients will be recruited from the waiting area of the Fracture Clinic after assessment of the eligibility criteria for the study. Patients need to be scheduled for a followup appointment for surgical or non-surgical correction of any orthopaedic pathology. Imaging must be required to take place during their current appointment as determined by the Orthopaedic Technician reviewing their file upon entry. Patients will be excluded from the study if they are unwilling to complete the surveys, cognitively impaired, non-English speaking without a suitable translator, and if they have already completed the survey at a previous appointment. Patients will also be removed from the study should they require multiple trips to the Imaging Department as part of their care.
This study employs a cross-sectional design using survey data as well as objective timestamps data for data collection. All data collected was quantitative in nature and was collected and stored in a password protected database on a secure server pending analysis [7].
At the time of arrival to the orthopaedic clinic, patients were approached and consented to participate in the study in the waiting area prior to being seen by any healthcare provider. Subjects were asked to fill out the Patient Information Survey consisting of nine questions related to their physical, environmental and socio-demographic status. At the end of their visit, patients were asked to fill out the Visit Specific Questionnaire (VSQ-9) to evaluate their satisfaction during the current visit. The satisfaction survey has been used extensively in healthcare [8,9] and was recently validated and utilized in the orthopaedic population [5].
Patients were tracked through the clinic at various time points during their visit. A member of the research team was present in clinic and capable of directly observing the time points as required. Time points were collected by hand, utilizing a face sheet that was attached to the participants’ surveys. Specifically, measured time points included: 1) appointment time, 2) registration time, 3) time to diagnostic imaging, 4) time to being called into an exam room, 5) time to being seen by a trainee, 6) time to being seen by the staff surgeon, and 7) time of leaving the clinic. Combinations of two methods were used for visualization of the time points collected. The system time was used on the electronic patient record (EPR) for collection of time variables when a computer was readily available to the observer. The EPR time is displayed on every computer machine in the department and is synchronized such that they are all equivalent at any given time point. If access to a computer was not readily available, time points were visualized and collected via an electronic time stamp machine that was carried with the observer at all times. To ensure accuracy of measurement, the device was manually synchronized with the EPR time on a daily basis upon arrival to clinic.
Analysis of data will focus on the Patient Information Survey and the relationship of these variables with the time variables collected during their visit. Overall satisfaction scores were calculated as per the instructions dictated by the VSQ-9 and was the primary measure of satisfaction used in the study as this will be useful for comparison to previously published orthopaedic studies that have evaluated patient satisfaction. In a sub-analysis, patients were stratified based on location of injury (lower limb versus upper limb) as it was hypothesized that patients with lower limb injuries may experience greater difficulty with ambulation to and from the imaging department, which may impact wait-time and satisfaction. Patients were also stratified based on follow-up interval. Patients who presented for their 2 or 6-week follow-up appointment were compared to those presenting for their 3-, 6-, or 12-month follow-up appointment. Patients returning soon after surgical intervention may require procedures prior to the scheduled appointment that may increase wait-time as well as overall satisfaction—for example, cast or suture removal.
Data was analyzed using a combination of independent samples t-test or ANOVA as appropriate. Significance level was set at (p = 0.05) level and all tests were carried out using SPSS 19 for Windows (IBM®).
3. Results
A total of 80 patients were enrolled in this study(Table 1: demographics). The response rate for the study was 98% as one patient declined to complete the survey citing a desire to keep their information private. Of the respondents, 3 subjects were excluded based on the study criteria and were not included in the analysis. Our sample included mostly females (54.5% vs 45.5%). There was a good distribution of age and level of education in the sample. Ethnicity was heavily weighted towards the white population (76.6%) with the next largest ethnic group being East/Southeast Asian (7.8%). The mean total wait-time in clinic was 126.7 ± 46.5 minutes (Figure 1: total time in clinic vs frequency) and the mean total VSQ-9 score was 78.5 ± 14.6 out of a possible score of 100 (Figure 2: total VSQ-9 score vs frequency). Specific time points for every subject were subtracted to create intervals for comparison. A total of 4 intervals were created, including time from arrival in clinic to imaging, time from imaging to placement in an examination room, time from arrival in examination room to being seen by a trainee or staff surgeon, time from arrival in examination room to being seen by the staff surgeon, and total clinic time. The results are shown in (Table 2: wait-time
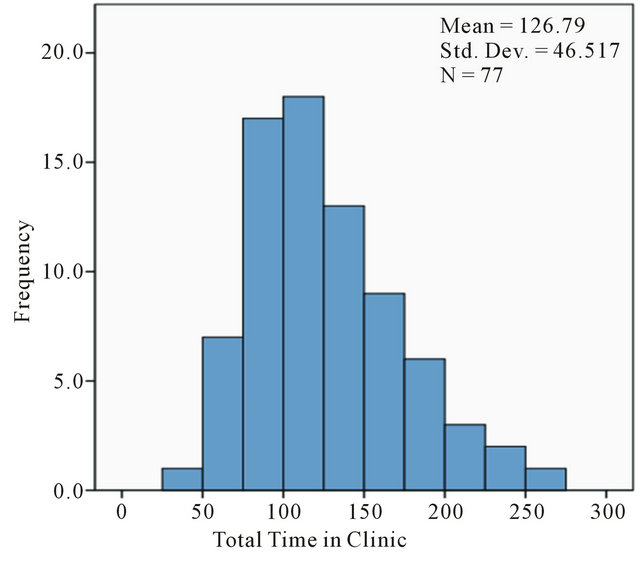
Figure 1. Distribution of wait-time in clinic.
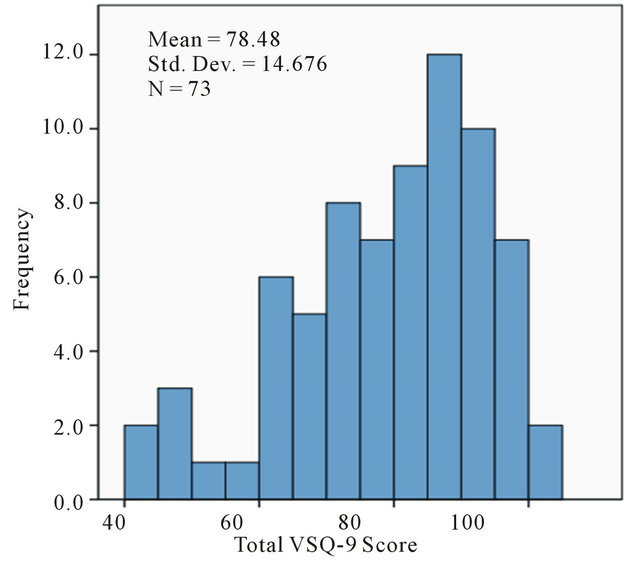
Figure 2. Distribution of total VSQ-9 scores
breakdown). The longest time interval experienced by the patients in clinic was time spent waiting for a room to become available after completion of the necessary imaging investigations (46.3 ± 33.3 min). The shortest time interval occurred once patients were in the consultation room and waited to be seen by the trainee or surgeon (15.0 ± 9.7 min). Analysis also shows a poor correlation between the patients expected wait time and there actual wait time in clinic (Tables 3 and 4: actual wait time vs expected wait time Of the sociodemographic variables studied, there were no significant differences between the total wait-time in clinic and age (p = 0.682), gender (p = 0.132), ethnicity
(p = 0.193), or education (p = 0.158). Furthermore, there was no difference between total VSQ-9 scores and age (p = 0.940), gender (p = 0.265), ethnicity (p = 0.845), and
Table 1. Sample demographics.
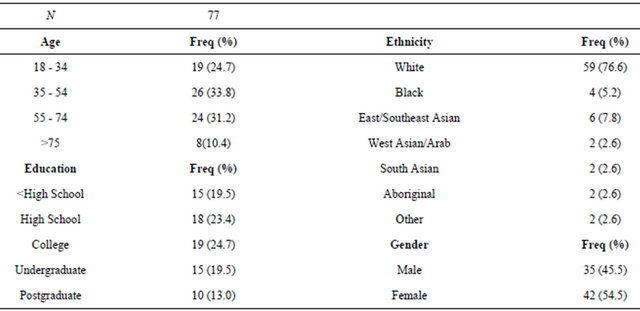
Table 2. Wait-time breakdown statistics.
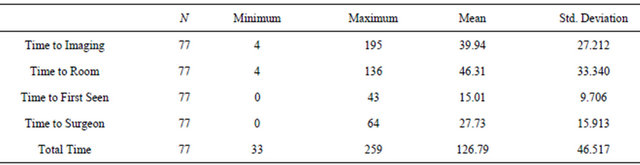
Table 3. Actual wait time.
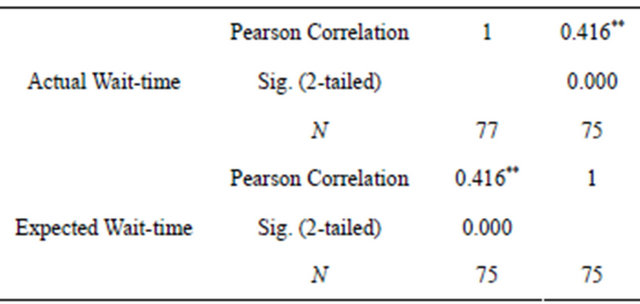
**Correlation is significant at the 0.01 level (2-tailed).
education (p = 0.360).
Of the patient variables studied there were no statistically significant differences between the total wait-time in clinic and location of injury (p = 0.074) and overall health (p = 0.313). Differences did exist between the total wait-time and follow-up interval (p < 0.001). The combined two week and 6 week group waited more than the average (147.1 ± 48.3 minutes) compared with the 3 month, 6 month and 1 year group (109.9 ± 37.8 minutes) (see Figure 3: follow-up interval vs total wait-time). There were no statistically significant difTable 4. Expected wait time.
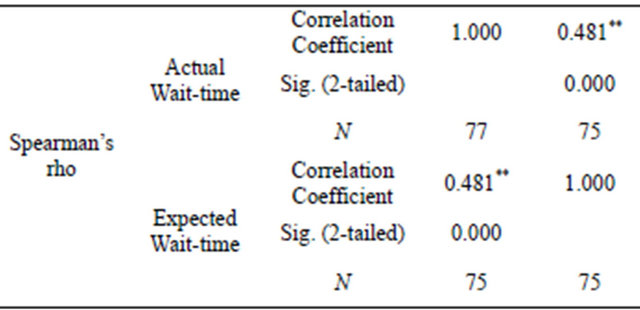
**Correlation is significant at the 0.01 level (2-tailed).
ferences between VSQ-9 scores and location of injury (p = 0.509), overall health (p = 0.196) and expectation of wait-time (p = 0.182).
Clinic environmental variables were analyzed and it was found that patients reported greater satisfaction when seen only by the surgeon and not the trainee (p = 0.042). Patients who were seen by the staff surgeon only were seen an average of 5.8 min faster (p = 0.021) from the time they entered the exam room (Figure 4: first person to see patient vs time in exam room until seen). However this effect had no difference on the total wait-time
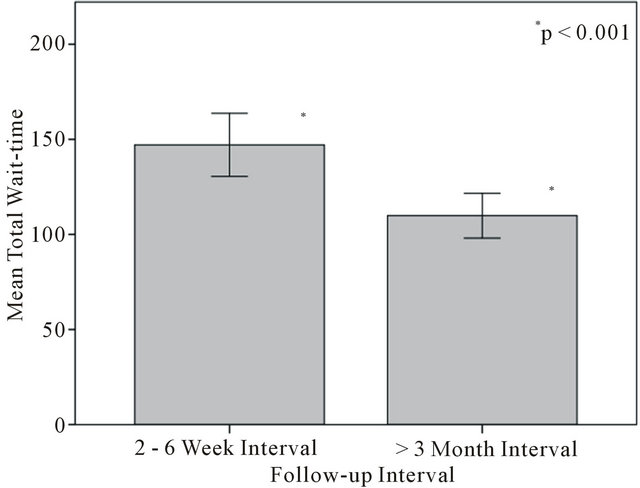
Figure 3. Follow-up interval vs total wait-time.
(p = 0.708).
4. Discussion
The sample obtained in this study limit the ability to draw conclusions based on the results. The target sample size of 345 was not reached due to the time constraints of the DOCH project. A sample of 77 patients reduced the power needed to find differences between our groups as the differences between groups is likely small compared to the large mean total wait-time. Further, sample bias was introduced into the study from a variety of sources. Our sample showed that the majority of patients were being recruited from the clinic of one surgeon (see Figure 5: distribution of subjects by surgeon vs number of subjects). This limits the ability to draw generalizations to the clinic as a whole as the preferences and practices of the staff orthopaedic surgeon have a strong influence on the organization of the clinic. The sample was also biased as patients were being preferentially recruited from afternoon clinics (see Figure 6: distribution of subjects by appointment time vs frequency). By recruiting preferentially from afternoon clinics we suspect that total wait-time could be increased as unforeseen events, emergencies, and slowdowns have the potential to overrun clinics in the afternoon. Finally, the sample was heavily biased in ethnicity towards the Caucasian population. It is known that the surrounding area has a strong Chinese population [10] which was likely underrepresented in our sample. This may be due to difficulty in finding suitable translators for these patients and therefore may have been excluded from the study.
Our study found that there were no sociodemographic variables that were able to predict satisfaction or total wait-time with our sample. This is in contrast to Chung [3] who found that age was a significant predictor of satisfaction in a plastic surgery clinic. The discordance in findings may be due to the limited sample size of our
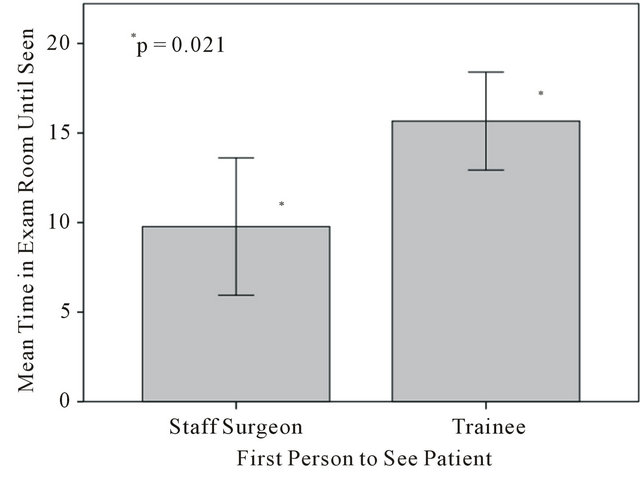
Figure 4. First person to see patient vs time in exam room untill seen.
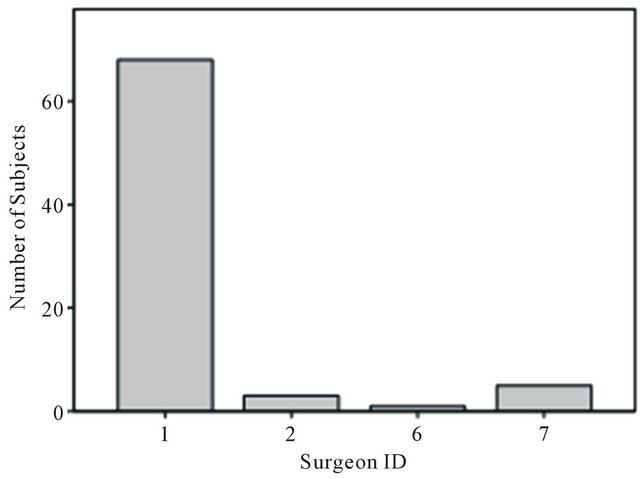
Figure 5. Distribution of subjects by surgeon.
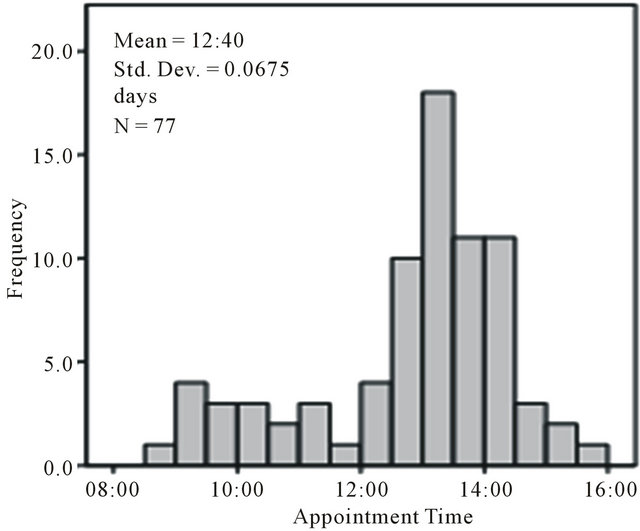
Figure 6. Distribution of subjects by appointment time.
study (N = 77 vs N = 345). The difference may also be due to the inherent differences between the age differences that present to plastic surgery clinics compared with orthopaedic clinics. Our sample population was fairly homogeneous as compared with Chung [3] who tended to have a younger population. The findings suggest that there is little intervention possible at the socio-demographic level to increase satisfaction and decrease waittime in clinic.
With respect to patient factors, follow-up interval was associated with an increased total wait-time. This is likely related to necessary clinical procedures that are required in the first months of treatment such as casting, cast removal, suture removal, and wound care as compared to patients that are greater than 3 months from their initial treatment. This difference in time required for procedures was the focus of intervention by Levesque [4] who changed the clinic booking procedures based on the estimated time required on a patient to patient basis. He showed a modest decrease in clinic wait-time of 10 minutes with a significant increase in patient satisfaction scores. This may represent a similar opportunity for waittime improvement in the Fracture Clinic.
Location of injury, overall health, and patient expectation had no effect on wait-time or satisfaction scores. Since the clinic has an ambulatory component, having to transfer from a variety of hospital services and locations, it was thought that the ability to ambulate would have an effect on wait-time and thus satisfaction. The lack of association between patients who have had an upper or lower body injury and wait-time may be due to the magnitude of the effect with a low study power. Alternatively, since the clinic is in a hospital there may be adequate resources and assistive devices available to obliterate the effect.
Interestingly, patients who saw only the staff surgeon reported greater satisfaction than if being seen by the trainee. The difference may be secondary to being seen sooner after being brought into the examination room rather than due to the trainees themselves. There was no difference in the total wait-time in clinic between the two groups, which may indicate that a recall bias may exist when filling out the satisfaction survey at the end of the visit. Anecdotally, the staff surgeon was observed seeing patients on their own when the clinic was running behind and was an attempt to increase clinic efficiency. This practice may present a novel way to increase clinic efficiency and increase patient satisfaction.
5. Conclusions
Outpatient clinics serve an ever increasing role in the modern healthcare system. It is important that the organization, administration, and layout accurately reflect the patient population it serves. Measurement variables in literature have focused on patient satisfaction and wait-time as markers for improving healthcare. The factors that have been associated with increased wait-time in other surgical outpatient populations have never been studied in the orthopaedic population. Among the sociodemographic, patient, and environmental variables studied at the Fracture Clinic at the Toronto Western hospital, there were several areas where attention may be directed for potential intervention. Our study showed that there was little intervention possible at the socio-demographic level as there appears to be no association between any of the variables studied and wait-time or patient satisfaction. Interventions at the patient level may include changes to clinic scheduling practices to better space out longer patient follow-up visits with those requiring less time. Finally, clinic environmental interventions have the potential to increase patient satisfaction even though there is no measurable effect on overall waittime.
Future work should attempt to measure various characteristics of clinic procedures including time, personnel required, and special tools involved. The association between follow-up interval and procedures should be documented with plans for a trial intervention based on the information gathered.
REFERENCES
- G. C. Pascoe, “Patient Satisfaction in Primary Health Care: A Literature Review and Analysis,” Evaluation and Program Planning, Vol. 6, No. 3-4, 1983, pp. 185-210. doi:10.1016/0149-7189(83)90002-2
- A. Waghorn, J. Thompson and M. McKee, “Routine Surgical Follow-Up: Do Surgeons Agree?” British Medical Journal, Vol. 311, No. 7016, 1995, pp. 1315-1316. doi:10.1136/bmj.311.7016.1344
- K. C. Chung, J. B. Hamil, H. M. Kim, M. R. Walters and E. G. Wilkins, “Predictors of Patient Satisfaction in an Outpatient Plastic Surgery Clinic,” Annals of Plastic Surgery, Vol. 42, No. 1, 1999, pp. 56-60. doi:10.1097/00000637-199901000-00010
- J. Levesque, E. R. Bogoch, B. Cooney, B. Johnston and J. G. Wright, “Improving Patient Satisfaction with Time Spent in an Orthopedic Outpatient Clinic,” Canadian Journal of Surgery, Vol. 43, No. 6, 2000, pp. 431-436.
- D. M. Kennedy, S. Robarts and L. Woodhouse, “Patients Are Satisfied with Advanced Practice Physiotherapists in a Role Traditionally Performed by Orthopedic Surgeons,” Physiotherapy Canada, Vol. 62, No. 4, 2010, pp. 298-305. doi:10.3138/physio.62.4.298
- A. G. Thompson and R. Sunol, “Expectations as Determinants of Patient Satisfaction: Concepts, Theory and Evidence,” International Journal for Quality of Healthcare, Vol. 7, No. 2, 1995, pp. 127-141. doi:10.1093/intqhc/7.2.127
- S. Hulley, S. Cummings, W. Browner, D. G. Grady and T. B. Newman, “Designing Clinical Research: An Epidemiological Approach,” 2nd Editon, Williams and Wilkins, Philadelphia, 2001.
- J. E. Ware and R. D. Hays, “Methods for Measuring Patient Satisfaction with Specific Medical Encounters,” Medical Care, Vol. 26, No. 4, 1988, pp. 393-402. doi:10.1097/00005650-198804000-00008
- R. D. Hays, “The Medical Outcomes Study (MOS) Measures of Patient Adherence,” 1994. http://www.rand.org/health/surveys/MOS.adherence.measures.pdf
- City of Toronto, “Toronto Neighborhood Maps,” 2010. http://www.toronto.ca/demographics/profiles_map_and_index.htm