American Journal of Analytical Chemistry
Vol.5 No.3(2014), Article ID:43225,6 pages DOI:10.4236/ajac.2014.53025
Online Process Control of Alkaline Texturing Baths: Determination of the Chemical Concentrations
Department PV Production Technology and Quality Assurance, Fraunhofer Institute for Solar Energy Systems, Freiburg, Germany
Email: martin.zimmer@ise.fraunhofer.de
Copyright © 2014 Martin Zimmer et al. This is an open access article distributed under the Creative Commons Attribution License, which permits unrestricted use, distribution, and reproduction in any medium, provided the original work is properly cited. In accordance of the Creative Commons Attribution License all Copyrights © 2014 are reserved for SCIRP and the owner of the intellectual property Martin Zimmer et al. All Copyright © 2014 are guarded by law and by SCIRP as a guardian.
Received December 16, 2013; revised January 20, 2014; accepted January 28, 2014
KEYWORDS
Alkaline Texturisation; Titration; High Performance Liquid Chromatography (HPLC); Surface Tension Measurement; Near-Infrared Spectroscopy (NIR); Silicon Solar Cell Manufacturing
ABSTRACT
Almost every monocrystalline silicon solar cell design includes a wet chemical process step for the alkaline texturing of the wafer surface in order to reduce the reflection of the front side. The alkaline texturing solution contains hydroxide, an organic additive usually 2-propanol and as a reaction product silicate. The hydroxide is consumed due to the reaction whereas 2-propanol evaporates during the process. Therefore, the correct replenishment for both components is required in order to achieve constant processing conditions. This may be simplified by using analytical methods for controlling the main components of the alkaline bath. This study gives an overview for a successful analytical method of the main components of an alkaline texturing bath by titration, HPLC, surface tension and NIR spectrometry.
1. Introduction
The wet chemical alkaline texturing is still an important process step during the fabrication of monocrystalline silicon solar cells [1-3] . The texturing process takes place in an aqueous solution of potassium or sodium hydroxide and the organic compound 2-propanol (IPA) at a certain temperature chosen between 70˚C and 80˚C. The hydroxide is consumed due to the reaction with silicon whereas 2-propanol is not consumed, but evaporates during the process due to its low boiling point (82˚C). This changes the bath’s composition. This texturing process results in a reduction of the reflection of the silicon wafer surface due to a complete coverage of the surface with randomly distributed micro pyramids. The mechanism of the pyramid formation is not completely understood yet, but the influence of the chemical concentrations [4,5] as well as that of the accumulating etching products [6], was subject of many studies and is known as critical. Hence, a complete analysis and control of the chemical concentrations in alkaline texturing baths is the prerequisite for a continuous processing at a high quality level. In this paper, we present different approaches for the analysis of the components of alkaline texturisation baths by titration, high performance liquid chromatography, surface tension and near-infrared spectroscopy. In order to evaluate the analytical methods, the component concentrations in the texturisation bath were measured during several processes at a semi-industrial batch process plant.
2. Experimental
2.1. Reference Sample Preparation
The validation of the titration was achieved using a set of reference samples. Samples were prepared from sodium hydroxide pellets (NaOH p.a., Merck, Darmstadt, Germany), sodium metasilicate powder (Na2SiO3∙5H2O, Carl Roth GmbH, Karlsruhe, Germany), sodium carbonate powder (Na2CO3, Carl Roth GmbH, Karlsruhe, Germany) and 2-propanol (IPA Puranal, Honeywell, Seelze, Germany). The silicon concentration ranged between 0 and 50 g/l and sodium carbonate between 0 g/l and 9 g/l, each sample in 25 g/l NaOH and 50 g/l IPA (Table 1). The validation of the high performance liquid chromatography (HPLC) was achieved using reference samples with 40 g/l IPA in different amounts of KOH and dissolved silicon in KOH in the molar ratio of Si:KOH of 1:1.83 (Table 2).
2.2. Titration
All titrations were performed with a Titrando (Deutsche Metrohm, Filderstadt, Germany) using a 20 ml burette and a pH-electrode (Mettler-Toledo, Greifensee, Switzerland). Titration curves, equivalence point recognition and concentration calculation were evaluated with the titration software tiamo 1.1 assuming K2SiO3. A volume of 5 to 10 ml of the alkaline solution was titrated against 0.5 M hydrochloric acid (Merck, Darmstadt, Germany).
The titer was determined with certified sodium carbonate (Merck, Darmstadt, Germany). If the silicon to potassium hydroxide molar ratio exceeded a factor of two, a previous dosing of 1 M sodium hydroxide took place.
2.3. High Performance Liquid Chromatography
The determination of 2-propanol (IPA) by high performance liquid chromatography (HPLC) was achieved by a system consisting of the isocratic HPLC pump P680 (Dionex, Sunnyvale, USA) and an Acclaim Organic Acid column (4.0 × 150 mm) with a following refraction index detector at 35˚C (Shodex RI-101, Showa Denko, Tokyo, Japan). The mobile phase of the chromatography system was a 30 mM methane sulfonic acid. The injection loop contained a volume of about 1 µl for an automated two position valve (EV700-100-S2, Rheodyne, USA). The samples were not diluted for measurements. The chromatograms were evaluated with the chromatography software Chromeleon 6.70. Peak area was used for the quantitative analysis. The external calibration of 2-propanol was done using 2-propanol in water with the auto-
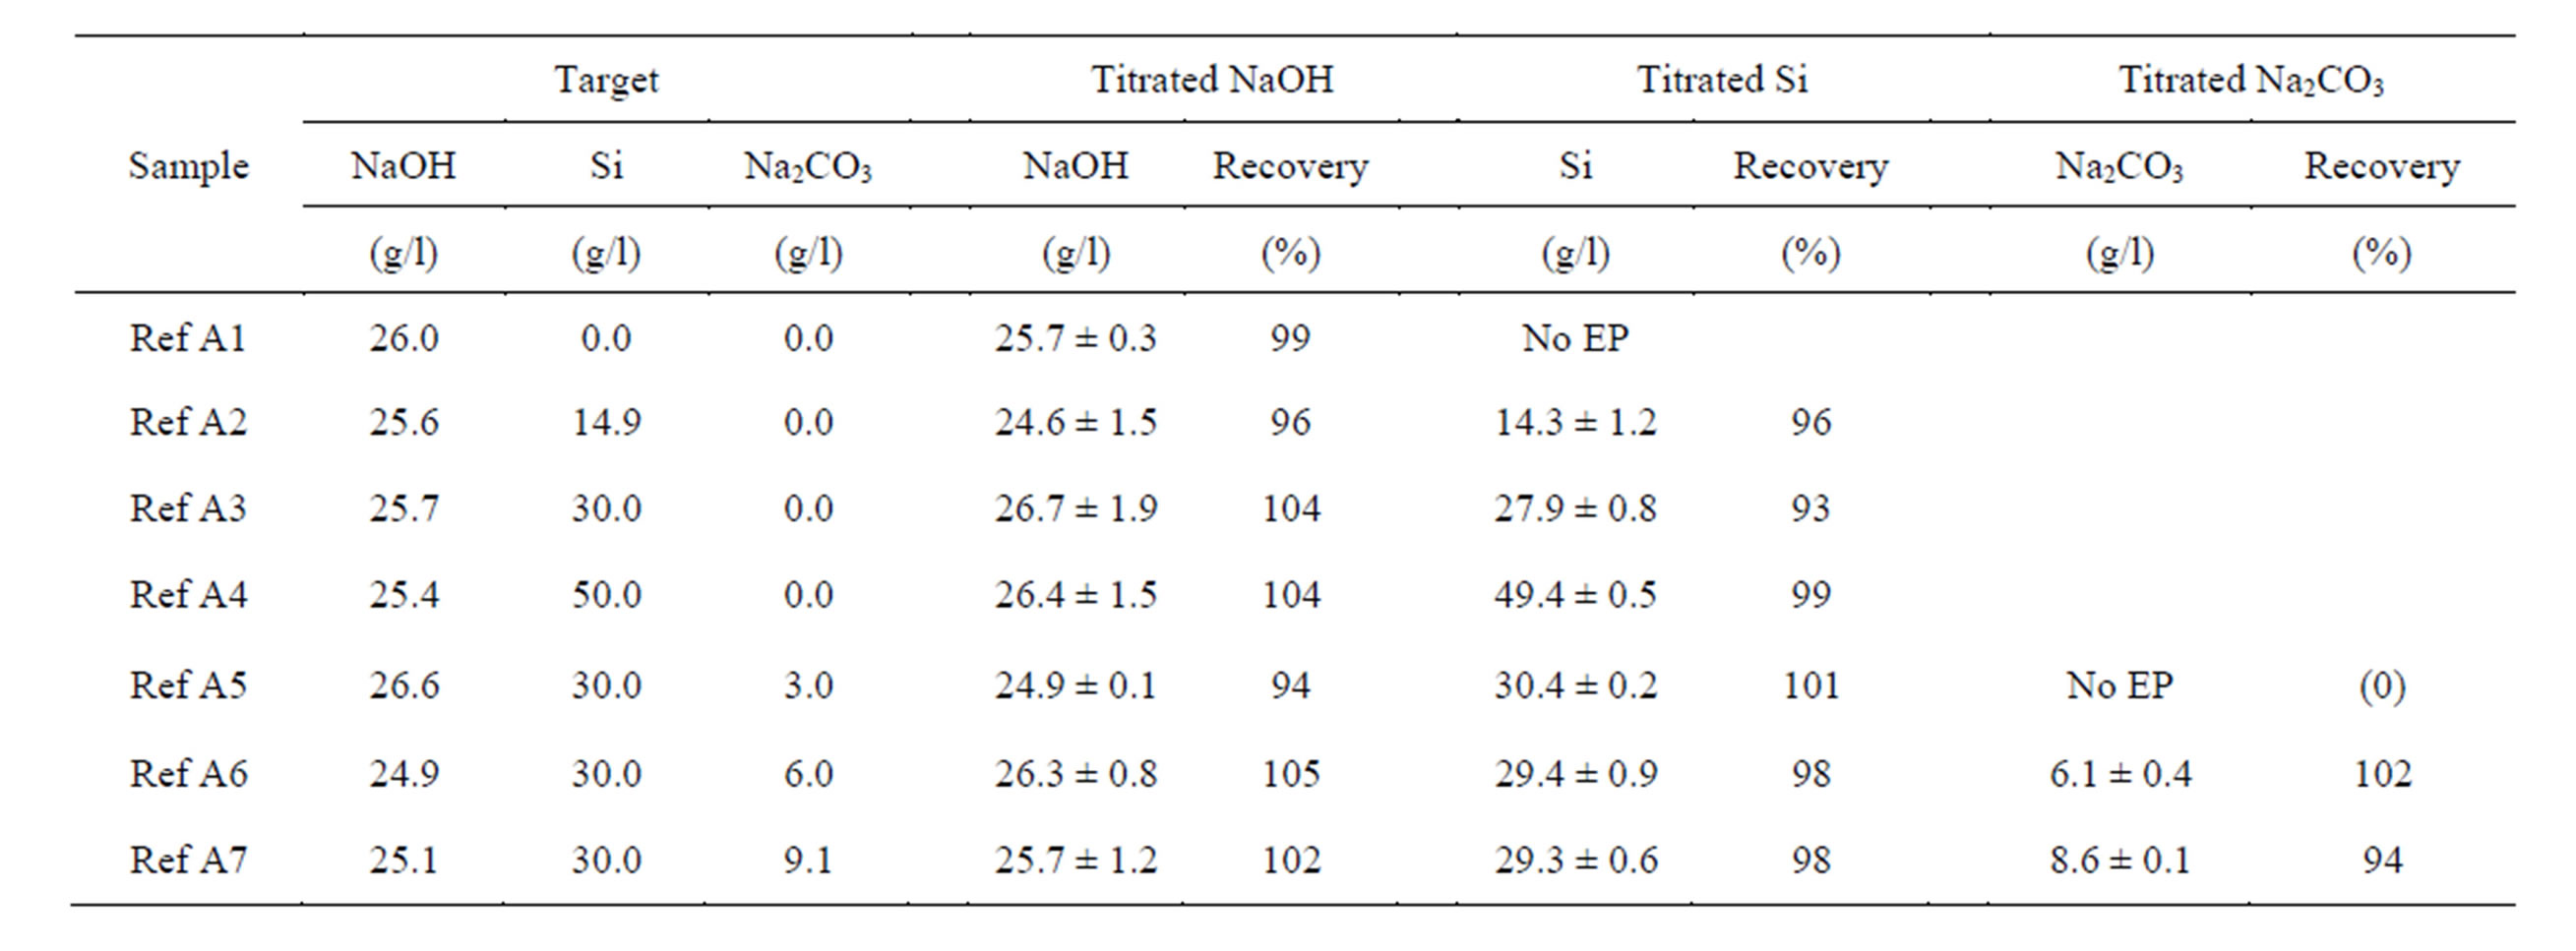
Table 1. Measured NaOH, Si and Na2CO3 concentrations and recovery rates for reference samples, prepared from pure chemicals. The initial target concentration was determined by weighting the used substances. Mean ± standard deviation, n = 3 titrations.
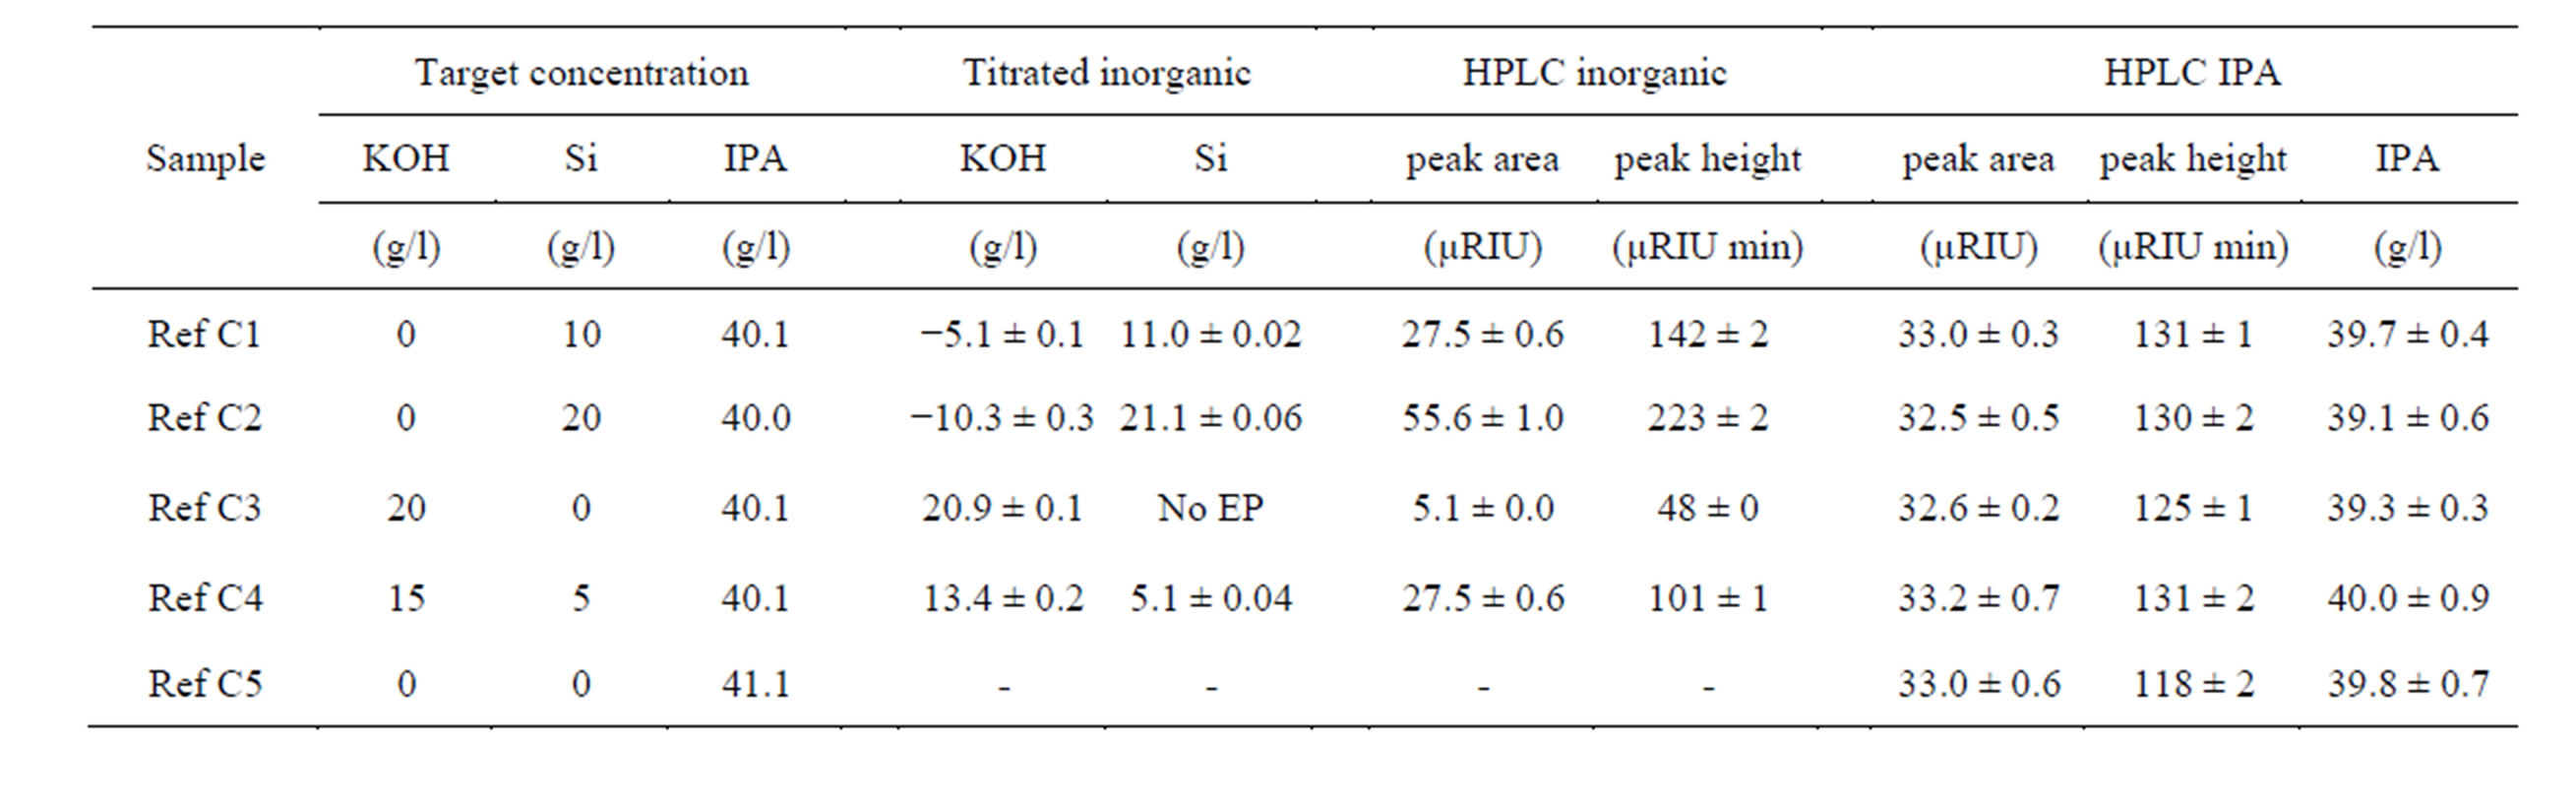
Table 2. Alkaline samples for HPLC consisting of 2-propanol and as matrix potassium hydroxide and silicate (dissolved silicon in KOH). Given are target concentrations as well as characteristic peak data. Negative KOH values appear since the silicon to KOH solution ratio is smaller than 1:2 and silicon is calculated as K2SiO3. Mean ± standard deviation, n = 3 titrations and 4 HPLC analyses.
mated injection valve and an auto sampler.
2.4. Surface Tension Measurement
The surface tension of the alkaline solution was measured with a SITA Science Line t60 (SITA Messtechnik, Dresden, Germany), using the bubble pressure method. A direct measurement with the capillary in the process bath did not produce the required reproducibility; hence the measurement took place in a customized overflow measurement cell (Figure 1, Zitt-Thoma, Freiburg, Germany).
2.5. Near-Infrared Spectroscopy
Near infrared (NIR) spectra were collected continuously with a FT-NIR process spectrometer FTPA 2000-200 (ABB, Quebec, Canada) directly through the  in PFA tube of the circulation line which is commonly used in industrial etching plants. In this study, 128 scans from 8000 to 11,000 cm−1 were averaged for one spectrum at a resolution of 32 cm−1; the measurement cycle was 30 s. The calibration set up and partial least square calibration model (PLS) as described in Zimmer et al. [4], was used to calculate the KOH, silicon and IPA concentration from the spectra.
2.6. Online Measurements at the Etching Plant
All texturisation and analytical experiments were done in a fully automated, semi-industrial scale batch process plant (Stangl Semiconductor, Fürstenfeldbruck, Germany). The alkaline process bath had a volume of 105 l and was divided into an inner process bath of 54 l, where the texturisation took place, and an outer buffer tank. The medium was pumped from the buffer tank to the process unit and circulated via overflow. All samples for the titration were taken from the process bath, the online measurement sites for the near-infrared spectroscopy, surface tension measurement and liquid chromatography are installed on the pressure side of the circulation pump (Figure 1).
3. Results and Discussion
3.1. Titration of Alkaline Hydroxide, Dissolved Silicon and Alkaline Carbonate
A first method for the determination of alkaline hydroxides and silicates with one single titration was given by Grosvenor [7]. This method uses sodium citrate to improve the detection of the first equivalence point e.g. silicate of the titration curve. Due to efforts in technology in the last ten years, all equivalence points of hydroxide, silicate and carbonate were found without addition of sodium citrate in this study.
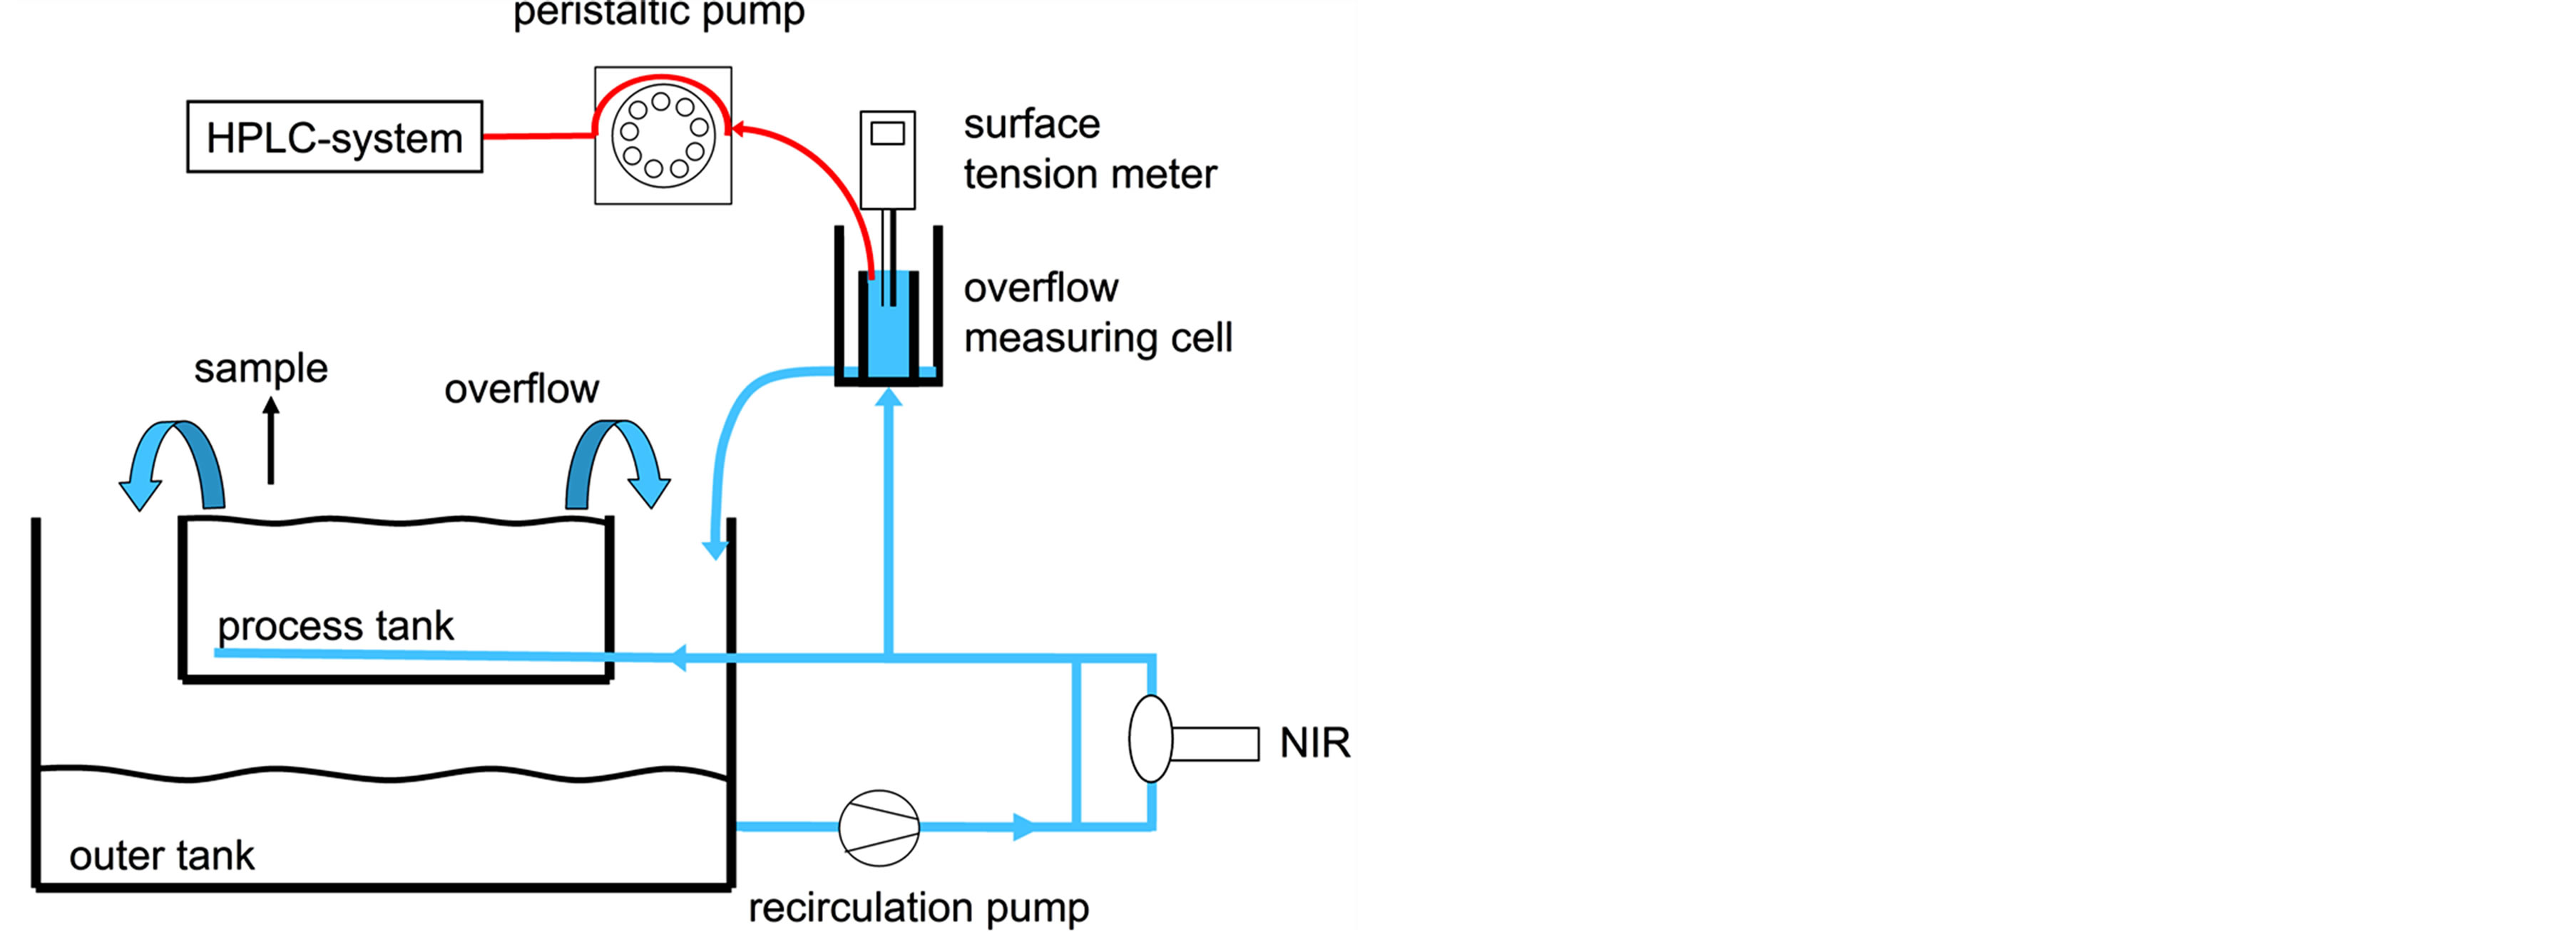
Figure 1. Process bath of the semi-industrial etching plant and installed analytical devices, surface tension meter and HPLC at the recirculation line and NIR at a bypass of the recirculation line.
An acid base titration of an alkaline texturing solution which contains 25.7 g/l NaOH, 29.3 g/l dissolved Si, 8.6 g/l Na2CO3 and 50.1 g/l 2-propanol shows three equivalence points (Figure 2).
According to Grosvenor [7] and the pKa values of the components, the volume of the first equivalence point (V1) represents the neutralization of NaOH and the first neutralization of the dibasic sodium silicate. The volume between first and the second equivalence point (V2) is assigned to the complete neutralization of sodium silicate and the first protonation of sodium carbonate. The complete neutralization of the bicarbonate ions occurs between the second and the third equivalence point (V3). All equivalence points were assigned to certain pH windows which enable the distinction between the different species in the absence of one component (Table 3).
The presence of silicate and hydroxide delivers two equivalence points (EP1 and EP2, Table 3), the same pattern as a pure silicate solution. It might be that the EP2 of a pure silicate solution is assigned wrongly as EP3; it can be treated as EP2. Carbonate with and without hydroxide gives EP2 and EP3. The presence of hydroxide can be distinguished by the volumes between the equivalence points. In case of a pure silicate solution, the volume of EP2-EP1 is equal to that of EP1.
The lower titration limit for silicon can be estimated from Figure 3, where samples with a constant NaOH concentration and increasing silicon amount were titrated. A silicon concentration of 1 g/l shows a peak shoulder to the left of the main peak (EP2). At silicon concentrations higher than 2 g/l, a separate peak representing EP1 is formed. A mixture of different amounts of sodium silicate and sodium carbonate in a constant amount of sodium hydroxide were titrated in order to determine the recovery rate (Table 1).
The average of the recovery rates for NaOH was found
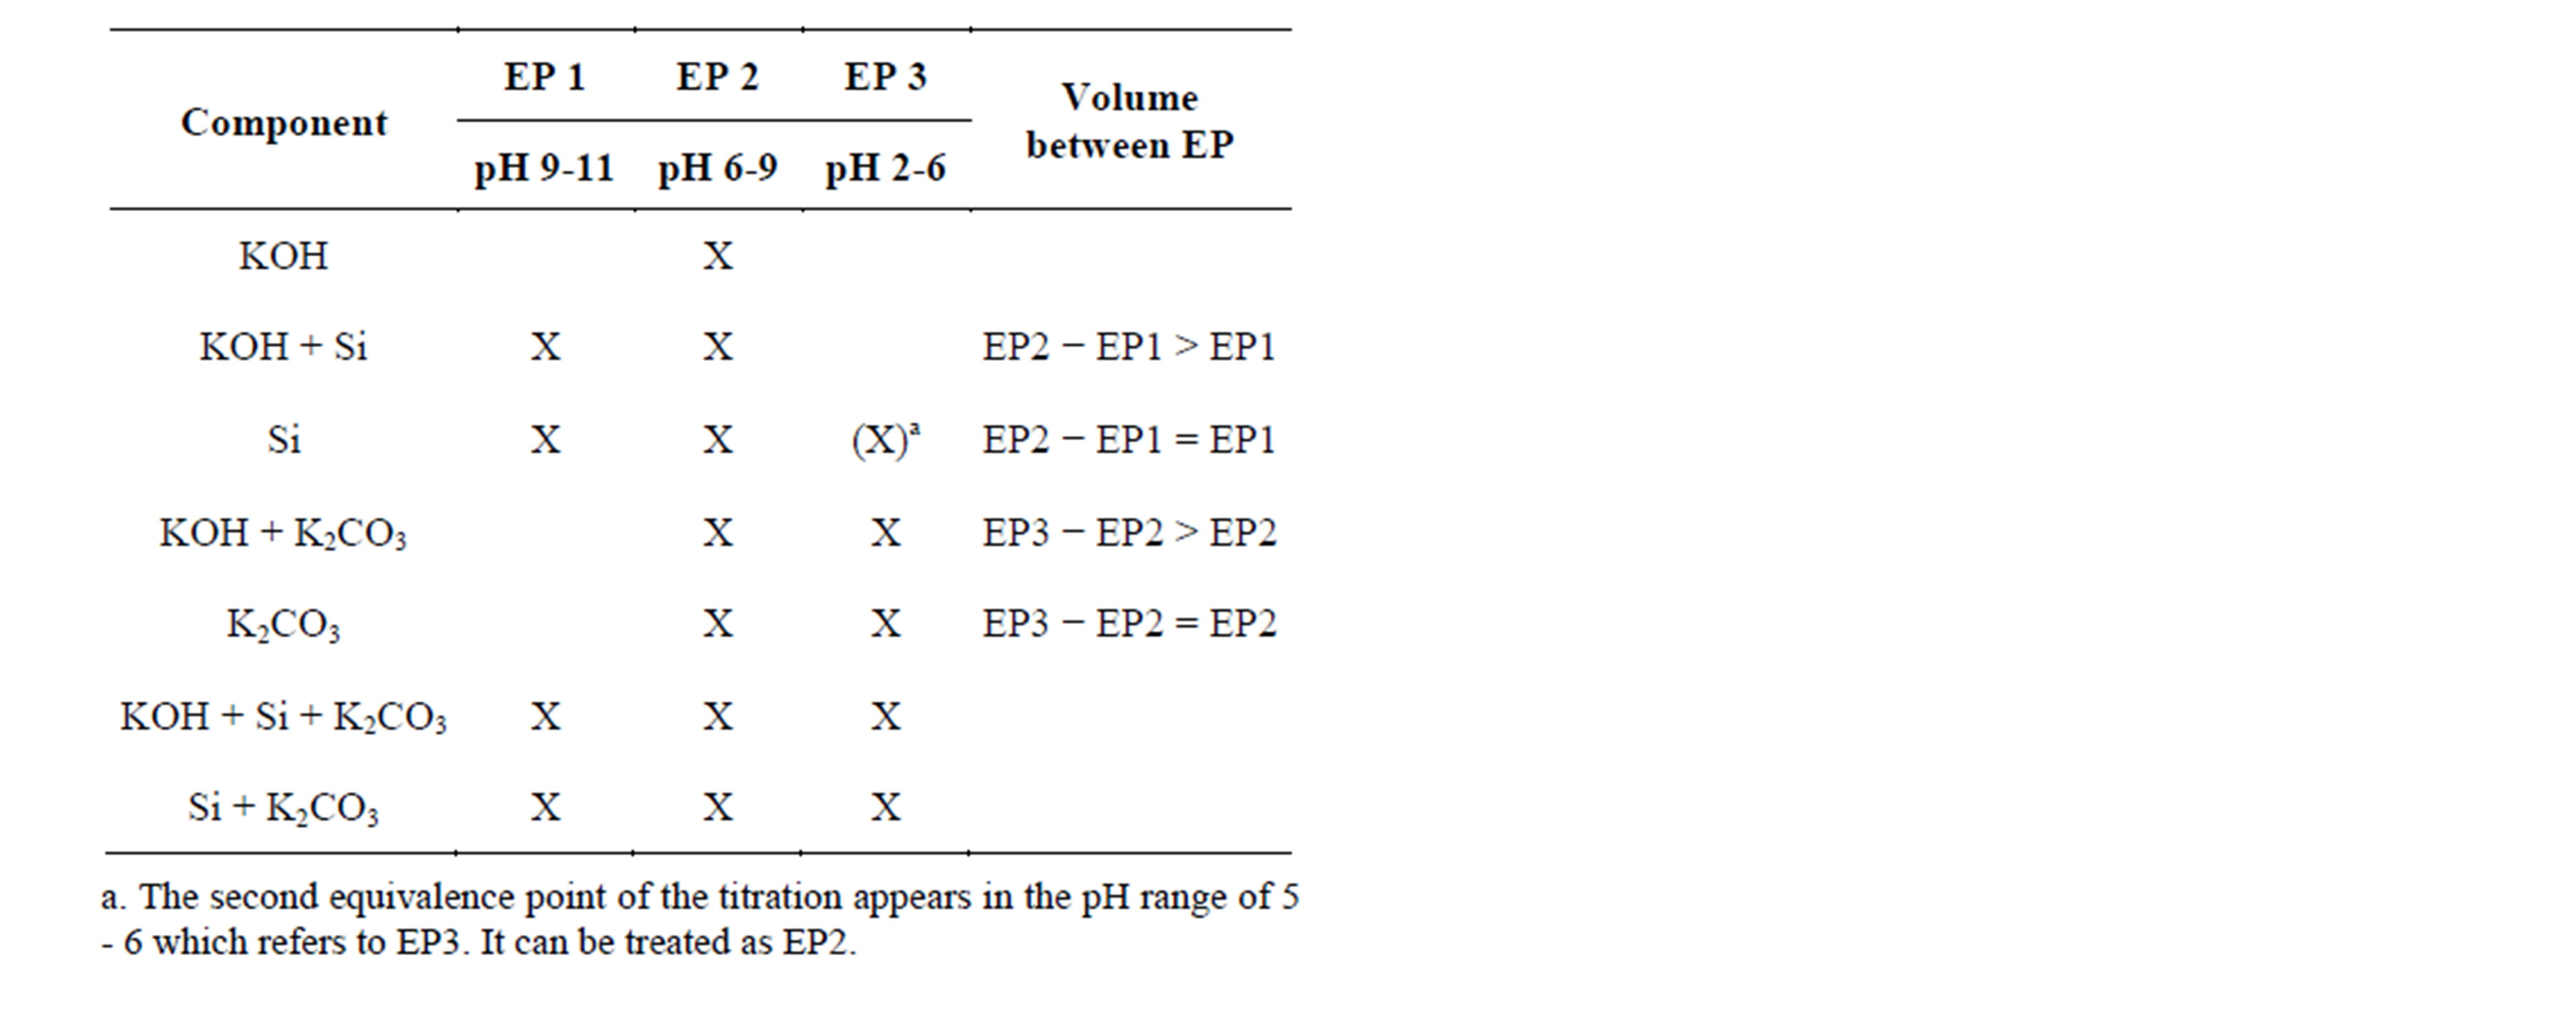
Table 3. Equivalence points in titration curves of alkaline texturing solutions with different missing components assuming silicon as K2SiO3. The cross (X) shows the existing equivalence point for its component. The equivalence point EP3 only appears as carbonate is in the system. Potassium can be replaced by sodium.
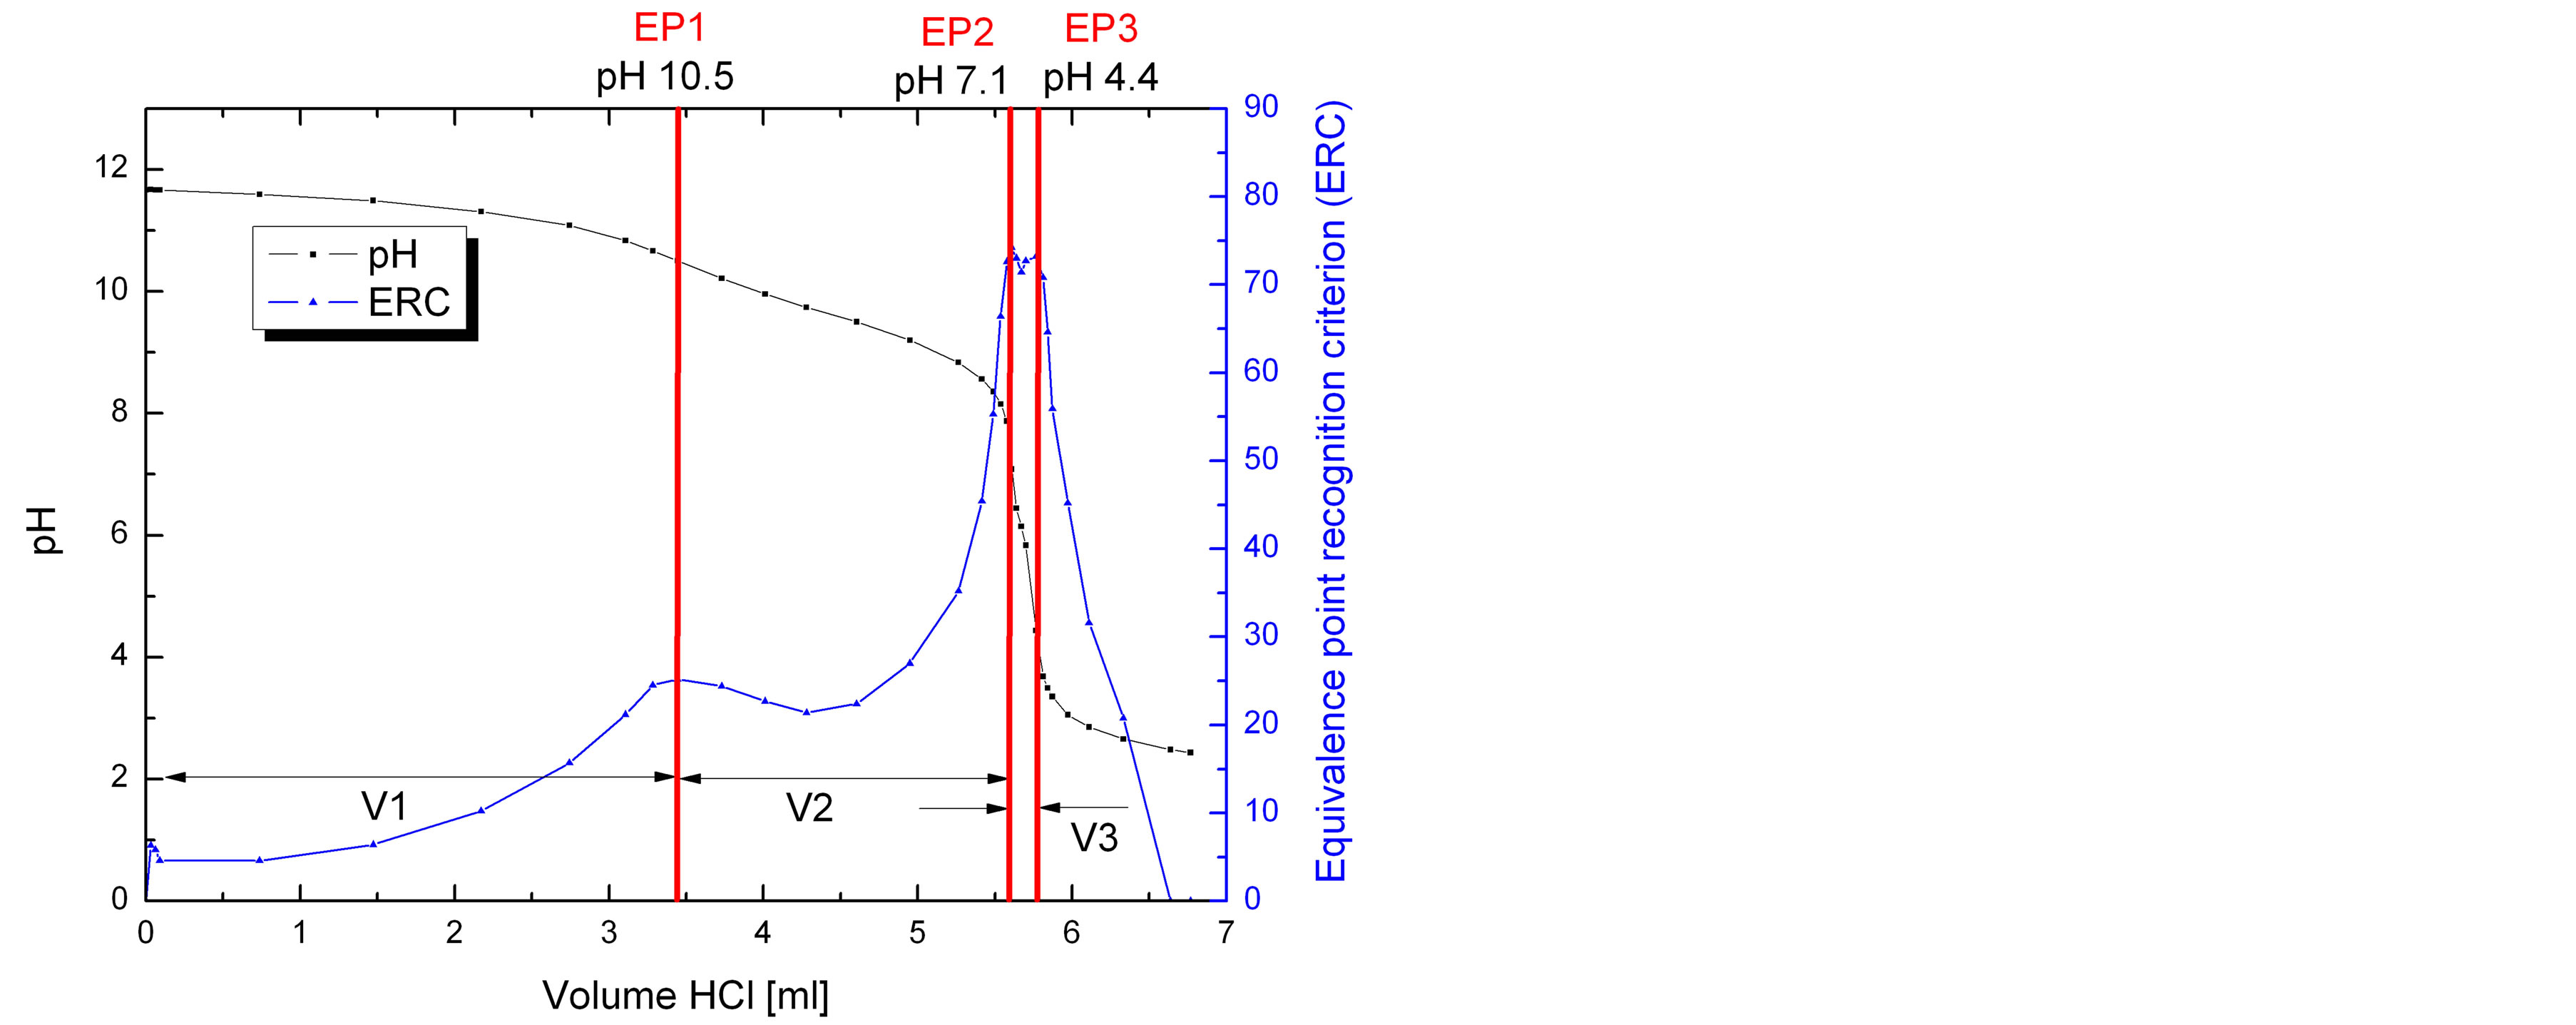
Figure 2. Titration curve for a mixture of hydroxide, silicate and carbonate. The equivalence points EP1, EP2 and EP3 of the components appear at characteristic pH values. From the equivalence points the volumes V1 to V3 can be calculated. V1 refers to the concentration of hydroxide and silicate, V2 refers to bisilicate and bicarbonate and V3 to carbonate.
to be 101% with a relative standard deviation of 3.7%, that for Si was determined to 97% with a relative standard deviation of 2.9%. Sodium carbonate was not detected for a concentration of 3 g/l, but for 6 g/l and 9 g/l with a recovery rate of 102% and 94% respectively.
Due to the alkalinity of the silicate, even a pure silicate solution without free sodium hydroxide is able to etch silicon. Therefore, silicate solutions with a stoichiometry of hydroxide to silicon smaller than two are possible resulting in a (formal) negative KOH value when K2SiO3 is assumed for concentration calculation (Table 2). This is
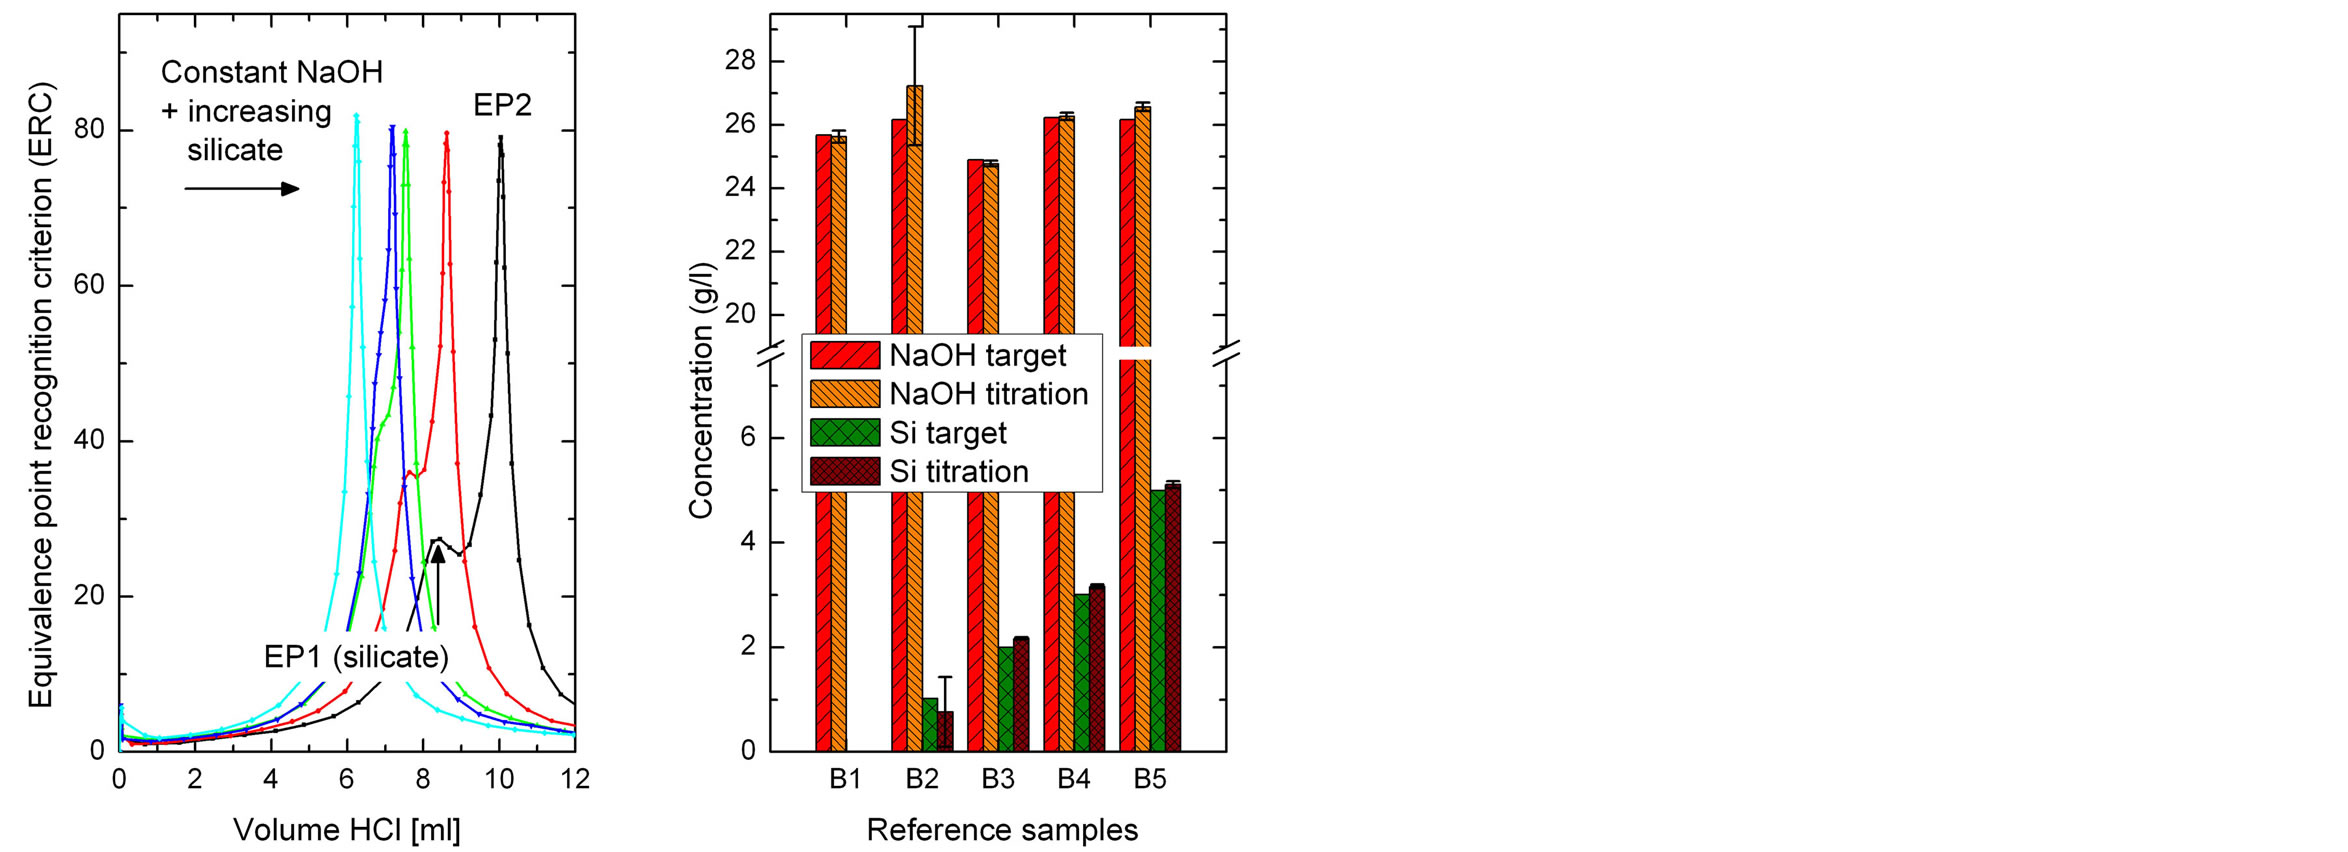
Figure 3. Titration curves of sodium hydroxide with different amounts of silicate (left) and target and measured concentrations (right). As the silicate concentration increases in the sample solution EP1 is formed, first as a shoulder and then as a small peak.
indicated in a titration curve by the shift of EP1 towards lower volumes as EP2 stays at the same volume. As the ratio of hydroxide to silicon reaches one, EP1 completely disappears, but can be uncovered by a preceding dosing step of hydroxide.
A fix volume of hydroxide is therefore dosed into the titration solution. The detection limit for dissolved silicon and sodium carbonate using an initial volume of 5 ml is in the range of 1 g/l. The detection limit increases with decreasing titration volume.
3.2. Determination of 2-Propanol Using an HPLC
The most important parameter to control in alkaline texturing baths is the concentration of the additive, in this case 2-propanol. The 2-propanol concentration in the texturing solution changes very quickly during the process, since the process temperature of 70˚C to 80˚C is near 2-propanol’s boiling point (82˚C). An undiluted solution consisting of potassium hydroxide, dissolved silicon as potassium silicate and 2-propanol shows three peaks in the HPLC chromatogram (Figure 4).
The inorganic components elute at 1.5 min, the negative injection peak at 1.9 min, and 2-propanol elutes at 2.1 min. The clear separation of the 2-propanol peak from the inorganic peak depends on the amount of the inorganic components e.g. potassium hydroxide and silicate. At high inorganic charges, the injection peak disappears that the inorganic peak and the 2-propanol peak merge. KOH makes the inorganic peak broader (Figure 4), high amounts of silicate increase the inorganic peak height (from 48 µRIU min for 0 g/l Si to 223 µRIU min for 20 g/l Si, Table 2).
The K+ load can be correlated to the quotient of the peak area and the peak height. As the K+ concentration is

Figure 4. HPLC chromatograms of potassium hydroxide, potassium silicate and 2-propanol during the texturisation of six batches with 100 wafers. The inorganic components elute prior to the injection peak and prior to 2-propanol. A high amount of inorganic components (measurement after 600 wafers) inhibits a separating of the peaks.
too high the inorganic and 2-propanol merge depending on the separation quality of the column and the eluent concentration. If the peaks merge, the 2-propanol peak height is increased due to the tailing of the inorganic peak and has to be evaluated as a rider. If other additives than 2-propanol are used for texturisation which elute later than 2-propanol, this problem exists only for very high K+ concentrations. The complete analysis of IPA requires four minutes and is therefore suitable for an insitu control of alkaline texturing baths.
3.3. Determination of 2-Propanol with Surface Tension Measurement
2-propanol is a surface active alcohol and lowers the surface tension of an aqueous solution. The surface tension decreases with increasing 2-propanol content and temperature of the solution. The dependence of the surface tension s on the 2-propanol concentration can be described by the Szyszkowski equation, which was expanded by three linear terms in Equation (1) [8], which describes the temperature dependence as well as the minor influences of KOH and K2Si(OH2)O2.
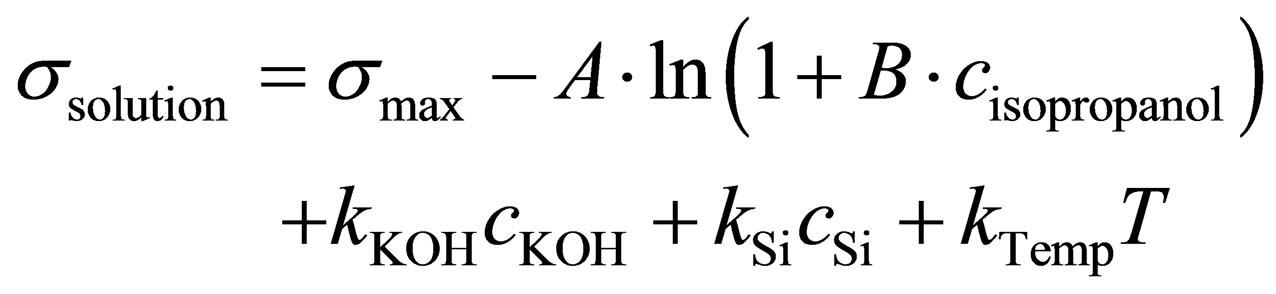 (1)
(1)
The constants A, B, kKOH, KSi and kTemp were determined empirically (Table 4), fitting measured surface tension to the known concentrations of a reference dataset. The measurement cycle for the surface tension measurement is 8 s, but depends on a running circulation pump and a reference analytical method.
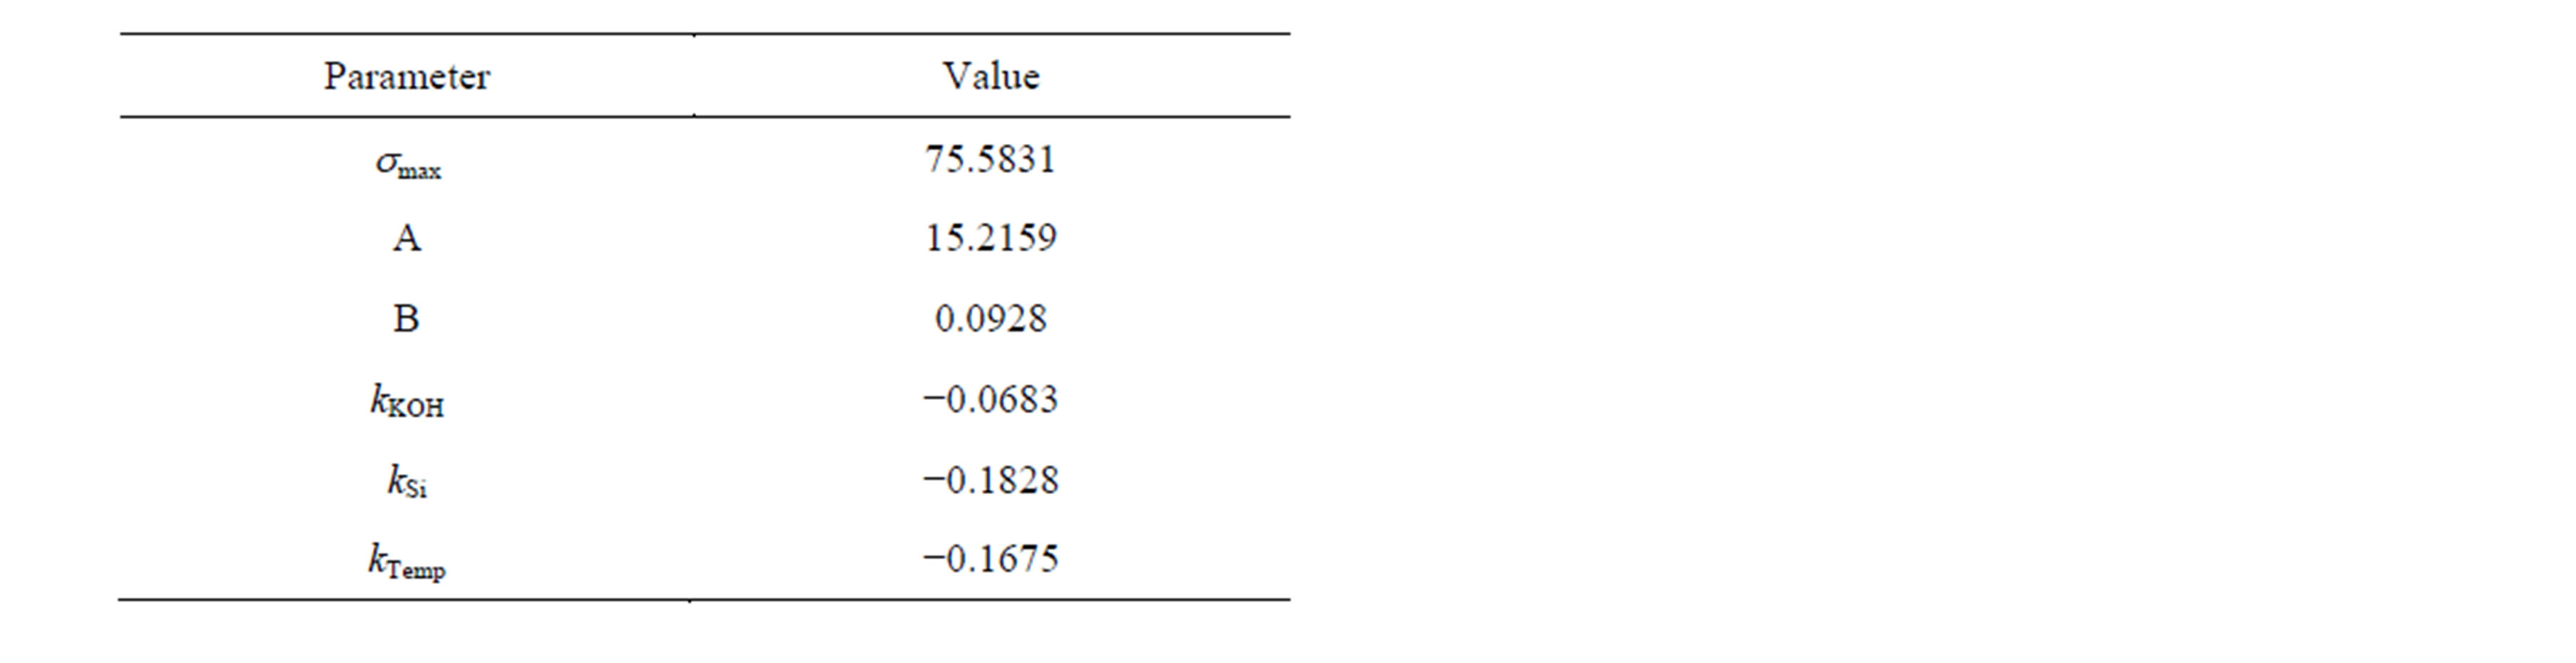
Table 4. Fitted parameters smax as the surface tension of pure water at 0˚C and constants for Equation (1) for the determination of the 2-propanol concentration from the surface tension.
3.4. Determination of KOH and 2-Propanol with NIR Spectroscopy
In near infrared (NIR) spectra 2-propanol has its own vibration mode compared to water and can relatively easily be differentiated to aqueous solutions. This 3ν (C-H) vibration mode shows a very sensitive signal at 8440 cm−1 that can be used for its calibration. The NIR calibration model for 2-propanol, KOH and silicon is described in Zimmer et al. [4]. The NIR method is as well as the surface tension temperature dependent, but since the temperature was included in the calibration model, it can be calculated from the spectra. The fast measuring cycle of NIR spectroscopes allows redosing in dependence of the calculated concentrations from NIR.
3.5. Online Control of Concentrations
The shown analytical methods were applied for several alkaline texturing processes at a batch etching plant. The analytical data was recorded at the batch plant as shown in Figure 1. The online measuring is suitable for the online analysis for the concentrations of KOH, silicate and the additive and the control of the dosing (Figures 5 and 6).
Online measurements have the advantage that the response returns in a short time (seconds for surface tension and NIR). The online control of the 2-propanol control gives a good overlay of the HPLC and NIR data. The 2-propanol dosing only can be seen in the NIR data, the delay of the HPLC is too long for a quick dosing control, but the increase and decrease of the IPA concentration before and during the process can be seen. The HPLC might be suitable for an additive that does not evaporate and changes its concentration slowly. The KOH and Si concentration can also be measured by NIR and show the increase of silicon and a decrease of the KOH concentration. The KOH dosing before a texturing process results as a spike in the NIR values. The KOH concentration decreased in spite of KOH replenishment. Probably the replenishment was too little.

Figure 5. Concentration development in the alkaline texturisation bath during the texturing of four batches with 100 wafers each. Reference measurements were done with titration (KOH, Si) and HPLC (2-propanol). Additionally the 2-propanol concentration calculated from online surface tension measurement is shown.
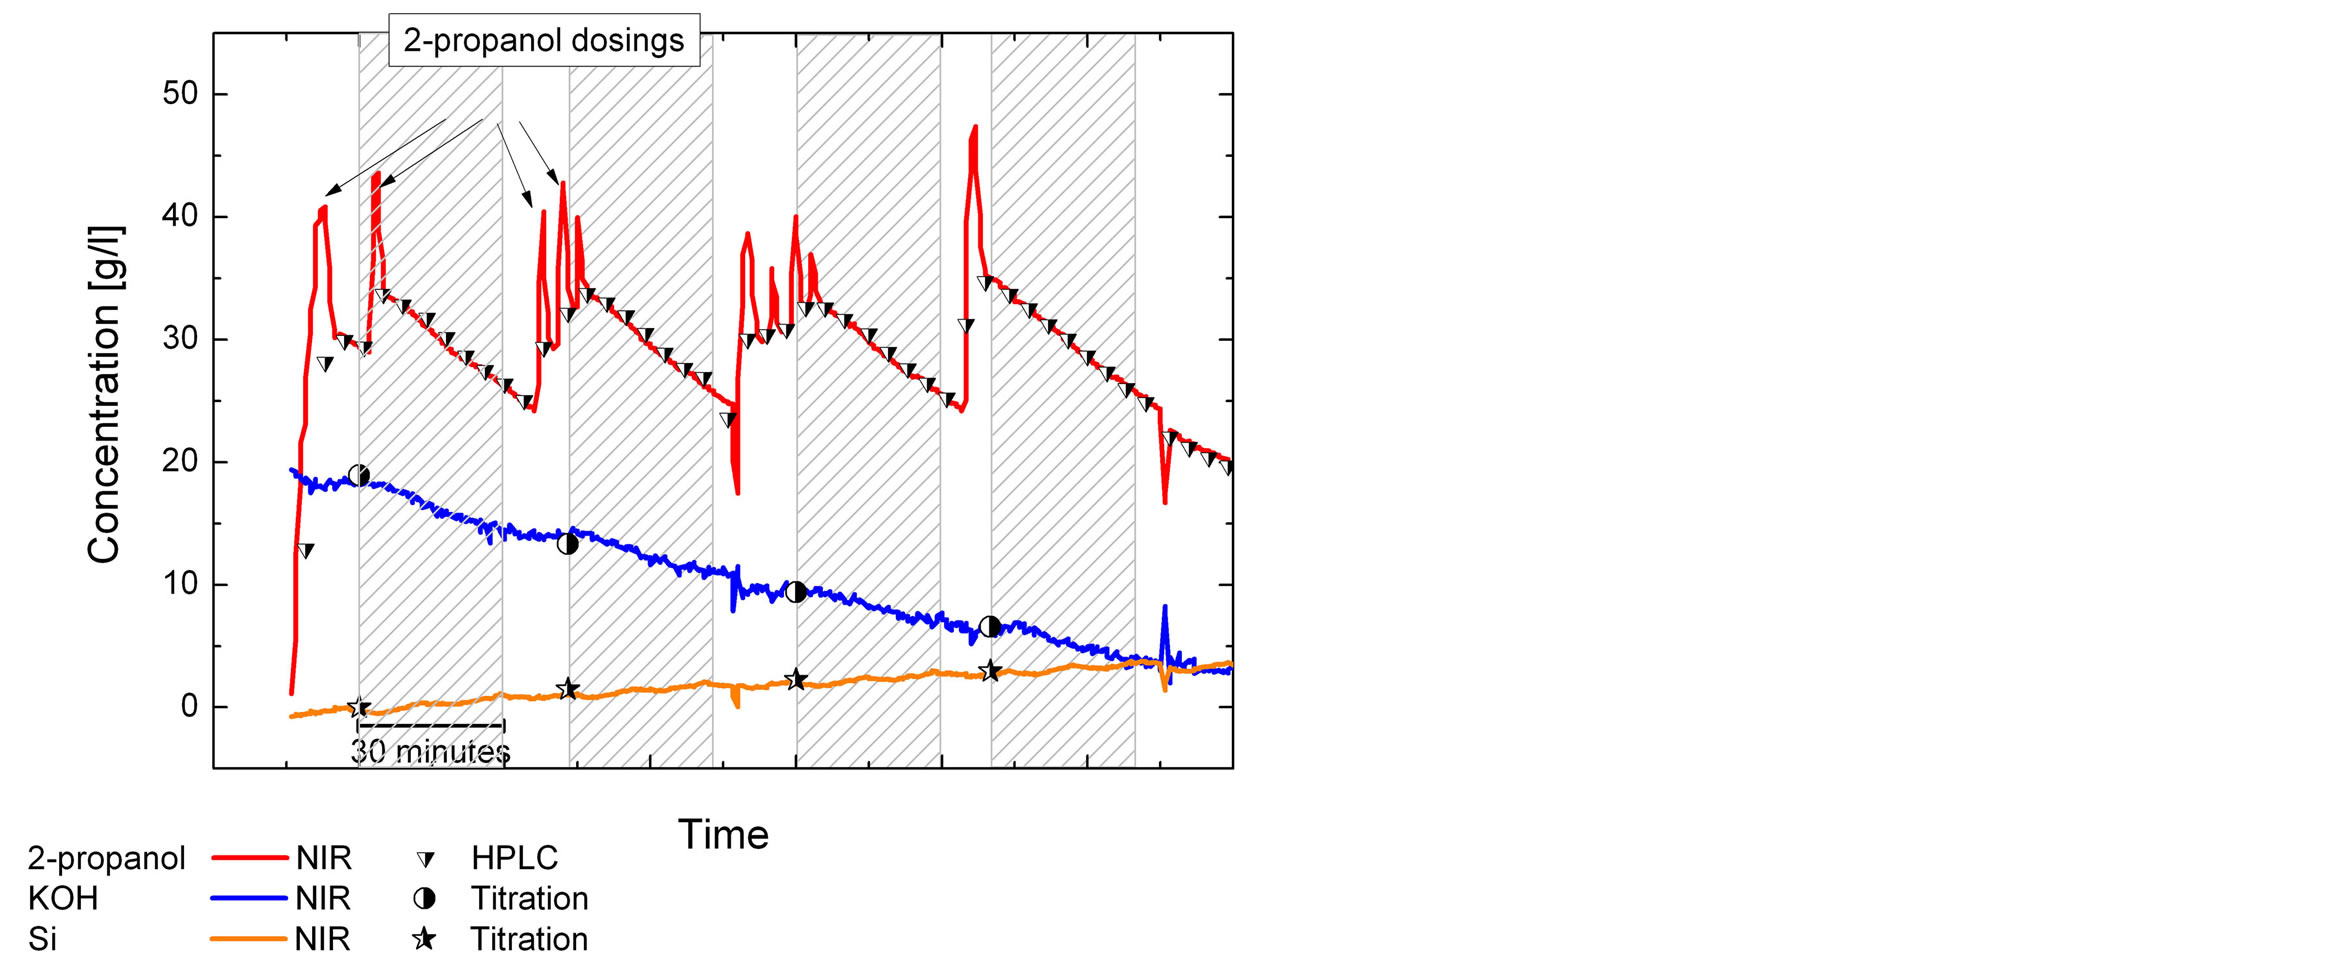
Figure 6. Concentration development as described in Figure 5 with additionally plotted online-measurements with nearinfrared spectroscopy.
4. Conclusion
The main compounds of alkaline texturing baths consisting of alkaline hydroxide, silicate and an alcohol as additive can be completely analyzed by using the presented analytical methods. The acid base titration analyzes hydroxides, silicates and carbonates, and the HPLC and the surface tension analyze the additive 2-propanol. The NIR spectroscopy allows measuring hydroxide, silicate and 2- propanol and the temperature. Also, the dosing of the chemicals and water can be controlled in the concentration curves of the online data. All these methods can be used as an in-situ analytical method that differs in measurement cycle times. A titration of hydroxide, silicate and carbonate takes about 10 min due to three equivalence points that need to be found. An HPLC chromatogram has been finished after 4 min for 2-propanol. The surface tension and the NIR spectrum of an alkaline texturing bath are recorded in less than 20 s. The NIR method and the surface tension need a reference analytical method in order to calibrate them for the used chemicals. The advantage of both methods is that they do not consume any eluents or titration solutions.
REFERENCES
- D. Biro, S. Mack, A. Wolf, A. Lemke, U. Belledin, D. Erath, B. Holzinger, E.-A. Wotke, M. Hofmann, L. Gautero, S. Nold, J. Rentsch and R. Preu, “Thermal Oxidation as a Key Technology for High Efficiency Screen Printed Industrial Silicon Solar Cells,” Proceedings of the 34th IEEE Photovoltaic Specialists Conference, Philadelphia, 7-12 June 2009, pp. 1594-1599.
- A. Goetzberger, J. Knobloch and B. Voss, “Crystalline Silicon Solar Cells,” John Wiley & Sons Ltd., Chichester, 1998.
- J. Rentsch, J. Ackermann, K. Birmann, H. Furtwängler, J. Haunschild, G. Kästner, R. Neubauer, J. Nievendick, A. Oltersdorf, S. Rein, A. Schütte, M. Zimmer and R. Preu, “Wet Chemical Processing for C-Si Solar Cells-Status and Perspectives,” Proceedings of the 24th European Photovoltaic Solar Energy Conference, Hamburg, 21-25 September 2009, pp. 1113-1117.
- P. K. Singh, R. Kumar, M. Lal, S. N. Singh and B. K. Das, “Effectiveness of Anisotropic Etching of Silicon in Aqueous Alkaline Solutions,” Solar Energy Materials and Solar Cells, Vol. 70, No. 1, 2001, pp. 103-113. http://dx.doi.org/10.1016/S0927-0248(00)00414-1
- I. Zubel and M. Kramkowska, “Etch Rates and Morphology of Silicon (h k l) Surfaces Etched in KOH and KOH Saturated with Isopropanol Solutions,” Sensors and Actuators A: Physical, Vol. 115, No. 2-3, 2004, pp. 549-556. http://dx.doi.org/10.1016/j.sna.2003.11.010
- K. Fisher and J. Cotter, “Investigation of Low Molarity Alkaline Texturing Solutions,” Proceedings of the 15th International Photovoltaic Science & Engineering Conference, 2005, pp. 622-623.
- V. L. Grosvenor, “Aqueous Potentiometric Titration of Silicate and Hydroxide in Alkali Silicate Solutions,” American Chemical Society, Vol. 54, No. 4, 1982, pp. 837-838.
- W. Adamson and A. P. Gast, “Phsical Chemistry of Surfaces,” 6th Edition, Wiley, New York, 1997.