Open Journal of Endocrine and Metabolic Diseases
Vol. 3 No. 2 (2013) , Article ID: 31669 , 13 pages DOI:10.4236/ojemd.2013.32022
Design of the Saitama Cardiometabolic Disease and Organ Impairment Study (SCDOIS): A Multidisciplinary Observational Epidemiological Study*
1Division of Clinical Nutrition, Department of Medical Dietetics, Faculty of Pharmaceutical Sciences, Josai University, Sakado, Japan
2First Department of Comprehensive Medicine, Saitama Medical Center, Jichi Medical University School of Medicine, Omiya, Japan
3Saitama Citizen Medical Center, Nishi, Japan
4Saitama Health Promotion Corporation, Sakura, Japan
5Apheresis and Dialysis Center, School of Medicine, Keio University, Tokyo, Japan
6Department of Nephrology, Tokyo Kyosai Hospital, Tokyo, Japan
Email: #keinaka@josai.ac.jp
Copyright © 2013 Toshitaka Muneyuki et al. This is an open access article distributed under the Creative Commons Attribution License, which permits unrestricted use, distribution, and reproduction in any medium, provided the original work is properly cited.
Received February 26, 2013; revised March 26, 2013; accepted April 26, 2013
Keywords: Obesity; Cardiometabolic risks; Organ impairments; Asians; Diabetes; Nutrition; Saitama; Checkup
ABSTRACT
Background: In the past few decades, the incidence of cardiometabolic diseases and disorders of the liver, kidney, pancreas, heart, and lung, have been increasing in Western and Asian countries, including Japan. Numerous factors, including abnormal body weight (obesity, overweight, or underweight), infrequent exercise, and other unfavorable lifestyle factors (e.g., smoking and heavy alcohol drinking) have been proposed as risk factors for the development and the progression of diseases, such as type 2 diabetes, hypertension, and dyslipidemia, which ultimately lead to impaired organ function and possibly death. However, the mechanisms that link these risk factors with diseases are still poorly understood, and the potential treatments, including pharmacotherapy and diet, have not been fully evaluated. Methods: In 2011, we established a new collaborative research program, the Saitama Cardiometabolic Disease and Organ Impairment Study (SCDOIS). This multidisciplinary observational epidemiological research study was designed to cover several high-profile diseases and some traditional fields of internal medicine, as well as apparently unrelated fields and particular lifestyle factors, such as unhealthy eating behaviors. In a series of studies, apparently healthy subjects who underwent a regular medical checkup were retrospectively identified based on the results of their medical checkups. In this way, the incidence, prevalence, causality, and clinical relevance of specific conditions and diseases have been investigated in cross-sectional analyses of 100,000 - 200,000 adults, and in longitudinal studies of several thousand subjects who underwent medical checkups multiple times. Discussion: This article describes the background, rationale, purpose, and methods of the SCDOIS. Using data obtained from annual medical checkups, our goals are to 1) establish criteria or identify clinical features that would enable clinicians to detect the presence of abnormal conditions associated with cardiometabolic diseases and/or organ impairment much earlier in the disease course; and 2) determine the potential mechanisms and therapies for these conditions.
1. Introduction
Over the past few decades, the incidence of cardiometabolic diseases and disorders affecting the liver, kidney, pancreas, heart, and lung, for example, have been increasing in Western and Asian countries, including Japan [1-10]. Numerous factors, including abnormal body weight (obesity, overweight, or underweight) [11-13] and unfavorable lifestyle factors (e.g., infrequent exercise and overeating) have been attributed to the development and progression of cardiometabolic diseases, such as type 2 diabetes, hypertension, and dyslipidemia, which ultimately increase the risks of organ failure and mortality. However, the mechanisms underlying the associations between these risk factors and diseases are still poorly understood, and potential treatments or early interventions, such as pharmacotherapy and dietary modifications, have not been fully examined. Therefore, many community-based studies, including in Japan, have already been conducted to address these issues [14-17].
In 2011, we implemented a new research program, the Saitama Cardiometabolic Disease and Organ Impairment Study (SCDOIS). This multidisciplinary observational epidemiological study focused on specific cardiometabolic diseases and related fields of internal medicine, as well as apparently unrelated fields such as orthopedics, otolaryngology, ophthalmology, and the possible effects of daily lifestyle factors, such as eating behavior and sleep duration. In this research program, we retrospectively identified apparently healthy subjects who underwent a regular medical check-up, based on the results of their medical checkups. Then, in cross-sectional and longitudinal studies, we have been examining the incidence, prevalence, causality, and the clinical relevance of certain conditions, diseases, or other apparently ordinary parameters.
2. Methods
2.1. Study Design
A series of studies started in 2011 and involves the collaboration of three institutions in Saitama prefecture, Japan: Josai University, Jichi Medical University, and Saitama Health Promotion Corporation. The protocol conforms to the Declaration of Helsinki, and was approved by the Ethics Committee of Josai University and Jichi Medical University, and by the Ethics Committee of Saitama Health Promotion Corporation. Written informed consent was obtained at the time of the checkup from all subjects.
The observational study, without any specific interventions, consists of data recorded during annual medical checkups of asymptomatic people living or working in Saitama Prefecture, a suburb of Tokyo, Japan (Figure 1). Historically, forestry and agriculture were the major industries in Saitama. However, Saitama has since evolved from a predominantly agricultural prefecture into an industrial economy, with a total population exceeding 7 million people [18]. Since 1997, Saitama Health Promotion Corporation, a public interest corporation, has supported the health of people, including children and adolescents, living or working in Saitama Prefecture, mainly by conducting medical checkups [19]. Since 2000, approximately 100,000 - 200,000 people every year un-
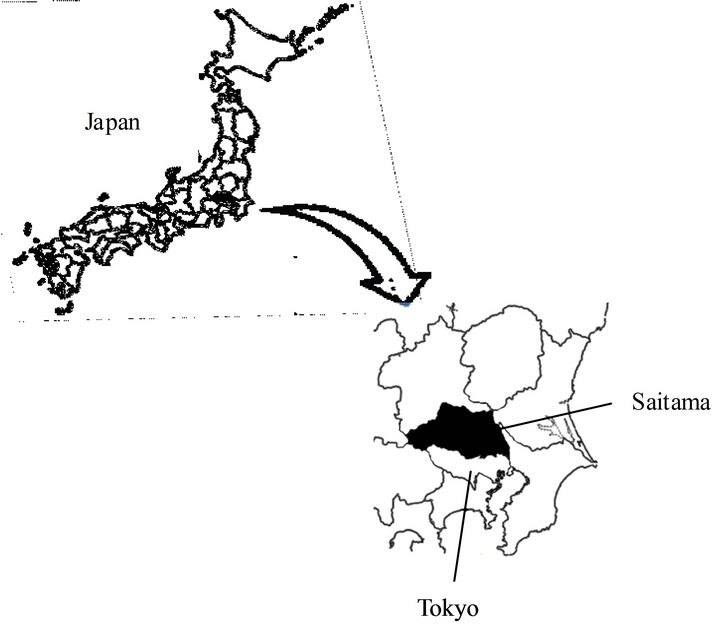
Figure 1. Saitama Prefecture (indicated in black) is located near Tokyo, in Japan.
dergo medical checkups organized by Saitama Health Promotion Corporation. Data for all the subjects who have undergone these checkups have been accumulated digitally in a central database managed by Saitama Health Promotion Corporation. More than half of the subjects underwent the same checkup in the following year. However, about one-quarter to one-third of the subjects, particularly women, did not undergo a checkup in the following year for a variety of reasons, including moving house, resignation or change of jobs, childcare, or family commitments, which has decreased the number of evaluable subjects included in the longitudinal study. This loss of subjects to follow-up, is not specific to the checkups organized by Saitama Health Promotion Corporation [20,21]. Indeed, many Japanese individuals undergo mandatory medical checkups provided by the company that they work for, or they visit a local healthcare center.
2.2. Subjects
Using the central database, we retrospectively identified men and women aged 20 - 85 years who underwent medical checkups between 1999 and 2008, and who met the specific eligibility criteria based on the results of their medical checkups (Figure 2). After identifying and retrieving the subjects from the database, the corresponding investigators prepare their own databases and start to review and analyze the data.
At the medical check-up by Saitama Health Promotion Corporation, all subjects were required to complete a questionnaire recording their medical history (including history of hypertension, hyperlipidemia, diabetes, and cardiovascular disease) and lifestyle characteristics, including eating behaviors, type of job, work duration,
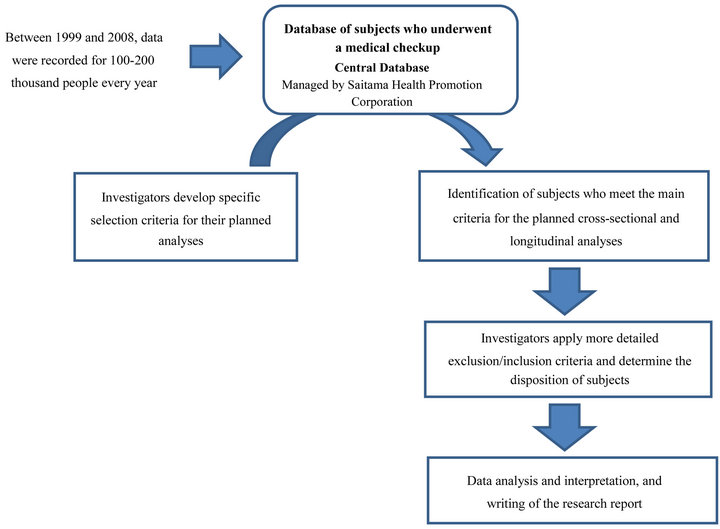
Figure 2. Flow-chart used to identify subjects meeting the criteria for specific analyses.
sleep duration, smoking status, alcohol intake, and frequency of regular exercise (Table 1). The questionnaire was based on a questionnaire developed by the Japanese Ministry of Health, Labour and Welfare for the nationwide Specific Health Checkups and Specific Health Guidance, which started in 2008 [22]. We also included other questions (up to 10 questions) to examine lifestyle factors and eating behaviors. All of the questions are listed in Table 1. Unfortunately, data for income were not recorded in our study, although we acknowledge that socioeconomic status and educational levels may influence or confound the development and progression of many diseases [23-25].
2.3. Eligibility Criteria for Research Studies
Subjects with unstable vital signs, emergency diseases, serious diseases (e.g., advanced cancer or serious infection), pregnancy, being treated in hospital, or undergoing hemodialysis did not undergo the medical checkups. Subjects suspected of having cancer based on the results of their checkups were excluded from the study. However, patients with a history of severe diseases (e.g., prior myocardial infarction, angina, stroke, renal disease, or lung disease) were included if the diseases were stable and well controlled. Additional eligibility criteria were also applied by the investigators depending on the aim of and the target population included in individual studies/analyses.
2.4. Lifestyle Factors and Behavioral Patterns
The lifestyle factors assessed in this series of studies are summarized in Table 1. In the questionnaire, all subjects were asked to select the most appropriate response from a list of prepared responses that categorized the factor into two or more groups. For example, it was reported that eating speed and skipping breakfast were associated with obesity and type 2 diabetes [26-30]. Some of the questions focusing on eating behaviors have not been validated against established validated questionnaires, so such studies will be needed in the future.
In terms of cardiometabolic disease and organ disorders, we intend to evaluate the self-reported clinical characteristics of the subjects, as these factors may be important confounders in multivariate analyses.
2.5. Measurements
The objective measurements are listed in Table 2. Anthropometric, laboratory tests, blood pressure, urinalysis, and other tests were carried out in the early morning. Height and weight were measured objectively (cm and kg) to one decimal place using a digital electronic scale, while wearing light clothing without shoes. Waist circumference was measured (cm) to one decimal place at the height of the navel level after a slight expiration. Body mass index (BMI) was calculated as weight (kg)/ height squared (m2). Body fat mass was estimated by
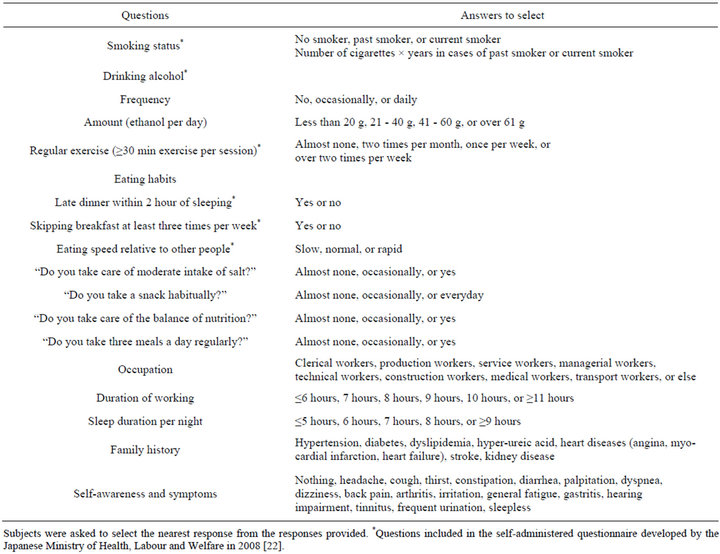
Table 1. Self-reported clinical characteristics.
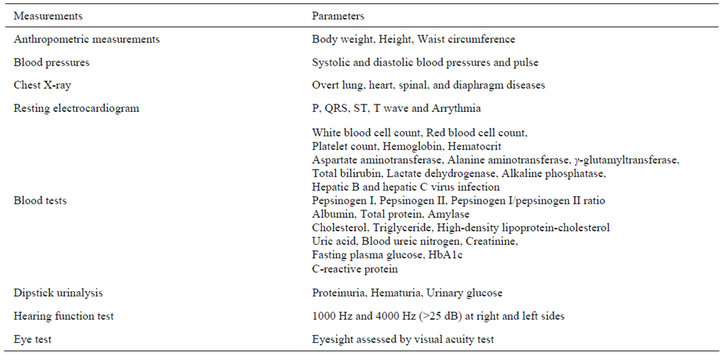
Table 2. Objective measurements.
bioelectric impedance analysis to determine whether fat mass or muscle mass were determinants of high body weight. Serum parameters were measured using standard methods on Hitachi autoanalyzers (Hitachi, Tokyo, Japan) at Saitama Health Promotion Corporation.
While the chest X-ray test was carried out in all subjects, pulmonary function tests were not performed in the checkup. Therefore, we are unable to determine the presence of chronic obstructive pulmonary disease or restrictive lung disease. Indeed, this procedure is useful to detect cancer in regular checkups. However, we did not follow subjects who were diagnosed with cancer in these studies.
2.6. Obesity, Underweight, and Malnutrition
Generally, underweight is defined as a BMI of <18.5 kg/m2, normal weight as 18.5 - 24.9 kg/m2, overweight as 25.0 - 29.9 kg/m2, and obesity as ≥30 kg/m2. Although the BMI ranges for normal weight and over weight are quite broad, the prevalence of underweight and obesity are generally very low in Asian populations, including in Japan. Therefore, in analyses focusing on the relationship between BMI and other factors, the subjects were often divided into six BMI categories (≤18.9, 19.0 - 20.9, 21.0 - 22.9, 23.0 - 24.9, 25.00, 26.9, ≥27.0 kg/m2). We also defined low body weight as a BMI of <19.0 kg/m2, normal BMI as 19.0 - 24.9 kg/m2, and overweight as BMI ≥25.0 kg/m2. This division of BMI was based on the proposal by the World Health Organization that the BMI cutoff values for overweight and obesity for Asian populations should be lower (i.e., ≥23.0 kg/m2 and ≥27.5 kg/m2, respectively) than in Western populations [31]. In Japan, since the proportions of subjects classified as underweight (i.e., <18.5 kg/m2) or obese (i.e., ≥30.0 kg/m2) are very low (<5.0%) [32,33], we often round up the low and high BMI cutoffs to 19 and 27 kg/m2. Nevertheless, before examining the associations between BMI categories with specific clinical conditions or diseases, the overall relationship was first confirmed using BMI as a continuous factor.
Central obesity and visceral obesity were also evaluated in terms of waist circumference, as these may be more strongly associated with metabolic abnormalities, than is BMI [34-36]. Estimated body fat, as assessed by bioelectric impedance analysis, also contributes to the assessment of body composition [37-39].
Obesity is a global pandemic that particularly affects Western countries, whereas low body weight or underweight are more prevalent in Asian populations, including Japan [8,26,40]. Numerous clinical studies have shown that low body weight, like obesity, is also associated with increased mortality, based on a Uor J-shaped relationship between BMI and mortality [11-13]. In this context, we have evaluated the associations of obesity and low body weight with metabolic abnormalities and severe diseases, such as kidney disease.
Although underweight predisposes to malnutrition, low BMI does not always reflect malnutrition. Therefore, to evaluate the nutritional state, we also measured the levels of albumin and total protein, as these reflect overall nutrition status [41-43], together with body weight.
Regarding body height, several studies have provided evidence that a decrease in body height over time can reflect osteoporosis and other diseases, such as impaired lung function [44,45]. Therefore, we intend to investigate the relationship between decreases in body height and various diseases or disorders.
2.7. Cardiovascular Diseases
Resting electrocardiography and chest X-rays were conducted in all subjects aged ≥40 years old. Arrhythmia (e.g., atrial fibrillation, and premature atrial or ventricular contraction) and findings associated with possible ischemia or infarction (e.g., Q, ST, or T wave abnormalities) were assessed. It is also possible to diagnose left ventricular hypertrophy based on electrocardiography and blood pressures.
Hypertension was defined as arterial systolic blood pressure ≥ 140 mmHg and/or diastolic blood pressure ≥ 90 mmHg measured in the morning of the checkup. Blood pressure was measured in seated subjects with the arm placed at heart level. Elevated blood pressure was determined as systolic blood pressure ≥ 130 mmHg and/ or diastolic blood pressure ≥ 85 mmHg according to the Adult Treatment Panel (ATP)-III criteria [1].
2.8. Metabolic Diseases
Metabolic diseases, such as diabetes, prediabetes, and dyslipidemia, were classified using results of laboratory tests according to appropriate clinical guidelines [1,46, 47]. Metabolic syndrome (MetS) was defined according to the Japanese Society of Internal Medicine [48] as the presence of central obesity (waist circumference ≥ 85 cm for men and ≥90 cm for women) plus two or more of the following three abnormal components: 1) high-density lipoprotein cholesterol (HDL-C) < 40 mg/dl or triglyceride ≥ 150 mg/dl; 2) fasting plasma glucose (FPG) ≥ 110 mg/dl; and 3) systolic blood pressure ≥ 130 mmHg or diastolic blood pressure ≥ 85 mmHg.
MetS was also diagnosed using ATP-III criteria [1] using the following cutoff limits: 1) systolic blood pressure ≥ 130 mmHg or diastolic blood pressure ≥85 mmHg; 2) triglyceride ≥ 150 mg/dl; 3) low HDL-C < 40 mg/dl for men and < 50 mg/dl for women; 4) FPG ≥ 100 mg/dl; and 5) waist circumference ≥ 90 cm for men and ≥ 80 cm for women. Subjects meeting three or more of these criteria were defined as having MetS. We took ethnic-specific values for waist circumference into consideration. The number of ATP-III MetS components was evaluated as an index of the degree of metabolic abnormalities. If the subjects were receiving medication for any component of MetS, they were determined to have that component.
Diabetes was defined as fasting plasma glucose ≥ 126 mg/dl or glycosylated hemoglobin (HbA1c) ≥ 6.5% (National Glycoprotein Standardization Program units (NGSP)) according to American Diabetes Association criteria [47], or treatment with oral hypoglycemic drugs or insulin. Most of the patients with diabetes in this study were considered to be type 2 diabetes because this is much more prevalent (90% - 95%) than type 1 diabetes [47], although the diagnosis was not confirmed. HbA1c was measured in Japan Diabetes Society (JDS) HbA1c units, and was converted to NGSP units using the formula HbA1c (%) (NGSP) = 1.02 × HbA1c (JDS) (%) + 0.25%, considering the relational expression of HbA1c (JDS) (%) measured by the previous Japanese standard substance and measurement methods [49].
Low-density lipoprotein-cholesterol (LDL-C) was calculated using the Friedewald formula [50]. Non-highdensity lipoprotein cholesterol (non-HDL-C) was also considered in relation to atherosclerotic diseases because non-HDL-C levels are independent of triglyceride levels and the postprandial state [51,52]. Furthermore, several clinical studies have shown that non-HDL-C levels were more closely associated with cardiovascular outcomes than were LDL-C levels [53]. Therefore, we examined whether non-HDL-C levels were associated with cardiometabolic diseases or unfavorable lifestyle factors.
2.9. Gastroenterology
Serum pepsinogen (PG) levels, a precursor of pepsin, provide an indication of the presence of intestinal metaplasia, cancer, and atrophic gastritis [54-56]. Reduced ghrelin production was also reported to be associated with the extent of atrophic gastritis [57], mostly because of Helicobacter pylori infection [58]. As the gastric hormone ghrelin influences appetite and food intake [59,60], we examined the relationships of serum PG I and the PG I/II ratio with various metabolic factors. In fact, it was reported that the serum PG I/II ratio is significantly correlated with albuminuria in patients with type 2 diabetes [61].
2.10. Liver Disease
Liver dysfunction is assessed based on the serum levels of the hepatic enzymes aspartate aminotransferase (AST), alanine aminotransferase (ALT), and γ-glutamyltransferase. Of these enzymes, ALT is considered to be most specific for liver dysfunction, and is closely associated with the presence of non-alcoholic fatty liver disease (NAFLD) [62]. However, hepatic enzyme levels sometimes remain within the normal ranges [63,64].
Unfortunately, we did not performing imaging studies (e.g., ultrasound, computed tomography, or magnetic resonance imaging) to assess abdominal organs. Therefore, we cannot diagnose fatty liver, including NAFLD, or its more severe condition, non-alcoholic steatohepatitis. However, because elevated hepatic enzymes, especially ALT, are strongly associated with type 2 diabetes, MetS, and NAFLD [62,65], we intend to examine the relationships between elevated hepatic enzymes and metabolic disorders or related conditions.
Additionally, as liver cirrhosis is associated with impaired glucose metabolism, we determined several liver fibrosis scores, including the AST/ALT ratio [66], FIB-4, and AST to platelet ratio index (APRI), as follows:
FIB-4 = age (years) × AST/platelet count (109/l) × ALT1/2 [67];
APRI = [(AST/the upper limit of normal of AST = 35) × 100]/platelet count (109/l) [68].
Additionally, as some subjects had hepatitis B or hepatitis C infection, we performed studies in this subgroup, by comparing the fibrosis scores with other parameters associated with liver and cardiometabolic diseases in these subjects.
We also measured total bilirubin, lactate dehydrogenase, and alkaline phosphatase, which are associated with hepatic function and other systems, including bone and muscle mass. These factors were examined by themselves and as possible confounding factors.
2.11. Serum Amylase Level
Serum amylase levels were measured during checkups. Abnormal serum amylase levels reflect pancreatic or salivary gland dysfunction. The clinical relevance of elevated serum amylase levels has been extensively studied in the context of acute pancreatitis, in particular [69-72]. Meanwhile, low serum amylase is considered as a crude marker for diffuse pancreas destruction secondary to pancreatic diseases, such as advanced chronic pancreatitis [73,74]. In our previous study, low serum amylase, defined as a serum amylase < 60 IU/l, was observed in 25% of asymptomatic individuals and was associated with MetS, diabetes, and NAFLD determined by ultrasound [75,76]. These findings suggest that low serum amylase, which is a theoretical surrogate marker for pancreatic exocrine insufficiency, is associated with endocrine disorders and metabolic abnormalities, indicating a possible pancreatic exocrine-endocrine relationship in certain conditions. Further studies exploring the mechanism behind these associations will be conducted.
2.12. Kidney Disease
Over the last few decades, kidney diseases, especially chronic kidney disease (CKD), has become increasingly prevalent worldwide, and cardiometabolic diseases are associated with the progression of kidney disease and increased risk of mortality [77-79]. CKD is usually characterized by persistent proteinuria and reduced kidney function [77]. In our study, proteinuria was assessed by dipstick urinalysis with fresh single-spot urine specimens. The results were recorded qualitatively as none (−), trace (−/+), +1, +2+, +3, and +4 or greater. Proteinuria was defined as +1 or greater (i.e., 2-5), whereas none (−) or trace (−/+) were considered to be normal. However, depending on the study conditions, trace proteinuria was also analyzed as a separate class of proteinuria to examine its possible association with cardiometabolic factors. Hematuria and urinary glucose, which were assessed by dipstick urinalysis, were also investigated in association with certain diseases and conditions.
Kidney function was assessed by the estimated glomerular filtration rate (eGFR). eGFR was calculated using the Modification Diet in Renal Disease study equation for Japanese subjects [80], as follows:
eGFR (ml/min/1.73m2) = 194 × serum Cr − 1.094 × age − 0.287 (× 0.739 if female)
where Cr = serum creatinine concentration (mg/dl).
Unfortunately, the urinary albumin excretion, and the urinary albumin to creatinine ratio, specific gravity, and other sediments, were not determined in this study.
The most common risk factors for CKD include diabetes, hypertension, cardiovascular disease, and family history of CKD [81]. The Kidney Disease: Improving Global Outcomes (KDIGO) initiative defines CKD as kidney damage (proteinuria and/or hematuria in our study) or decreased eGFR (<60 mL/min/1.73m2) lasting ≥3 months, irrespective of the cause [82]. We examined the possible associations of CKD, proteinuria, or reduced eGFR with cardiometabolic factors and other lifestyle factors.
2.13. Systemic Inflammation
Chronic inflammation is thought to play a crucial role in the development and progression of complications and diseases such as cardiovascular disease and cancer [83- 85]. Subtle systemic inflammation can be detected by highly sensitive system to measure circulating C-reactive protein (CRP), which is associated with central obesity, type 2 diabetes, MetS, and cardiovascular events [86-88]. Serum CRP concentrations were in this study were measured using an automated high-sensitivity immunoassay.
The white blood cell count is also associated with obesity, metabolic disorders, and atherosclerotic diseases [89-91]. Therefore, we investigated the association between systemic inflammation (CRP and white blood cell count) and cardiometabolic factors, while considering other clinical confounders.
Other Diseases and Disorders
1) Anemia Anemia substantially deteriorates the status of existing organ failure [92-94]. Anemia, as assessed by reduced hemoglobin or red blood cell count, will be examined in relation to cardiometabolic conditions, such as CKD and diabetes, because anemia can aggravate the pathophysiology of such diseases [94-96]. In addition, it is possible to determine the cause of anemia by assessing the mean corpuscular volume, mean corpuscular hemoglobin, and mean corpuscular hemoglobin concentration.
2.14. Hearing Dysfunction
Hearing function is examined using an ordinary audiometer in each medical checkup. Advancing age is commonly associated with gradual hearing loss, often known as presbycusis or age-related hearing loss [97-99]. However, the severity of age-related hearing loss varies, even among elderly people [99]. Previous studies have suggested that dyslipidemia, diabetes, and smoking may be associated with sensory hearing loss [100-105]. Therefore, some investigators have proposed that cardiovascular and atherogenic diseases are involved in the pathogenesis of hearing loss. As hearing loss significantly impairs the quality of life of the individual, understanding the underlying mechanism is vital in terms of public health, particularly if hearing loss could be prevented or modified by lifestyle interventions or pharmacotherapy. Therefore, we will examine the associations of hearing loss at 1000 and 4000 Hz with cardiovascular risk factors and lifestyle factors. Hearing loss on the right and left sides was defined as the pure-tone average >25 dB hearing level at 1000 and 4000 Hz.
2.15. Visual Impairment
Visual impairment can have adverse consequences for health and wellbeing. In the past few decades, the prevalence of visual impairments has been increasing worldwide [106-109], particularly among older people [106]. Surveys from 39 countries showed that people aged ≥ 50 years accounted for 65% and 82% of visually impaired and blind individuals, respectively [108]. Some causes of visual impairment include refractive errors, cataract, diabetic retinopathy, and glaucoma. Therefore, we will investigate the potential associations of visual impairment, as assessed by a visual acuity test, with cardiometabolic risk factors and lifestyle factors.
2.16. Data Analysis
In analyses conducted to date, the data were expressed as means ± standard deviation, or medians with interquartile range. Linear trends in clinical parameters across ordered categories were examined by one-way or two-way analysis of variance (ANOVA), or the Cochran-Armitage test. Significant differences in the prevalence rates of categorical parameters across the ordered categories were examined by χ2 tests. Multivariate logistic regression models were used to examine the association between each category and the specific condition/disease of interest in cross-sectional and longitudinal studies. When the proportions of conditions or diseases were very low (e.g., less than 5%), odds ratios will be expressed as relative risks in the longitudinal study [110]. Odds ratios and relative risks of six BMI categories and cardiometabolic factors for proteinuria were calculated, relative to reference categories, without or with adjustment for relevant confounding factors.
In the longitudinal studies, survival analysis and cumulative hazard proportional incidence of the disease/ condition of interest in each categorized group were examined by the Kaplan-Meier method and the log-rank test. Cox proportional hazards model was used to examine the risk of the disease/condition, after controlling for survival time and relevant confounding factors.
Statistical analyses were performed using SAS (SAS, Inc., Cary, North Carolina, USA), IBM-SPSS 18.0 (SPSS Inc., Chicago, IL, USA), or Statview 5.0 (SAS Institute Inc). All P values were two-sided and P < 0.05 was considered statistically significant.
3. Discussion
This article has described the background, rationale, purpose, and methods being used in a series of retrospective observational studies of the SCDOIS. Some strengths and limitations associated with the design of the study should be mentioned. As the database contains subjective and objective data, it is possible to examine the associations of these factors with specific diseases or conditions, with adjustment for multiple potential confounding factors, especially in cross-sectional analyses. Furthermore, observational follow-up of subjects without specific interventions will allow us to observe the natural course of these diseases and conditions, based on changes in objective and subjective parameters in longitudinal analyses. As the checkups were mandatory, irrespective of studies, the data analysis bear no additional costs or require further tests. Additionally, the subjects are not expected to experience any adverse effects by participating in the study.
Although the design of the study allows for a combination of cross-sectional and longitudinal analyses, the available number of subjects available for longitudinal analyses will continually decrease because of loss to follow-up, which may be due to family commitments, attending checkups provided by the employer or a local healthcare center, or moving out of the area.
A potential cause-effect relationship can be predicted, based on the results of longitudinal analyses. However, as no interventions were conducted, the precise causality and mechanism may remain unknown, even after adjusting for relevant confounding factors. Additionally, most subjects were apparently healthy without serious symptoms and disease at the initial checkup, although some subjects may have an increased risk for developing a serious disease in the future. Therefore, the expected prevalence of specific diseases is often very low, which seems to limit the statistical analysis. Furthermore, additional studies performed in other regions or countries will be required to confirm the findings observed in this study, and to explore the potential mechanism, because SCDOIS is not intended to examine the incidence of specific conditions or diseases.
Our ultimate goal is to help detect abnormal conditions relating to cardiometabolic diseases and organ impairment at an earlier stage of the disease course than is currently possible, and to determine the potential mechanism and therapies for these conditions, based on the results of annual medical checkups. We also hope to provide further clinical relevance or support for conventional and routine tests performed in routine medical check-ups. To achieve these goals, we have accumulated a huge amount of data from medical checkups that are commonly to assess an individual subject’s clinical status, but have rarely been used for the purpose of public health and multidisciplinary medical research.
REFERENCES
- S. M. Grundy, J. I. Cleeman, S. R. Daniels, K. A. Donato, R. H. Eckel, B. A. Franklin, D. J. Gordon, R. M. Krauss, P. J. Savage, S. C. Smith Jr., J. A. Spertus and F. Costa (American Heart Association, National Heart, Lung, and Blood Institute), “Diagnosis and Management of the Metabolic Syndrome: An American Heart Association/National Heart, Lung, and Blood Institute Scientific Statement,” Circulation, Vol. 112, 2005, pp. 2735-2752. doi:10.1161/CIRCULATIONAHA.105.169404
- P. Kopelman, “Health Risks Associated with Overweight and Obesity,” Obesity Reviews, Vol. 8, Suppl. 1, 2007, pp. 13-17. doi:10.1111/j.1467-789X.2007.00311.x
- J. B. Dixon, “The Effect of Obesity on Health Outcomes,” Molecular and Cellular Endocrinology, Vol. 316, No. 2, 2010, pp. 104-108. doi:10.1016/j.mce.2009.07.008
- D. W. Lam and D. LeRoith, “The Worldwide Diabetes Epidemic,” Current Opinion in Endocrinology, Diabetes and Obesity, Vol. 19, No. 2, 2012, pp. 93-96.
- V. Sharma and V. Kumar, “Diabetes in Asia,” Lancet, Vol. 375, No. 9719, 2010, p. 982. doi:10.1016/S0140-6736(10)60435-7
- K. Iseki, Y. Ikemiya, C. Iseki, et al., “Proteinuria and the Risk of Developing End-Stage Renal Disease,” Kidney International, Vol. 63, 2003, pp. 1468-1474. doi:10.1046/j.1523-1755.2003.00868.x
- M. Tozawa, K. Iseki, C. Iseki, et al., “Influence of Smoking and Obesity on the Development of Proteinuria,” Kidney International, Vol. 62, 2002, pp. 956-962. doi:10.1046/j.1523-1755.2002.00506.x
- S. Tsugane, “Alcohol, Smoking, and Obesity Epidemiology in Japan,” Journal of Gastroenterology and Hepatology, Vol. 27, Suppl. 2, 2012, pp. 121-126. doi:10.1111/j.1440-1746.2011.07021.x
- B. A. Neuschwander-Tetri and S. H. Caldwell, “Nonalcoholic Steatohepatitis: Summary of an AASLD Single Topic Conference,” Hepatology, Vol. 37, No. 5, 2003, pp. 1202-1219. doi:10.1053/jhep.2003.50193
- B. W. Smith and L. A. Adams, “Non-Alcoholic Fatty Liver Disease,” Critical Reviews in Clinical Laboratory Sciences, Vol. 48, 2011, pp. 97-113. doi:10.3109/10408363.2011.596521
- S. H. Jee, J. W. Sull, J. Park, et al., “Body-Mass Index and Mortality in Korean Men and Women,” New England Journal of Medicine, Vol. 355, 2006, pp. 779-787. doi:10.1056/NEJMoa054017
- A. Berrington de Gonzalez, P. Hartge, J. R. Cerhan, et al., “Body-Mass Index and Mortality among 1.46 Million White Adults,” New England Journal of Medicine, Vol. 363, 2010, pp. 2211-2219. doi:10.1056/NEJMoa1000367
- W. Zheng, D. F. McLerran, B. Rolland, et al., “Association between Body-Mass Index and Risk of Death in More than 1 Million Asians,” New England Journal of Medicine, Vol. 364, 2011, pp. 719-729. doi:10.1056/NEJMoa1010679
- S. Saitoh, “The Tanno-Soubetsu Study,” Nihon Rinsho, Vol. 69, Suppl. 1, 2011, pp. 58-62.
- Y. Kokubo, “The Association of Cardiovascular Disease with Metabolic Syndrome and Its Risk Factors in Japanese Urban Cohort: The Suita Study,” Nihon Rinsho, Vol. 69, Suppl. 1, 2011, pp. 68-76.
- Y. Kiyohara, “The Hisayama Study,” Nihon Rinsho, Vol. 69, Suppl. 1, 2011, pp. 63-67.
- H. Sone, “Diabetes Mellitus and Metabolic Syndrome in Epidemiological Studies,” Nihon Rinsho, Vol. 69, Suppl. 1, 2011, pp. 93-100.
- “Saitama Prefecture at a Glance,” 2012. http://www.pref.saitama.lg.jp/site/english-top/english-saitama-prefecture-at-a-glance.html
- “Saitama Health Promotion,” 2013. http://www.saitama-kenkou.or.jp/
- Y. Li, H. Yatsuya, H. Iso, K. Tamakoshi and H. Toyoshima, “Incidence of Metabolic Syndrome According to Combinations of Lifestyle Factors among Middle-Aged Japanese Male Workers,” Preventive Medicine, Vol. 51, No. 2, 2010, pp. 118-122. doi:10.1016/j.ypmed.2010.04.016
- A. Morimoto, Y. Ohno, Y. Tatsumi, Y. Nishigaki, F. Maejima, S. Mizuno and S. Watanabe, “Risk of Smoking and Body Mass Index for Incidence of Diabetes Mellitus in a Rural Japanese Population,” Preventive Medicine, Vol. 54, No. 5, 2012, pp. 341-344. doi:10.1016/j.ypmed.2012.02.016
- Ministry of Health, “Labour, and Welfare: Health Examination and Guidance Program for Japanese Adults,” 2008. http://www.mhlw.go.jp/bunya/shakaihosho/iryouseido01/info02a.html
- E. Chen and G. E. Miller, “Socioeconomic Status and Health: Mediating and Moderating Factors,” Annual Review of Clinical Psychology, Vol. 9, 2013, pp. 723-749.
- R. E. Patzer and W. M. McClellan, “Influence of Race, Ethnicity and Socioeconomic Status on Kidney Disease,” Nature Reviews Nephrology, Vol. 8, 2012, pp. 533-541. doi:10.1038/nrneph.2012.117
- N. M. Hawkins, P. S. Jhund, J. J. McMurray and S. Capewell, “Heart Failure and Socioeconomic Status: Accumulating Evidence of Inequality,” European Journal of Heart Failure, Vol. 14, No. 2, 2012, pp. 138-146. doi:10.1093/eurjhf/hfr168
- R. Otsuka, K. Tamakoshi, H. Yatsuya, et al., “Eating Fast Leads to Obesity: Findings Based on Self-Administered Questionnaires among Middle-Aged Japanese Men and Women,” Journal of Epidemiology, Vol. 16, No. 3, 2006, pp. 117-124. doi:10.2188/jea.16.117
- K. Maruyama, S. Sato, T. Ohira, et al., “The Joint Impact on Being Overweight of Self Reported Behaviours of Eating Quickly and Eating until Full: Cross Sectional Survey,” BMJ, Vol. 337, 2008, p. a2002.
- S. Tanihara, T. Imatoh, M. Miyazaki, et al., “Retrospective Longitudinal Study on the Relationship between 8-Year Weight Change and Current Eating Speed,” Appetite, Vol. 57, No. 1, 2011, pp. 179-183. doi:10.1016/j.appet.2011.04.017
- M. Sakurai, K. Nakamura, K. Miura, et al., “Self-Reported Speed of Eating and 7-Year Risk of Type 2 Diabetes Mellitus in Middle-Aged Japanese Men,” Metabolism, Vol. 61, No. 11, 2012, pp. 1566-1571. doi:10.1016/j.metabol.2012.04.005
- T. Ohkuma, H. Fujii, M. Iwase, et al., “Impact of Eating Rate on Obesity and Cardiovascular Risk Factors According to Glucose Tolerance Status: The Fukuoka Diabetes Registry and the Hisayama Study,” Diabetologia, Vol. 56, No. 1, 2013, pp. 70-77.
- WHO Expert Consultation, “Appropriate Body-Mass Index for Asian Populations and Its Implications for Policy and Intervention Strategies,” Lancet, Vol. 363, No. 9403, 2004, pp. 157-163. doi:10.1016/S0140-6736(03)15268-3
- K. Nakajima, H. Yamaoka, K. Morita, M. Ebata, S. Eguchi, T. Muneyuki and H. Munakata, “Elderly People with Low Body Weight May Have Subtle Low-Grade Inflammation,” Obesity (Silver Spring), Vol. 17, No. 4, 2009, pp. 803-808. doi:10.1038/oby.2008.596
- M. Nagai, S. Kuriyama, M. Kakizaki, K. Ohmori-Matsuda, T. Sone, A. Hozawa, M. Kawado, S. Hashimoto and I. Tsuji, “Impact of Obesity, Overweight and Underweight on Life Expectancy and Lifetime Medical Expenditures: The Ohsaki Cohort Study,” BMJ Open, Vol. 2, No. 3, 2012, Article ID: e000940. doi:10.1136/bmjopen-2012-000940
- D. J. Nieves, M. Cnop, B. Retzlaff, C. E. Walden, J. D. Brunzell, R. H. Knopp and S. E. Kahn, “The Atherogenic Lipoprotein Profile Associated with Obesity and Insulin Resistance Is Largely Attributable to Intra-Abdominal Fat,” Diabetes, Vol. 52, No. 1, 2003, pp. 172-179. doi:10.2337/diabetes.52.1.172
- S. Zhu, S. B. Heymsfield, H. Toyoshima, Z. Wang, A. Pietrobelli and S. Heshka, “Race-Ethnicity-Specific Waist Circumference Cutoffs for Identifying Cardiovascular Disease Risk Factors,” American Journal of Clinical Nutrition, Vol. 81, No. 2, 2005, pp. 409-415.
- R. Ness-Abramof and C. M. Apovian, “Waist Circumference Measurement in Clinical Practice,” Nutrition in Clinical Practice, Vol. 23, No. 4, 2008, pp. 397-404. doi:10.1177/0884533608321700
- T. Miyawaki, N. Azuma, Y. Fukunaga and N. Kobayashi, “Abdomen Specific Bioelectrical Impedance Analysis (BIA) Methods for Evaluation of Visceral Fat Accumulation,” Nihon Rinsho, Vol. 69, No. S1, 2011, pp. S470- S472.
- S. J. Loveday, J. M. Thompson and E. A. Mitchell, “Bioelectrical Impedance for Measuring Percentage Body Fat in Young Persons with Down Syndrome: Validation with Dual-Energy Absorptiometry,” Acta Paediatrica, Vol. 101, No. 11, 2012, pp. e491-e495. doi:10.1111/j.1651-2227.2012.02821.x
- K. H. Pietiläinen, S. Kaye, A. Karmi, L. Suojanen, A. Rissanen and K. A. Virtanen, “Agreement of Bioelectrical Impedance with Dual-Energy X-Ray Absorptiometry and MRI to Estimate Changes in Body Fat, Skeletal Muscle and Visceral Fat during a 12-Month Weight Loss Intervention,” The British Journal of Nutrition, Vol. 109, No. 10, 2012, pp. 1-7.
- Y. Balarajan and E. Villamor, “Nationally Representative Surveys Show Recent Increases in the Prevalence of Overweight and Obesity among Women of Reproductive Age in Bangladesh, Nepal, and India,” The Journal of Nutrition, Vol. 139, No. 11, 2009, pp. 2139-2144. doi:10.3945/jn.109.112029
- S. E. Gariballa, “Nutritional Factors in Stroke,” The British Journal of Nutrition, Vol. 84, No. 1, 2000, pp. 5-17. doi:10.1017/S0007114500001173
- H. Shibata, “Nutritional Factors on Longevity and Quality of Life in Japan,” The Journal of Nutrition, Health & Aging, Vol. 5, No. 2, 2001, pp. 97-102.
- A. González Madroño, A. Mancha, F. J. Rodríguez, J. I. de Ulibarri and J. Culebras, “The Use of Biochemical and Immunological Parameters in Nutritional Screening and Assessment,” Nutricion Hospitalaria, Vol. 26, No. 3, 2011, pp. 594-601.
- D. Bunout, G. Barrera, M. P. de la Maza, L. Leiva, V. Gattas and S. Hirsch, “Height Reduction, Determined Using Knee Height Measurement as a Risk Factor or Predictive Sign for Osteoporosis in Elderly Women,” Nutrition, Vol. 23, No. 11, 2007, pp. 794-797. doi:10.1016/j.nut.2007.08.012
- A. Kjensli, M. Ryg, J. A. Falch, G. Armbrecht, L. M. Diep, E. F. Eriksen and I. Ellingsen, “Does Body Height Reduction Influence Interpretation of Lung Function in COPD Patients?” European Respiratory Journal, Vol. 36, No. 3, 2010, pp. 540-548. doi:10.1183/09031936.00148609
- American Diabetes Association, “Diagnosis and Classification of Diabetes Mellitus,” Diabetes Care, Vol. 33, No. S1, pp. S62-S69. doi:10.2337/dc10-S062
- N. Unwin, J. Shaw, P. Zimmet, et al., “Impaired Glucose Tolerance and Impaired Fasting Glycaemia: The Current Status on Definition and Intervention,” Diabetic Medicine, Vol. 19, No. 9, 2002, pp. 708-723. doi:10.1046/j.1464-5491.2002.00835.x
- Committee for the Diagnostic Criteria of Metabolic Syndrome, “The Definition and Diagnostic Criteria of Metabolic Syndrome,” Nippon Naika Gakkai Zasshi, Vol. 94, No. 4, 2005, pp. 794-809. doi:10.2169/naika.94.794
- A. Kashiwagi, M. Kasuga, E. Araki, et al., “International Clinical Harmonization of Glycated Hemoglobin in Japan: From Japan Diabetes Society to National Glycohemoglobin Standardization Program Values,” Journal of Diabetes Investigation, Vol. 3, No. 1, 2012, pp. 39-40. doi:10.1111/j.2040-1124.2012.00207.x
- W. T. Friedewald, R. I. Levy and D. S. Fredrickson, “Estimation of the Concentration of Low-Density Lipoprotein Cholesterol in Plasma, without Use of the Preparative Ultracentrifuge,” Clinical Chemistry, Vol. 18, No. 6, 1972, pp. 499-502.
- A. Sniderman, M. McQueen, J. Contois, K. Williams and C. D. Furberg, “Why Is Non-High-Density Lipoprotein Cholesterol a Better Marker of the Risk of Vascular Disease than Low-Density Lipoprotein Cholesterol?” Journal of Clinical Lipidology, Vol. 4, No. 3, 2010, pp. 152-155. doi:10.1016/j.jacl.2010.03.005
- V. Ramjee, L. S. Sperling and T. A. Jacobson, “NonHigh-Density Lipoprotein Cholesterol versus Apolipoprotein B in Cardiovascular Risk Stratification: Do the Math,” Journal of the American College of Cardiology, Vol. 58, No. 5, 2011, pp. 457-463. doi:10.1016/j.jacc.2011.05.009
- J. S. Rana and S. M. Boekholdt, “Should We Change Our Lipid Management Strategies to Focus on Non-HighDensity Lipoprotein Cholesterol?” Current Opinion in Cardiology, Vol. 25, No. 6, 2010, pp. 622-626. doi:10.1097/HCO.0b013e32833f0365
- K. Miki and Y. Urita, “Using Serum Pepsinogens Wisely in a Clinical Practice,” Journal of Digestive Diseases, Vol. 8, No. 1, 2007, pp. 8-14. doi:10.1111/j.1443-9573.2007.00278.x
- C. Mukoubayashi, K. Yanaoka, H. Ohata, K. Arii, H. Tamai, M. Oka and M. Ichinose, “Serum Pepsinogen and Gastric Cancer Screening,” Internal Medicine, Vol. 46, No. 6, 2007, pp. 261-266. doi:10.2169/internalmedicine.46.6181
- M. N. Weck and H. Brenner, “Association of Helicobacter pylori Infection with Chronic Atrophic Gastritis: Meta-Analyses according to Type of Disease Definition,” International Journal of Cancer, Vol. 123, No. 4, 2008, pp. 874-881. doi:10.1002/ijc.23539
- J. Kawashima, S. Ohno, T. Sakurada, H. Takabayashi, M. Kudo, S. Ro, S. Kato and K. Yakabi, “Circulating Acylated Ghrelin Level Decreases in accordance with the Extent of Atrophic Gastritis,” Journal of Gastroenterology, Vol. 44, No. 10, 2009, pp. 1046-1054. doi:10.1007/s00535-009-0120-0
- H. Osawa, “Ghrelin and Helicobacter pylori Infection,” World Journal of Gastroenterology, Vol. 14, No. 41, 2008, pp. 6327-6333. doi:10.3748/wjg.14.6327
- N. E. Hill, K. G. Murphy and M. Singer, “Ghrelin, Appetite and Critical Illness,” Current Opinion in Critical Care, Vol. 18, No. 2, 2012, pp. 199-205. doi:10.1097/MCC.0b013e3283514b01
- H. Kirchner, K. M. Heppner and M. H. Tschöp, “The Role of Ghrelin in the Control of Energy Balance,” Handbook of Experimental Pharmacology, Vol. 209, 2012, pp. 161-184. doi:10.1007/978-3-642-24716-3_7
- T. Senmaru, M. Fukui, M. Kuroda, M. Tanaka, E. Ushigome, K. Sakabe, N. Nakanishi, Y. Mineoka, M. Asano, M. Yamazaki, G. Hasegawa and N. Nakamura, “Serum Pepsinogen I/II Ratio Is Correlated with Albuminuria in Patients with Type 2 Diabetes,” Endocrine Journal, Vol. 60, No. 2, 2012, pp. 161-166.
- R. K. Schindhelm, M. Diamant, J. M. Dekker, M. E. Tushuizen, T. Teerlink and R. J. Heine, “Alanine Aminotransferase as a Marker of Non-Alcoholic Fatty Liver Disease in Relation to Type 2 Diabetes Mellitus and Cardiovascular Disease,” Diabetes/Metabolism Research and Reviews, Vol. 22, No. 6, 2006, pp. 437-443. doi:10.1002/dmrr.666
- Y. Chang, S. Ryu, E. Sung and Y. Jang, “Higher Concentrations of Alanine Aminotransferase within the Reference Interval Predict Nonalcoholic Fatty Liver Disease,” Clinical Chemistry, Vol. 53, No. 4, 2007, pp. 686-692. doi:10.1373/clinchem.2006.081257
- N. Ghouri, D. Preiss and N. Sattar, “Liver Enzymes, Nonalcoholic Fatty Liver Disease, and Incident Cardiovascular Disease: A Narrative Review and Clinical Perspective of Prospective Data,” Hepatology, Vol. 52, No. 3, 2010, pp. 1156-1161. doi:10.1002/hep.23789
- L. A. Adams, O. R. Waters, M. W. Knuiman, R. R. Elliott and J. K. Olynyk, “NAFLD as a Risk Factor for the Development of Diabetes and the Metabolic Syndrome: An Eleven-Year Follow-Up Study,” The American Journal of Gastroenterology, Vol. 104, No. 4, 2009, pp. 861-867.
- A. Iacobellis, M. Marcellini, A. Andriulli, et al., “Non Invasive Evaluation of Liver Fibrosis in Paediatric Patients with Nonalcoholic Steatohepatitis,” World Journal of Gastroenterology, Vol. 12, No. 48, 2006, pp. 7821- 7825.
- A. Vallet-Pichard, V. Mallet, B. Nalpas, et al., FIB-4: An Inexpensive and Accurate Marker of Fibrosis in HCV Infection,” Hepatology, Vol. 46, No. 1, 2007, pp. 32-36. doi:10.1002/hep.21669
- C. T. Wai, J. K. Greenson, R. J. Fontana, et al., “A Simple Noninvasive Index Can Predict both Significant Fibrosis and Cirrhosis in Patients with Chronic Hepatitis C,” Hepatology, Vol. 38, No. 2, 2003, pp. 518-526. doi:10.1053/jhep.2003.50346
- B. Yegneswaran, C. S. Pitchumoni, B. Yegneswaran, et al., “When Should Serum Amylase and Lipase Levels Be Repeated in a Patient with Acute Pancreatitis?” Cleveland Clinic Journal of Medicine, Vol. 77, No. 4, 2010, pp. 230-231. doi:10.3949/ccjm.77a.09083
- J. Skrha and J. Stěpán, “Clinical Significance of Amylase Isoenzyme Determination,” Acta Universitatis Carolinae. Medica. Monographia, Vol. 120, 1987, pp. 1-81.
- C. Pieper-Bigelow, A. Strocchi and M. D. Levitt, “Where Does Serum Amylase Come from and Where Does It Go?” Gastroenterology Clinics of North America, Vol. 19, No. 4, 1990, pp. 793-810.
- M. J. Collen, A. F. Ansher, A. B. Chapman, et al., “Serum Amylase in Patients with Renal Insufficiency and Renal Failure,” The American Journal of Gastroenterology, Vol. 85, No. 10, 1990, pp. 1377-1380.
- J. E. Domínguez-Muñoz, O. Pieramico, M. Büchler, et al., “Ratios of Different Serum Pancreatic Enzymes in the Diagnosis and Staging of Chronic Pancreatitis,” Digestion, Vol. 54, No. 4, 1993, pp. 231-236. doi:10.1159/000201042
- R. O. Wolf, V. S. Hubbard, B. K. Gillard, et al., “Three Methods Compared for Determination of Pancreatic and Salivary Amylase Activity in Serum of Cystic Fibrosis Patients,” Clinical Chemistry, Vol. 32, No. 2, 1986, pp. 296-300.
- K. Nakajima, T. Nemoto, T. Muneyuki, et al., “Low Serum Amylase in Association with Metabolic Syndrome and Diabetes: A Community-Based Study,” Cardio Vascular Diabetology, Vol. 10, No. 34, 2011. doi:10.1186/1475-2840-10-34
- K. Nakajima, H. Oshida, T. Muneyuki, M. Saito, Y. Hori, H. Fuchigami, M. Kakei and H. Munakata, “Independent Association between Low Serum Amylase and Non-Alcoholic Fatty Liver Disease in Asymptomatic Adults: A Cross-Sectional Observational Study,” BMJ Open, Vol. 3, No. 1, 2013, Article ID: e002235. doi:10.1136/bmjopen-2012-002235
- A. S. Levey, J. Coresh, E. Balk, et al., “National Kidney Foundation: National Kidney Foundation Practice Guidelines for Chronic Kidney Disease: Evaluation, Classification, and Stratification,” Annals of Internal Medicine, Vol. 139, No. 2, 2003, pp. 137-147. doi:10.7326/0003-4819-139-2-200307150-00013
- R. M. Tanner, T. M. Brown and P. Muntner, “Epidemiology of Obesity, the Metabolic Syndrome, and Chronic Kidney Disease,” Current Hypertension Reports, Vol. 14, No. 2, 2012, pp. 152-159. doi:10.1007/s11906-012-0254-y
- M. Praga and E. Morales, “Obesity, Proteinuria and Progression of Renal Failure,” Current Opinion in Nephrology and Hypertension, Vol. 15, No. 5, 2006, pp. 481-486.
- S. Matsuo, E. Imai, M. Horio, et al., “Revised Equations for Estimated GFR from Serum Creatinine in Japan,” American Journal of Kidney Diseases, Vol. 53, No. 6, 2009, pp. 982-992.doi:10.1053/j.ajkd.2008.12.034
- J. A. Vassalotti, L. A. Stevens and A. S. Levey, “Testing for Chronic Kidney Disease: A Position Statement from the National Kidney Foundation,” American Journal of Kidney Diseases, Vol. 50, 2007, pp. 169-180. doi:10.1053/j.ajkd.2007.06.013
- A. S. Levey, K. U. Eckardt, Y. Tsukamoto, A. Levin, J. Coresh, J. Rossert, D. De Zeeuw, T. H. Hostetter, N. Lameire and G. Eknoyan, “Definition and Classification of Chronic Kidney Disease: A Position Statement from Kidney Disease: Improving Global Outcomes (KDIGO),” Kidney International, Vol. 67, 2005, pp. 2089-2100. doi:10.1111/j.1523-1755.2005.00365.x
- P. Libby, P. M. Ridker and A. Maseri, “Inflammation and Atherosclerosis,” Circulation, Vol. 105, 2002, pp. 1135- 1143. doi:10.1161/hc0902.104353
- M. J. Gunter, R. Stolzenberg-Solomon, A. J. Cross, et al., “A Prospective Study of Serum C-Reactive Protein and Colorectal Cancer Risk in Men,” Cancer Research, Vol. 66, 2006, pp. 2483-2487. doi:10.1158/0008-5472.CAN-05-3631
- V. Chiurchiù and M. Maccarrone, “Chronic Inflammatory Disorders and Their Redox Control: From Molecular Mechanisms to Therapeutic Opportunities,” Antioxidants & Redox Signaling, Vol. 15, No. 9, 2011, pp. 2605-2641. doi:10.1089/ars.2010.3547
- E. T. Yeh, “High-Sensitivity C-Reactive Protein as a Risk Assessment Tool for Cardiovascular Disease,” Clinical Cardiology, Vol. 28, No. 9, 2005, pp. 408-412. doi:10.1002/clc.4960280905
- K. Musunuru, B. G. Kral, R. S. Blumenthal, V. Fuster, C. Y. Campbell, T. J. Gluckman, R. A. Lange, E. J. Topol, J. T. Willerson, M. Y. Desai, M. H. Davidson and S. Mora, “The Use of High-Sensitivity Assays for C-Reactive Protein in Clinical Practice,” Nature Clinical Practice Cardiovascular Medicine, Vol. 5, No. 10, 2008, pp. 621-635. doi:10.1038/ncpcardio1322
- S. Devaraj, S. Valleggi, D. Siegel and I. Jialal, “Role of C-Reactive Protein in Contributing to Increased Cardiovascular Risk in Metabolic Syndrome,” Current Atherosclerosis Reports, Vol. 12, No. 2, 2010, pp. 110-118. doi:10.1007/s11883-010-0098-3
- E. Cavusoglu, V. Chopra, A. Gupta, C. Ruwende, S. Yanamadala, C. Eng, L. T. Clark, D. J. Pinsky and J. D. Marmur, “Usefulness of the White Blood Cell Count as a Predictor of Angiographic Findings in an Unselected Population Referred for Coronary Angiography,” American Journal of Cardiology, Vol. 98, No. 9, 2006, pp. 1189-1193. doi:10.1016/j.amjcard.2006.05.048
- Y. J. Lee, Y. H. Shin, J. K. Kim, J. Y. Shim, D. R. Kang and H. R. Lee, “Metabolic Syndrome and Its Association with White Blood Cell Count in Children and Adolescents in Korea: The 2005 Korean National Health and Nutrition Examination Survey,” Nutrition, Metabolism & Cardiovascular Diseases, Vol. 20, No. 3, 2010, pp. 165- 172. doi:10.1016/j.numecd.2009.03.017
- S. B. Chen, Y. C. Lee, K. H. Ser, J. C. Chen, S. C. Chen, H. F. Hsieh and W. J. Lee, “Serum C-Reactive Protein and White Blood Cell Count in Morbidly Obese Surgical Patients,” Obesity Surgery, Vol. 19, No. 4, 2009, pp. 461- 466. doi:10.1007/s11695-008-9619-3
- A. K. Agarwal and S. D. Katz, “Future Directions in Management of Anemia in Heart Failure,” Heart Failure Clinics, Vol. 6, No. 3, 2010, pp. 385-395. doi:10.1016/j.hfc.2010.03.004
- S. von Haehling, M. S. Anker, E. A. Jankowska, P. Ponikowski and S. D. Anker, “Anemia in Chronic Heart Failure: Can We Treat? What to Treat?” Heart Failure Reviews, Vol. 17, No. 2, 2012, pp. 203-210. doi:10.1007/s10741-011-9283-x
- A. K. Singh, “Diabetes, Anemia and CKD: Why TREAT? Current Diabetes Reports, Vol. 10, No. 4, 2010, pp. 291- 296. doi:10.1007/s11892-010-0123-5
- S. Fishbane and N. Miyawaki, “Anemia Treatment in Chronic Kidney Disease Accompanied by Diabetes Mellitus or Congestive Heart Failure,” Kidney International, Vol. 77, No. 3, 2010, pp. 175-177.
- E. Villar, M. Lièvre, M. Kessler, V. Lemaître, E. Alamartine, M. Rodier, M. François, P. Zaoui, O. Moranne, G. Choukroun, A. Guerraoui, A. Jolivot, G. Janin, B. Branger, A. E. Heng, C. Boudray, A. Bissery, M. Rabilloud and C. Pouteil-Noble, “Anemia Normalization in Patients with Type 2 Diabetes and Chronic Kidney Disease: Results of the NEPHRODIAB2 Randomized Trial,” Journal of Diabetes and Its Complications, Vol. 25, No. 4, 2011, pp. 237-243. doi:10.1016/j.jdiacomp.2011.03.003
- A. Howarth and G. R. Shone, “Ageing and the Auditory System,” Postgraduate Medical Journal, Vol. 82, 2006, pp. 166-171.doi:10.1136/pgmj.2005.039388
- X. Z. Liu and D. Yan, “Ageing and Hearing Loss,” The Journal of Pathology, Vol. 211, No. 2, 2007, pp. 188-197.
- Q. Huang and J. Tang, “Age-Related Hearing Loss or Presbycusis,” European Archives of Oto-Rhino-Laryngology, Vol. 267, No. 8, 2010, pp. 1179-1191. doi:10.1007/s00405-010-1270-7
- L. D. Lowry and S. R. Isaacson, “Study of 100 Patients with Bilateral Sensorineural Hearing Loss for Lipid Abnormalities,” Annals of Otology, Rhinology, Laryngology, Vol. 87, No. 3, 1978, pp. 404-408.
- I. Pyykkö, K. Koskimies, J. Starck, J. Pekkarinen, R. Inaba, “Evaluation of Factors Affecting Sensory Neural Hearing Loss,” Acta Oto-laryngologica, Vol. 105, No. S449, 1988, pp. 155-158. doi:10.3109/00016488809106400
- K. Suzuki, M. Kaneko and K. Murai, “Influence of Serum Lipids on Auditory Function,” Laryngoscope, Vol. 110, No. 10, 2000, pp. 1736-1738. doi:10.1097/00005537-200010000-00033
- V. Kakarlapudi, R. Sawyer and H. Staecker, “The Effect of Diabetes on Sensorineural Hearing Loss,” Otology & Neurotology, Vol. 24, No. 3, 2003, pp. 382-386. doi:10.1097/00129492-200305000-00006
- D. F. Austin, D. Konrad-Martin, S. Griest, G. P. McMillan, D. McDermott and S. Fausti, “Diabetes-Related Changes in Hearing,” Laryngoscope, Vol. 119, No. 9, 2009, pp. 1788-1796. doi:10.1002/lary.20570
- K. E. Bainbridge, Y. J. Cheng and C. C. Cowie, “Potential Mediators of Diabetes-Related Hearing Impairment in the U.S. Population: National Health and Nutrition Examination Survey 1999-2004,” Diabetes Care, Vol. 33, No. 4, 2010, pp. 811-816. doi:10.2337/dc09-1193
- M. E. Cupples, P. M. Hart, A. Johnston and A. J. Jackson, “Improving Healthcare Access for People with Visual Impairment and Blindness,” BMJ, Vol. 344, 2012, Article ID: e542. doi:10.1136/bmj.e542
- J. M. Furtado, V. C. Lansingh, M. J. Carter, M. F. Milanese, B. N. Peña, H. A. Ghersi, P. L. Bote, M. E. Nano and J. C. Silva, “Causes of Blindness and Visual Impairment in Latin America,” Survey of Ophthalmology, Vol. 57, No. 2 , 2012, pp. 149-177. doi:10.1016/j.survophthal.2011.07.002
- D. Pascolini and S. P. Mariotti, “Global Estimates of Visual Impairment: 2010,” British Journal of Ophthalmology, Vol. 96, No. 5, 2012, pp. 614-618. doi:10.1136/bjophthalmol-2011-300539
- F. Ko, S. Vitale, C. F. Chou, M. F. Cotch, J. Saaddine and D. S. Friedman, “Prevalence of Nonrefractive Visual Impairment in U.S. Adults and Associated Risk Factors, 1999-2002 and 2005-2008,” The Journal of the American Medical Association, Vol. 308, No. 22, 2012, pp. 2361- 2368.
- C. Zocchetti, D. Consonni and P. A. Bertazzi, “Relationship between Prevalence Rate Ratios and Odds Ratios in Cross-Sectional Studies,” International Journal of Epidemiology, Vol. 26, No. 1, 1997, pp. 220-223. doi:10.1093/ije/26.1.220
Abbreviations
ATP: Adult Treatment Panel;
BMI: Body Mass Index;
CKD: Chronic Kidney Disease;
CRP: C-Reactive Protein;
eGFR: Estimated Glomerular Filtration Rate;
FPG: Fasting Plasma Glucose;
HbA1c: Glycosylated Hemoglobin;
HDL-C: High-Density Lipoprotein Cholesterol;
MetS: Metabolic Syndrome;
NAFLD: Non-Alcoholic Fatty Liver Disease;
NGSP: National Glycohemoglobin Standardization Program;
PG: Pepsinogen;
SCDOIS: Saitama Cardiometabolic Disease and Organ Impairment Study.
NOTES
*Competing interests: The authors declare that they have no competing interests.
Acknowledgments and funding: None.
Grant support: None.
#Corresponding author.