Open Journal of Civil Engineering
Vol.3 No.2A(2013), Article ID:33218,13 pages DOI:10.4236/ojce.2013.32A008
Simulating the Seismic Response of Concentrically Braced Frames Using Physical Theory Brace Models
Department of Civil, Geological, and Mining Engineering, Ecole Polytechnique, Montreal, Canada
Department of Building, Civil and Environmental Engineering, Concordia University, Montreal, Canada
Email: Lucia.Tirca@concordia.ca
Copyright © 2013 Liang Chen, Lucia Tirca. This is an open access article distributed under the Creative Commons Attribution License, which permits unrestricted use, distribution, and reproduction in any medium, provided the original work is properly cited.
Received May 11, 2013; revised June 12, 2013; accepted June 22, 2013
Keywords: Brace Model; Plastic Hinge; Hysteretic Energy; Seismic Response; Time-History Analysis
ABSTRACT
The aim of this paper is to assess the accuracy of brace models formulated in Drain 2DX and OpenSees by comparing the simulated results with those obtained from experimental tests. Both, Drain 2DX and OpenSees rely on the physical theory brace model. In this study, experimental tests conducted on the behaviour of structural hollow section braces subjected to symmetric and asymmetric quasi-static cyclic loading were selected for calibrating the numerical model. In addition, the predicted failure strain parameter resulted from a proposed empirical equation as a function of slenderness ratio, width-to-thickness ratio and steel properties was used to define the low-cycle fatigue material that was assigned to model braces in OpenSees. It is concluded that both Drain 2DX and OpenSees brace models give a good prediction in terms of maximum tensile and buckling force, as well as interstorey drift. However, in Drain 2DX, the brace model is not able to replicate the out-of-plan buckling and the braced frame model cannot provide an accurate response when the system experiences highly nonlinear demand. To emphasise the differences in performance between Drain 2DX and OpenSees, the behaviour of a 4-storey concentrically braced frame with zipper bracing configuration, located in Victoria, BC, was investigated.
1. Introduction
Concentrically braced frames (CBFs) are widely used in Canada. Brace members dissipate hysteretic energy when buckle in compression and yield in tension. Upon buckling, braces behave elastically while deforming in flexure until a maximum bending moment is reached at the brace mid-length. To prevent the occurrence of local buckling and in order to maintain the plastic moment capacity through sufficient rotation, the CSA/S16-2009 provisions [1] require braces to comply to class 1 sections. Under cyclic loading, the hysteretic response of braces is asymmetric and varies with brace slenderness. Accordingly, slender braces dissipate lower hysteresis energy in compression than stocky braces, whereas, stocky braces are prone to exhibit tensile fracture due to low-cycle fatigue. For the nonlinear simulation of brace response under cyclic loading, researchers may choose among the following existing brace models: finite element, phenomenological, and physical theory. In both programming languages of Drain 2DX [2] and OpenSees (Open System for Earthquake Engineering Simulation) [3], the physical theory brace model, defined by simplified theoretical methods based on physical considerations, was considered. For instance, the refined physical theory brace model developed by Ikeda and Mahin [4] was implemented in Drain 2DX by Taddei [5] as Element 05. Later on, the physical theory brace model was employed in the OpenSees framework. The OpenSees brace model consists of force-based nonlinear beam-column elements with spread plasticity and fiber formulation. In addition, Uriz [6] embedded the rainflow cyclic counting technique to record the simulated fracture strain developed in each one of the cross-sectional fibers of the hollow structural section (HSS) of brace. Although this approach of wrapping fatigue material to parental material is an advanced technique in simulating the fracture due to the low-cycle fatigue, the applied method does not incorporate the local buckling. Herein, the simplified rainflow cyclic counting method considers only a few recent cycles to assess the cumulative damage. However, to account for local buckling, continuum accumulating damage models that are based on the damage mechanism models rather than cyclic counting algorithm [7] may be used, but the continuum-based modelling technique is not applicable for fiber-based formulation.
Although the OpenSees versus the Drain 2DX brace model allows three-dimensional simulation and refinement in definition, some of the assumptions may not been valid. For example, the fiber formulation considers only the uniaxial material properties, while multi-axial stress state and local buckling or cross-sectional distortion cannot be replicated [8].
Therefore, the purpose of this research is to emphasise the differences between the inelastic behaviour of HSS braces simulated in OpenSees and Drain 2DX. In addition, the behaviour of a 4-storey CBF building with zipper bracing configuration located in Victoria, BC is investigated.
2. Refined Physical Theory Brace Model in Drain 2DX
The refined physical theory brace model proposed by Ikeda and Mahin [4] consists of two elastic beam segments joined with a plastic hinge located at the member’s mid-length (Figure 1). The beam segments allow elastic axial and flexural deformations while the state of the plastic hinge is defined by the axial force versus plastic hinge moment curve, P-M. The brace model is based on parameters that map the P-M interaction curve and a set of two linear empirical curves that incorporate material nonlinearity, while defining changes in the tangent modulus of elasticity, Et.. As illustrated in Figure 1, when the brace member is loaded in compression under the force P, it causes a mid-span deflection Δ which increases with the axial shortening deformation δ until the plastic hinge rotation q is reached under the internal moment, M.
During this state, the relationship P-δ is linear and the deflected shape of the brace is obtained by solving the basic beam equation. When the axial force triggered in the brace reaches the buckling load, the hysteresis cycle follows the implemented P-M interaction curve. As formulated and illustrated in Figure 2, the brace’s hysteresis cycle is divided in four zones: elastic, plastic, yielding and buckling. Herein, the elastic and plastic state is linked to the plastic hinge, while the yielding state to the elastic beam segments. The elastic zone is divided into
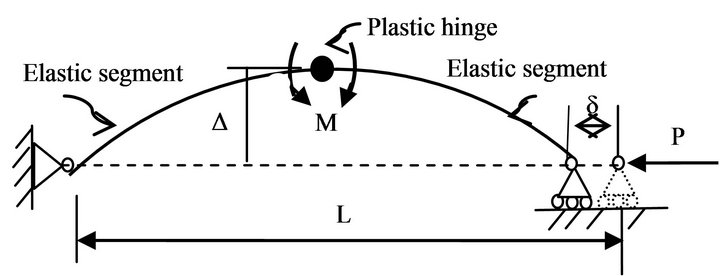
Figure 1. Brace member formulation in Drain 2DX.
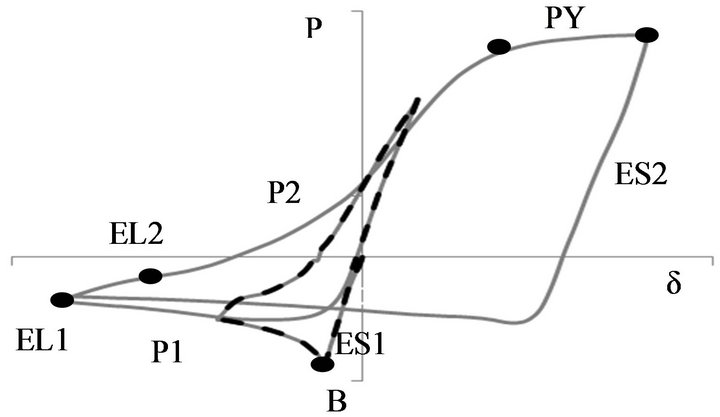
Figure 2. Hysteresis zones in the Drain 2DX brace model.
shortening (ES2 and ES1) and lengthening zones (EL2 and EL1) both in tension and compression. The plastic zones, P1 and P2, refer to the postbuckling strength degradation after buckling has occurred and to the yielding zone after the tensile force, Py, was reached. The plastic hinge rotation characterised by an elasto-perfectly plastic material is assumed to occur only in the plastic zone and is defined as a function of axial force, P, and history of cyclic loading.
In order to simulate the refined brace model (Element 05), Ikeda and Mahin [4] have proposed a set of empirical parameters (p12, b1, c1, a2, b2) with the aim to define the theoretical P-M interaction curve. The two parabolic equations that incorporate these parameters are:
for 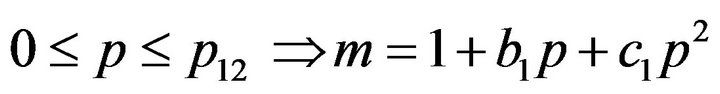 (1)
(1)
for  (2)
(2)
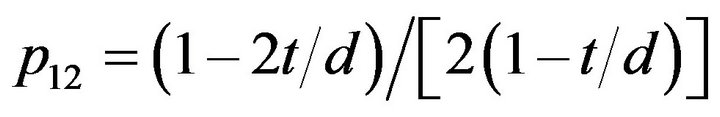
where, m = M/Mp and p = P/Py. Herein, Mp is the plastic moment and Py is the yielding force. On the other hand, the interaction equations are shape dependent and the aforementioned empirical parameters are function of the HSS geometry: wall thickness, t and the overall crosssectional depth, d. Thus, these parameters differ for slender, intermediate and stocky braces. In the aim of computing the empirical parameters p12, b1, c1, a2, and b2, the authors employ the P-M interaction curve defined by the following equations proposed by Pillai [9]. For 0 ≤ p ≤ p12 the parameter m is given in Equation (3) and for p12 ≤ p ≤ 1 in Equation (4). Herein the value of p12 is:
 .
.
 (3)
(3)
(4)
In addition, to adjust the simulated brace response with experimental test results, two magnification factors at and ac applied in tension and compression were embedded in the formulation of Element 05. Hence, a larger factor at means an increase of moment capacity on the tension side, while an increase in ac enlarges the buckling load. As discussed above, the tangent modulus, Et, is a function of axial force, P, and loading history, while the deterioration of Et from cycle to cycle is neglected. It is assumed that the ratio, Et/E = 1 is constant until the specimen buckles or yields for the first time. Meanwhile, Et decreases monotonically as the axial force, P, decreases continuously from maximum tension to the maximum compression value of the hysteresis loop or increases continuously on the reverse loading from maximum compression to tension. To account on these changes of the tangent modulus pattern, two linear idealization curves were proposed [4] as a function of the normalized axial force, p = P/Py, versus the normalized tangent modulus, e = Et/E. Herein, the ascending and descending curves correspond to a continuous decreases, increases of axial load, respectively. However, in this modelling formulation, the deterioration of the tangent modulus, Et, from cycle to cycle is ignored and the empirical parameters e1, e2, e3 and e4, depend on the mechanical properties of steel material, while determining the slope of the hysteresis loops. The formulation of Element 05 is force-based and each zone is divided by the user into a finite number of sections for which the tangent stiffness is assumed to be constant.
To summarize, the behavioural characteristics implemented in the formulation of the nonlinear force-based brace member, Element 05 are: deterioration of the cyclic plastic hinge rotation, accumulation of residual displacement once the material degrades and consideration of material nonlinearity per cycle expressed by Et. However, the hysteresis model with stiffness and strength degradation in compression does not account for: local buckling, Bauschinger effect, the progressive degradation of Et during cycles and the gradual spread of plasticity along the brace length.
3. Hollow Structural Section Brace Model in OpenSees
The hollow structural section brace model consists of nonlinear beam-column elements with distributed plasticity [10] and fiber cross-section formulation. The main limitation of this brace model is the consideration of Euler-Bernoulli beam theory where sections are assumed to remain plane and perpendicular to neutral axis during bending, while distortion is neglected, local buckling is not accounted for and material fracture and crack propagation cannot be simulated. The Giuffre-MenegottoPinto steel material with isotropic strain hardening [10] is assigned to the nonlinear beam-column elements.
The Giuffre-Menegotto-Pinto model is able to account for the accumulated plastic deformation at each point of load reversal and is based on the same concept and equations as the Menegotto-Pinto function [11] where stresses are expressed as a function of strain. Accordingly, the hysteresis loop follows the previous loading path for a new reloading curve, while deformations are cumulated. In the OpenSees brace model, the Giuffre-MenegotoPinto material is assigned to all brace members and the parameters that define the transition from the elastic to plastic response are the same as those used by Aguilero et al. [12]. Thus, for considering the isotropic hardening, the parameters are: R0 = 25, cR1 = 0.925, cR2 = 0.15; a1 = a3 = 0.00001, a2 = a4 = 0.00002, while the kinematic hardening parameter, b, was set to 0.01.
The beam-column element with distributed plasticity can either be force-based or displacement-based. Both formulations allow plastic hinges to form, consider the Bauschinger effect and account for the axial force-bending moment interaction curve, which is incorporated by integrating the uniaxial stress-strain relation for each cross-sectional fiber along the element length. The forcedisplacement relation embedded in the force-based element formulation is established on the basis of local coordinates and the nonlinear beam-column element accounts only for small deformations. However, employing the corotational geometric transformation theory, the basic force-displacement relation is reassigned to the global reference system by considering large displacement geometry. The selected force-based nonlinear beamcolumn element uses the Gauss-Lobatto integration rule for distributed plasticity. For an accurate representation of a linear curvature distribution along the element, at least three integration points are required, while four to six are recommended [13]. In this light, Figure 3 shows a schematic representation of the brace model with ends gusset plates and the assigned fiber discretization technique [14] which is sensitive to the interaction between axial force and bending moment.
To obtain sufficient accuracy for an optimal computational effort, Salawdeh and Goggins [15] recommended using a minimum of 180 fibers in a cross-section. In this light, Uriz, Filippou and Mahin [16] noted that mesh refinement “is not important for the global response of the
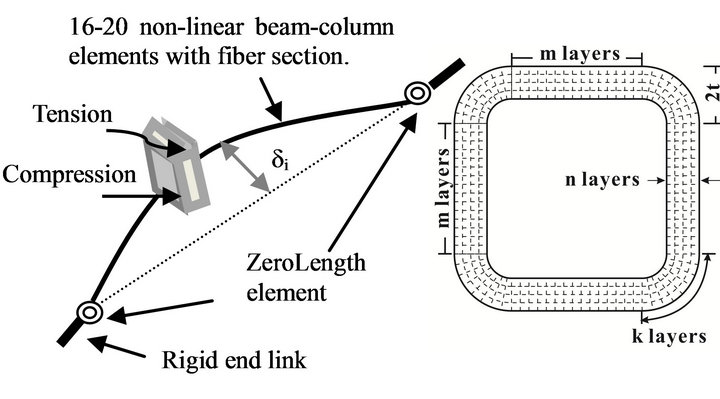
Figure 3. Brace model and fiber cross-section discretization.
brace but it plays a significant role in the determination of the inelastic deformations at the critical brace sections” by capturing the largest curvature values. The initial out-of-straightness assigned to the HSS brace model was L/500, which is in agreement with that recommended by Ziemin [17]. To capture the in-plane or outof-plane deformation of the brace member, the initial out-of-straightness was assigned in both directions.
To simulate the behaviour of the gusset plate connection at each brace end, rotational springs were defined in the zeroLength element that connects each end of the brace member to a rigid link. When the brace buckles in compression, a larger out-of-plane deformation is developed, while plastic hinging may be anticipated in the gusset plates. Such detail induces rotational restraint at brace ends. The out-of-plane flexural stiffness of the gusset plate, Kgusset that is assigned to the rotational springs, is defined by the following equation proposed by Hsiao et al. [18]:
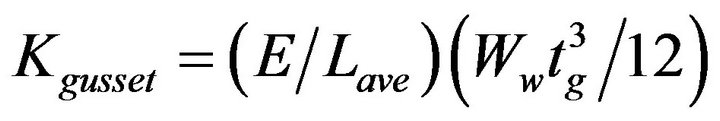 (5)
(5)
where E is the Young’s modulus of steel, Ww is the Whitmore width defined by a 30˚ projection angle, Lave is the average of L1, L2, L3 as shown in Figure 4 and tg is the thickness of the gusset plate. The section modulus of the Whitmore cross-section of the gusset plate is .
.
A second rotational spring, added in the same zeroLength element, defines the in-plane flexural stiffness of the gusset plate that is larger than the brace stiffness. When the out-of-plane buckling is studied, a third spring simulating the torsional restraint of gusset is included and is defined as GJ/Lave, where G is the shear modulus of steel material and J is the torsional constant of the Whitmore cross-section. Therefore, to simulate the threedimensional behaviour of brace member with end gusset plates, three rotational springs were added in the zeroLength element as follows: one rotational spring to account for the out-of-plane flexural stiffenss, computed in conformity with Equation (5), a second one to simulate the in-plane flexural stiffness and the third one to simulate the torsional stiffness of the gusset plate. Both flexural springs are made of Giuffre-Menegoto-Pinto steel
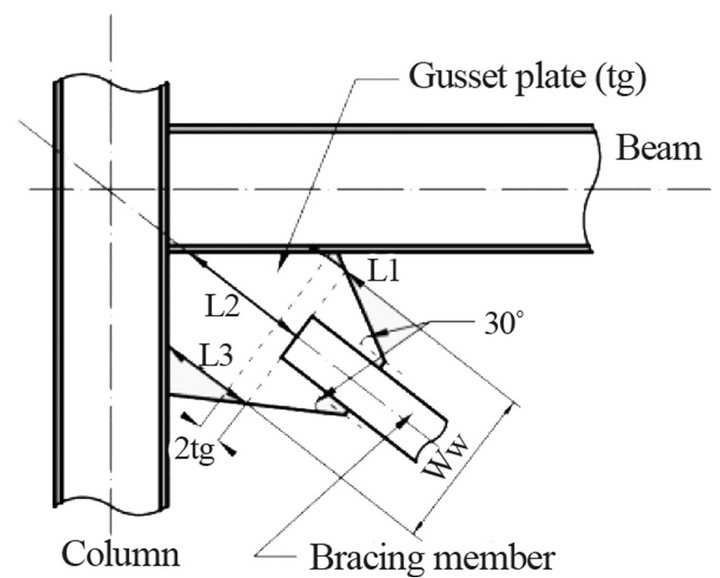
Figure 4. Gusset plate connection.
material, while the torsional spring is made of elastic uniaxial material. As illustrated in Figure 3, both rigid links simulate the remainder of gusset plates, while its length matches the gusset plate’s length obtained from calculation.
The behaviour of brace model that yields in tension and buckles in compression, depends on the following parameters: initial out-of-straightess; the fiber discretization technique and numbers of fibers within the member’s cross-section, nf; the number of elements across the brace length, ne and; the number of integration points per element, ni. In addition, to replicate the failure of the brace member due to low-cycle fatigue, the fatigue material formulated in OpenSees is wrapped to the parental brace’s material. To limit the convergence problem under dynamic loading during the nonlinear stress-strain integration process, finer mesh discretization used in the HSS cross-section is required despite of increasing the computation time.
To quantify the plastic damage accumulated in brace members due to low-cycle fatigue, the Minner’s rule is employed and the damage due to cyclic loading, DI [19] is:
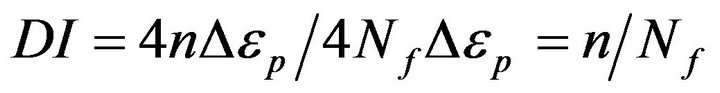 (6)
(6)
whereas, Nf defines the fatigue life in term of the number of cycles of stress or strain that a given brace member may sustain before failure, Δεp is the plastic strain amplitude and n is the current number of cycles. In Equation (6), the numerator expresses the current plastic strain and the denominator denotes the total plastic deformability. However, under seismic loading, strain may not have constant amplitude [20] and damage computed for each contributing cycle of strain, i, is DIi:
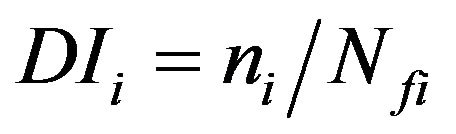 . (7)
. (7)
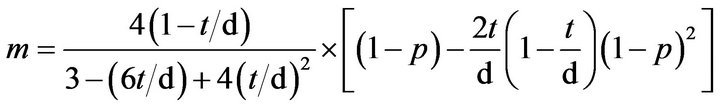
Manson [21] and Coffin [22] independently proposed a low cycle fatigue relationship for ductile metallic materials. They noted that the relationship between the plastic strain amplitude experienced in each cycle, εi, and the number of fatigue cycles to failure, Nf, is linear on the log-log domain of plastic strain amplitude versus the number of cycles to failure with a slope equal to m, as given by:
 (8)
(8)
where m and εo are material constants, known as the fatigue ductility exponent and the fatigue ductility coefficient, respectively. By computing Nf from Equation (8) and replacing it in Equation (7), the damage index DIi may be expressed as:
![]() . (9)
. (9)
In accordance with Minner’s rule, the overall damage due to low cycle fatigue, DI is estimated by the summation of damage of all contributing cycles:
 . (10)
In Equation (10), DI is a parameter that varies from 0 for an undamaged material to 1 at failure and was designnated as representing an accumulated damage index [20]. To monitor when a fiber of the element cross-section has reached its fatigue life and in order to accumulate damage, the traditional rainflow cycle counting method can be applied. Due to the required computational effort, a modified procedure was proposed and implemented in OpenSees by Uriz [6], with the aim to formulate the lowcycle fatigue material. The modified cyclic counting method records only the four most recent peaks of strain reversals at any given time. In this light, when ID > 1, the corresponding fiber in the cross-section has its stress and stiffness reduced to zero. The proposed calibrated material constants for the HSS brace, as reported in study [6] are: m= −0.5 and εo = 0.095. Nonetheless, differences between the required number of hysteresis cycles to failure due to low-cycle fatigue and those resulted from experimental tests were reported [15,23,24,25].
For braces with a slenderness ratio, KL/r between 27 and 85 (r is the radius of gyration), Lignos and Karamanci [24] proposed the following empirical equation in order to estimate the material parameter εo:
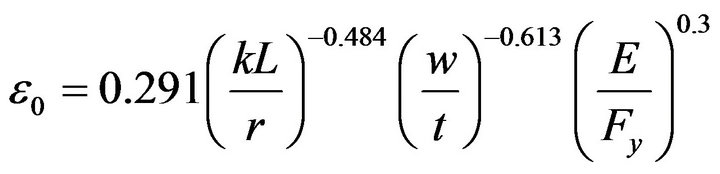 (11)
(11)
where, w/t is the width-to-thickness ratio and Fy and E is the yield strength of braces and Young’s modulus. For defining the low-cycle fatigue material in OpenSees, the ductility coefficient m = −0.3 was treated as constant.
For a wide range of slenderness ratios of square HSS brace cross-sections, 50 < KL/r < 150, Tirca and Chen [25] proposed the following empirical equation in order to predict the εo value, while the ductility coefficient m = −0.5 was considered constant:
 (12)
(12)
where b0/t is the width-to-thickness ratio. According to CAS/S16 standard [1], bo = b − 4t, where b is the HSS width/depth and t the thickness.
Although the local buckling is not considered in the brace model, the hysteresis response of a HSS brace does not seem to be affected during the inelastic cyclic excursions prior failure [19]. After the occurrence of buckling, the strain is cumulated in the plastic hinge during the loading/unloading cycles. When local buckling occurs at the plastic hinge location, fracture is initiated at the corner of HSS brace due to the local and global buckling interaction that produces an increase in strain.
4. Comparisons of Brace Models Response Against Experimental Results
4.1. Experimental Data Selection
The experimental data of quasi-static cyclic testing of full-scale HSS brace members, loaded first in compression, was selected with the aim to validate the numerical models. From literature, specimens of slender and intermediate [26], as well as, stocky braces [27] were selected and their geometrical and mechanical properties are given in Table 1. All selected brace specimens were made from steel G40.21-350W. Data including the test ID, the cross section area, Ag, the yield strength of steel, Fy, and the Young’s modulus of elasticity, E are also given. In addition, the clear length of braces measured between the gusset plates, Lb, the length between the expected hinges in gusset plates, LH, the slenderness ratio KL/r and slenderness parameter, l are provided. According to CSA/S16 standard [1], the slenderness parameter, l, is computed as: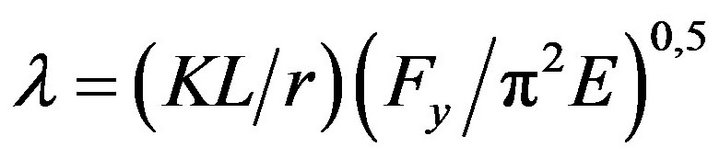 , where r is the radius of gyration. The factored tensile resistance, Tr and compressive resistance, Cr, computed with f =1.0 are: Tr = AgFy and
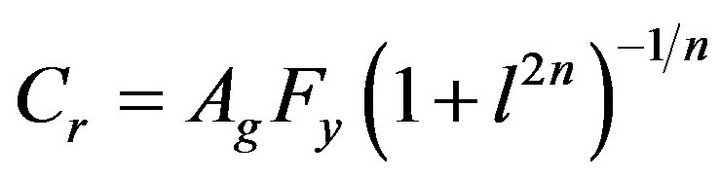 , where n =
1.34. The probable compressive resistance, Cu’ is Cu’ = 0.2AgRyFy, where Ry =1.1 [1].
All selected brace specimens are Class 1 sections. To satisfy this demand, the width-to-thickness ratio limit of b0/t shall be smaller than 420/Fy0.5, where b0 = b − 4t, b and t are HSS dimensions. When CBFs are located
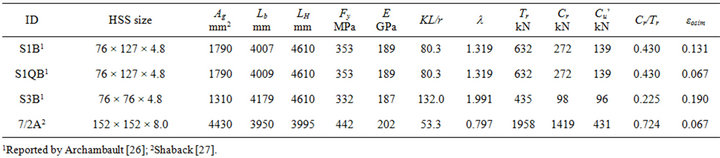
Table 1. Selected test data and brace charactersitics.
in seismic zones, most severe b0/t limit of 330/ Fy0.5 is required for braces with KL/r ≤ 100. For braces with KL/r between 100 and 200, linear interpolation between 330/ and 420/
 should be used [1]. The b0/t ratio of the selected brace members varies from 11.83 for specimens S1B, S1QB and S3B to 15.0 for the specimen 2A. The normalized b0/t ratio with respect to b0/t limit is 0.67 for S1B and S1QB (in-plan buckling), 0.65 for S3B and 0.95 for 2A. The three selected specimens from the ID1 study [2] have been tested in single bracing frame configuration as pinended members, while the 2A specimen was tested as an independent pinended member [4]. The effective slenderness ratio, KL/r, of braces was evaluated in the buckling plan, while taking into account the applicable end conditions. It was reported that all braces shown in Table 1 have buckled out-of-plane. Among the three selected braces from study 1 [26], the S1B and S3B specimens were tested under cyclic quasi-static displacement protocol H1, illustrated in Figures 5(a) and (b), respectively, while the third specimen S1QB was tested under the displacement protocol Q shown in Figure 5(c) [24]. The cyclic quasi-static displacement loading sequence H1 has a symmetrical displacement pattern with stepwise increasing deformation cycles. Each step has included two identical cycles and the increment in peak deformation between successive steps was set to 0.67 times the interstory drift at yield. The Q sequence is a displacement history developed based on the results of nonlinear dynamic time-history analyses performed on typical two and three storey buildings subjected to several ground motions.
The 2A brace specimen [27] is a stocky brace that was first loaded in compression under the asymmetric cyclic quasi-static displacement protocol, H2, shown in Figure 5(d). The yield strength, Fy, of the selected brace was obtained using the 0.2% offset method from stub-column testing of sample bracing member.
All selected specimens have developed a plastic hinge at the member mid-length and in all selected experimental tests, local buckling followed by fracture in the next cycle was observed [28,29]. Meanwhile, slender braces dissipate lower amount of energy in compression than stocky braces [30].
4.2. Analytical Brace Response Using Drain 2DX
The hysteresis loops obtained under the quasi-static displacement loading depicted in Figure 5, are shown for all selected brace specimens in Figure 6. The Drain 2DX model was developed to replicate the test setup [26,27].
During cycles following buckling, the model does not provide an accurate strength at the location where the elastic shortening zone in compression ES1 connects the plastic zone in compression P1. This transition can be corrected if the model would be able to consider the effect of distributed plasticity across the brace length. In the formulation of Element 05, the post-buckling load is a function of the tangent modulus and the residual plastic hinge rotation angle. However, the post-buckling load will be the same after brace experiences tensile yielding
 (a)
(a) (b)
(b)
Figure 5. Loading protocols: (a) type H1, (S1B); (b) type H1, (S3B); (c) type Q, (S1QB); type H2, (2A).
 (a)
(a) (b)
(b)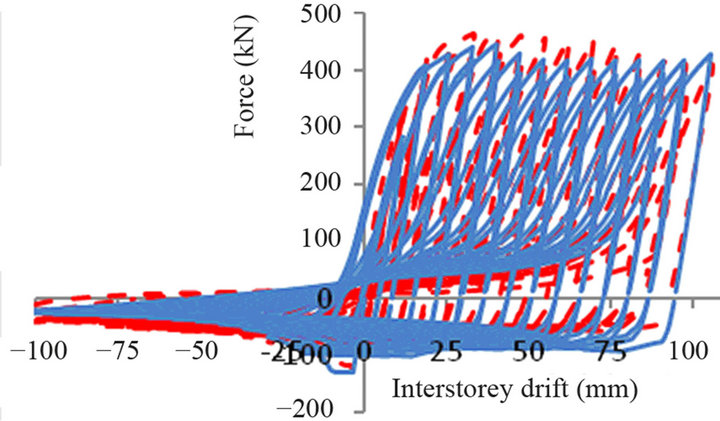 (c)
(c) (d)
(d)
Figure 6. Drain 2DX braces response vs. experimental hysteresis loops: (a) S1B; (b) S1QB; (c) S3B, (d) 2A.
because the tangent modulus history is unchanged during cyclic loading/unloading and the residual plastic hinge rotation angle is also the same every time the axial load reaches the yield load.
For the slender specimen S3B, the numerical results in the plastic zone in tension, P2, underestimate the slopes of the force displacement curves and fail to reach the tensile axial strength. This limitation can be solved with the implementation of the Bauschinger effect which accounts for the effects of strain hardening and softening. As illustrated in Figure 6(c), the specimen S3B dissipates a larger amount of energy in tension than in compression. In this case, the tension side of HSS cross-section at the plastic hinge location experienced larger cumulative tensile strain because of the relatively lower level of buckling load in compression. In a slender member, this larger cumulative tensile strain implies more severe deterioration of Et that causes the pinched hysteresis curves in tension. For cases where yielding zones were observed during experimental tests, a strain hardening factor was introduced in the analytical model. The same value (1.2) as that proposed by Ikeda and Mahin [4] was considered for the constant β. Herein, β defines the plastic hinge rotation degradation in the elastic elongation zone in tension.
4.3. Analytical Brace Response Using OpenSees
In this study, each brace is modelled with 20 non-linear beam-column elements with spread plasticity and four integration points per element, nf = 500 fibers within the HSS cross-section and the fiber discretization technique as per Figure 3. An out-of-straightness value of L/500 was considered in both possible brace deflection directions: in-plane and out-of-plane. To simulate the gusset plate behaviour, two rotational and one torsional spring were assigned at each brace end in the zeroLength element. The Giuffre-Menegoto-Pinto steel material with 1% strain hardening was assigned to S1B, S3B and 2A brace specimens, while the 5% strain hardening was applied to S1QB.
In the OpenSees brace model, fatigue material was defined using m = −0.5 and εopred as per Equation (12), whereas εopred indicates the strain amplitude at which one complete cycle will cause failure. The simulated strain amplitude, εosim that matches the experimental test (brace model and specimen reached failure during the same loading cycle) is given for all specimens in Table 1.
The stocky brace 2A was subjected to asymmetric loading consisted of larger amplitudes in compression, as per Figure 5(d). As illustrated in Figure 7(a), by using the proposed fatigue material parameters, both the simulated model and experimental test reach tensile fracture failure in the same cycle. As resulted, both values εopred and εosim are equal and the model is able to exhibit the
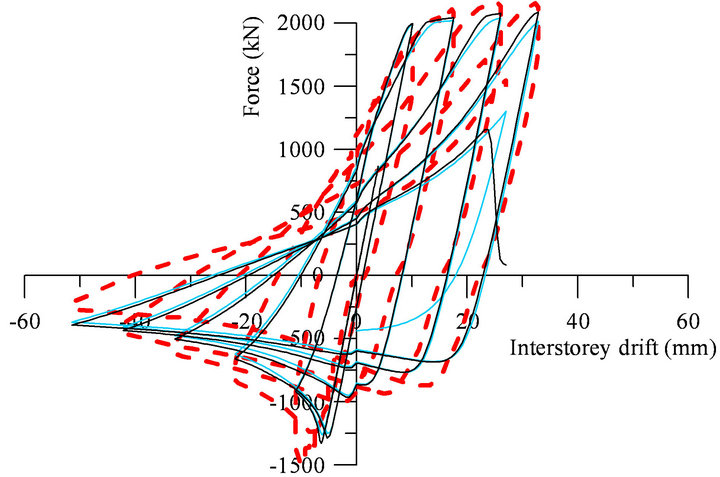 (a)
(a) (b)
(b) (c)
(c)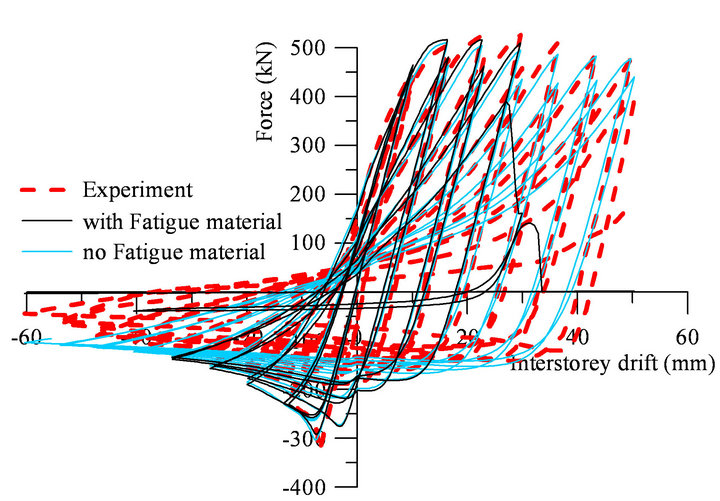 (d)
(d)
Figure 7. The OpenSees model with and without fatigue material versus test results: (a) 2A, (b) S3B, (c) S1QB, (d) S1B.
same number of cycles prior failure as the experimental test.
The slender brace S3B was subjected to a smooth symmetric quasi-static loading illustrated in Figure 5(b). When the εopred computed with Equation (12) was applied, the model reached failure one cycle before the experimental test and the ratio is: εosim/εopred = 1.1. The hysteresis response of the OpenSees model simulating the S3B brace is illustrated in Figure 7(b).
To summarize, the demanded strain parameter at which one complete cycle causes failure is larger for slender brace than for stocky braces and the predicted strain amplitude at which one complete cycle causes failure is accurate.
To highlight the effect of loading on the brace response, the specimens S1B and S1QB were selected, despite the rectangular cross-section of HSS brace. The specimen S1B was subjected to a symmetrical displacement loading pattern with stepwise increasing deformation cycles, H1, and S1QB to symmetric loading with large displacement amplitude cycles (type Q) as illustrated in Figures 5(a) and (c). As per Equation (12), the value εopred = 0.075 is the same for both specimens. However, Equation (12) was developed for square HSS braces. When the S1QB brace is replicated, the physical test reaches failure one cycle prior to the simulated model and the ratio is: εosim/εopred = 0.89. When the S1B brace is replicated, the simulated test reaches failure prior to the physical test as illustrated in Figure 7(d) and the ratio between εosim and εopred is 1.74. Therefore, the type of applied loading history has a strong effect on the brace response, especially in the development of compressive strain history over the duration of applied cyclic loading [25].
Thus, using smaller εo value than required it may provide a conservative response (the model fails before the physical test), while using a larger value, the model dissipates larger amount of energy than the physical test. For all selected brace specimens, the force-displacement hysteresis loops with and without the consideration of fatigue material are illustrated in Figure 7.
As showed in Figures 6 and 7, both Drain 2DX and OpenSees models are able to capture the buckling force in compression and yielding force in tension, as well as the maximum lateral displacement within each cycle. Because the selected specimens S1B, S1QB and S3B were tested in a frame, the interstorey drift is equal to the frame lateral displacement. However, in comparison with the OpenSees model, the Drain 2DX model is not able to simulate the deformation of brace at its mid-length when the out-of-plane buckling occurred.
5. Case Study
To investigate the seismic response of CBFs with zipper bracing configuration (Z-CBF), a 4-storey commercial building located on a firm soil (Site class C) in Victoria, BC was selected. The plan view and the elevation model are illustrated in Figure 8.
For simplicity, the accidental torsion and P-delta effect were neglected. As illustrated in Figure 8, there are two identical Z-CBFs in the north-south and two Z-CBFs in the east-west direction. The purpose of adding zipper columns to the CBF system with chevron bracing con-
 (a)
(a) (b)
(b)
Figure 8. Building plan view and elevation.
figuration was to mitigate the formation of storey mechanism by involving several braces to yield in tension and buckle in compression, while zipper and CBF column members behave elastically.
The design method of the Z-CBF system is given elsewhere [31]. In this example, the Z-CBF located in the north-south direction is considered for investigation and was designed to carry a base shear force of 2127 kN. The period of the building in the first two modes, as resulted from Drain 2DX and OpenSees, is T1 = 0.7 s and T2 = 0.27. In both cases, a 3% mass and stiffness proportional damping was considered.
For Victoria (western Canada), moderate to large crustal earthquakes of magnitude M6.5 to M7.5 were considered as contributors to hazard evaluation at intermediate-to-high frequencies. The selected crustal ensemble [31] was composed of 7 historical ground motions recorded from earthquakes in western North America. To match the uniform hazard spectrum (UHS) for Victor, as per the NBCC 2010 requirements [32], all records were scaled. Herein, the scaling procedure is in agreement with ASCE/SEI-07 [33]. As illustrated in Figure 9, the mean of the 5% damped response spectra of the 7 scaled ground motions matches or is above the UHS in any point over the periods of interest 0.2T1 to 1.5T1.
Member sizes resulted for the 4-storey CBF system with zipper bracing configuration [31] are given in Table 2. Herein, square structural sections were selected for braces and zipper columns, while W-shape sections were used for beams and columns. The analytical model of the
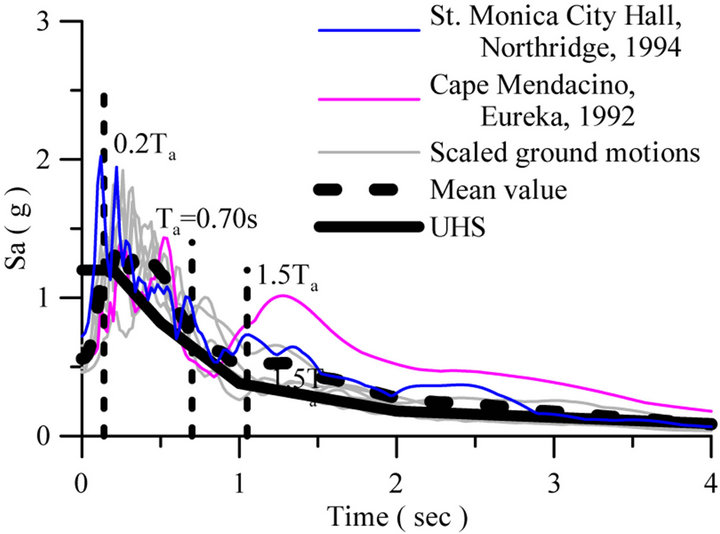
Figure 9. The UHS versus the mean of scaled acceleration response spectra.
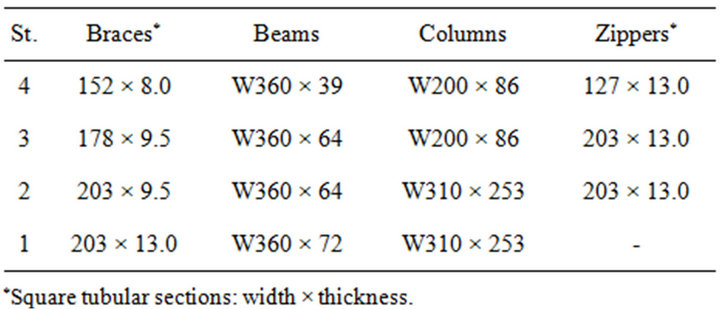
Table 2. Members size.
CBF frame structure developed in Drain 2DX is explained elsewhere [31]. In the OpenSees model, braces are made of 20 non-linear beam-column elements with spread plasticity and 4 integration points per element, the fiber discretization technique shown in Figure 3 was employed and 500 fibers were considered within the HSS cross-section. Steel02 material was assigned to braces, zipper columns, beams and Z-CBF columns. Both braces and zipper columns have fiber cross-sections and an outof-straightness of 1/500 of the member length was applied in both potential deflection directions. In general, HSS brace members buckle out-of-plane. To simulate the gusset plate connection, three rotational springs, as explained above, were added in the zeroLength element, which connects the brace member with the rigid link. Beams and Z-CBF columns were modelled with the nonlinear beam-column elements using the beam with hinges object. For gravity columns, elastic elements were used. The slenderness ratio of the HSS brace members that is illustrated in Table 2 varies between 82 for the top brace and 62 for the ground floor brace.
In this light, the seismic response of the 4-storey building subjected to the M7 Cape Mendacino earthquake (1992) recorded at the Eureka station, and the M6.7 Northridge earthquake (1994) recorded at St. Monica City Hall, shows that brace buckling initiated at the base and it progressed upward almost simultaneously, as illustrated in Figure 10(b). Thus, when building is driven by ground motions with large amplitude cycles, the fullheight zipper mechanism is formed. In this light, all half-span braces reached buckling within one second (t = 5.59 s and t = 5.65 s) and all beams exhibited hinging between t = 13.00 s and t = 13.20 s. The history of brace buckling and beam hinging showed in Figure 10 was obtained using OpenSees, while the deflected shape is that resulted at the end of applied ground motions. A similar behavior was obtained using Drain 2DX.
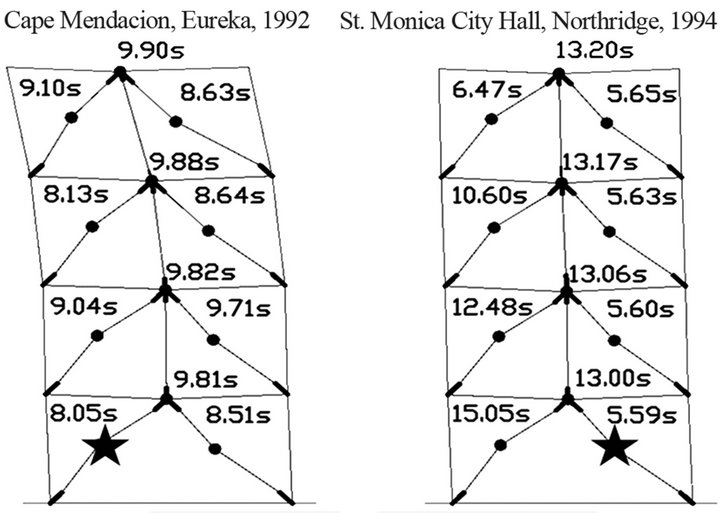
Figure 10. Seismic response of a 4-storey building (★the first buckling brace; ●subsequent brace buckling and beam hinging) under: (a) Eureka; (b) St. Monica.
The roof displacement under Eureka record is showed in Figure 11 together with the ground motion accelerogram. As illustrated, both Drain 2DX and OpenSees show a maximum interstorey drift at t = 10 s after all braces buckled and beams formed plastic hinges. After the occurrence of brace buckling and beams hinging at t = 10 s, the OpenSees model shows a more robust response than Drain 2DX.
As illustrated, at the design level, braces did not experience tensile fracture. Although the recorded interstorey drift of 3%hs is larger than the code limit (2.5%hs), the statistical distribution of 84 percentile is lower than 2.5%hs. However, in term of residual deformations, Drain-2DX provides larger deformations than OpenSees. The hysteresis response of the top floor brace is showed in Figure 12 and it can be seen that both programs showed a good match of the buckling and postbuckling force, as well as the horizontal deformation.
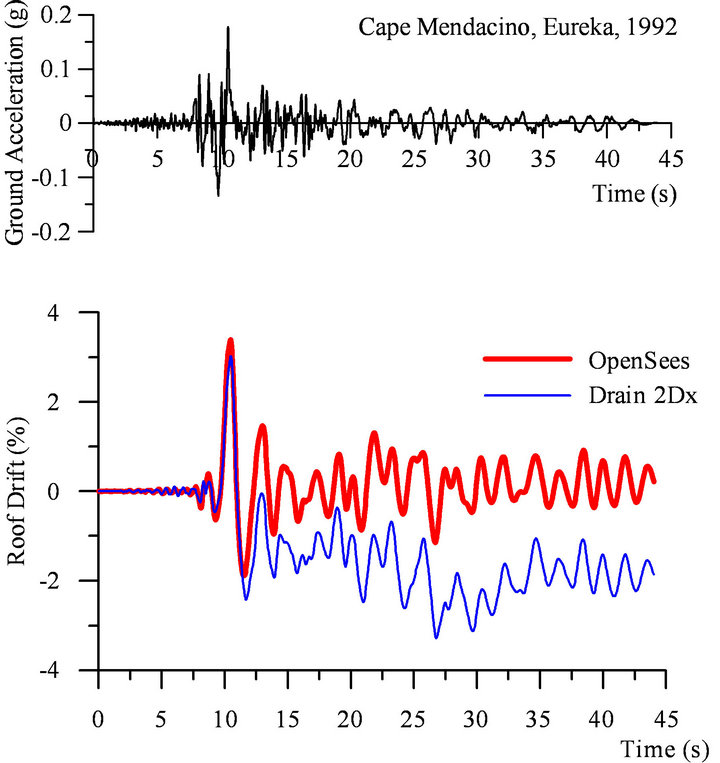
Figure 11. Eureka accelerogram and roof interstorey drift time-history response.

Figure 12. Hysteresis response of the top floor brace under Eureka record.
The roof interstorey drift time-history of the 4-storey building subjected to Northridge (St. Monica) record is illustrated in Figure 13 together with the ground motion accelerogram. As illustrated, the maximum value of interstorey drift is obtained around t = 13 s when beams start hinging after braces exhibited buckling and yielding. Upon t = 14 s, Drain 2DX and OpenSees model illustrate the same response. However, after that, the seismic response obtained in Drain 2DX becomes slightly unstable due to the highly nonlinear demand.
After the occurrence of peak ground acceleration, OpenSees shows a 0.2hs% residual interstorey drift demand versus the 0.4hs% provided by Drain 2DX. The top floor brace response is illustrated in Figure 14. As illustrated, both OpenSees and Drain 2DX model show the same buckling force and post-buckling behaviour, while the horizontal deformation demand is about half than that resulted under Eureka ground motion.
To capture the behavior of system at failure, the model was subjected to Eureka record after the scaled accelero-
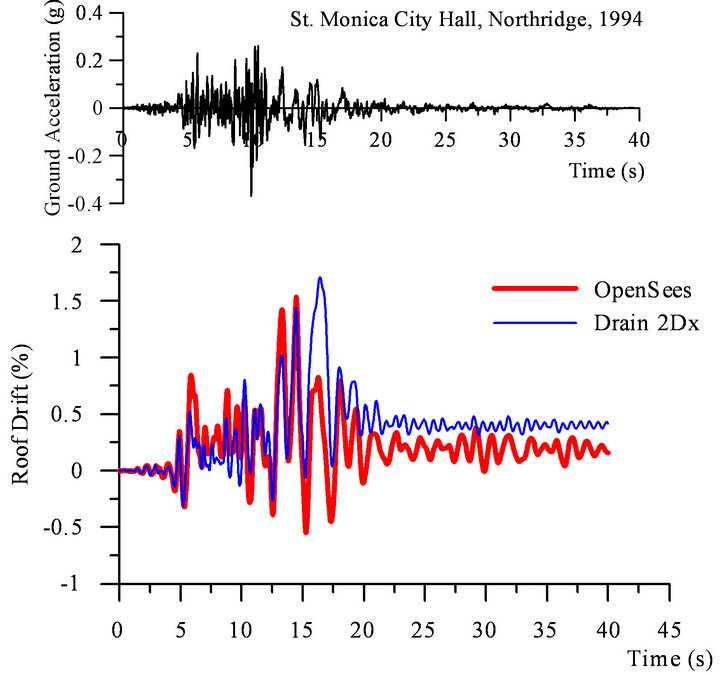
Figure 13. St. Monica accelerogram and roof interstoreydrift time-history response.
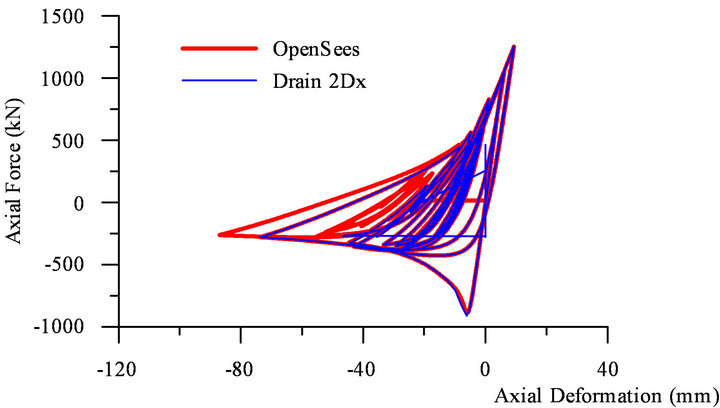
Figure 14. Hysteresis response of the top floor brace under St. Monica record.
gram was amplified by a factor of two. As illustrated in Figure 15, at t = 10 s, the Drain 2DX model shows system failure, while the OpenSees model shows large residual roof deformation that occurred after the left-side braces of the bottom three floor levels experienced tensile fracture.
6. Conclusions
The objective of this paper was to assess the accuracy of brace member behaviour under cyclic loading using Drain 2DX and OpenSees models against experimental test results. Both Drain 2DX and OpenSees software rely on the physical theory brace model. For comparison purpose, four pinned-ends slender, intermediate, and stocky HSS braces subjected to symmetric and asymmetric displacement history with stepwise incremented amplitudes were selected. All selected brace specimens were first loaded in compression.
The refined physical-theory brace model implemented in Drain 2DX is based on parameters that map the P-M interaction curve and on a set of two linear empirical curves that incorporate material nonlinearity through the embedded tangent modulus of elasticity, Et.. In general, the refined model is able to simulate the cyclic inelastic behaviour of HSS braces with sufficient accuracy when peak forces and global axial deformations are recorded. However, the two-dimensional Drain 2DX brace model cannot display the out-of-plane buckling.
In the OpenSees environment, the inelastic brace response was modelled by using the nonlinear beam-column element with spread plasticity and fiber cross-section formulation that considered the discretization technique with rounded fibers embedded in the HSS crosssectional corners. For an accurate representation of a linear curvature distribution along the element, four integration points per element were considered. An out-ofstraightness parameter of L/500 was found to give accurate results for the HSS brace model. The number of fibers and type of discretization technique are sensitive
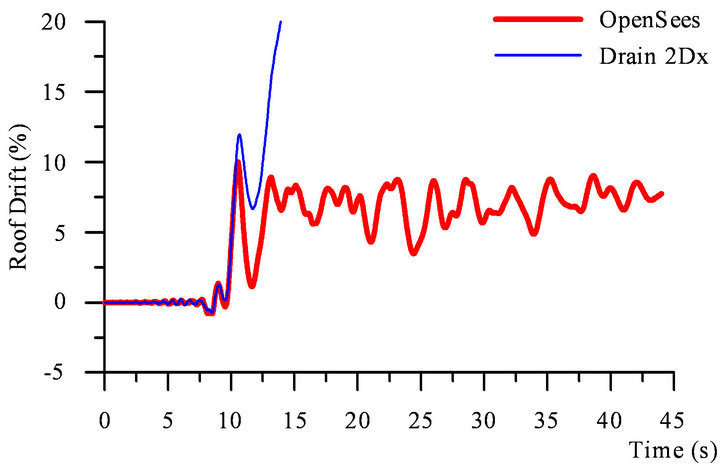
Figure 15. Interstorey drift time-history under amplified Eureka record.
parameters that may produce disturbance in the forcedisplacement hysteresis loops. In this study, a finer meshing discretization was used (500 fibers within the brace cross-section) in order to improve the chance of convergence despite of increasing the computation time. The Giuffre-Menegotto-Pinto steel material was assigned to simulate the brace response.
To simulate the brace failure due to low-cycle fatigue, the fatigue material implemented in OpenSees was wrapped to the parental Giuffre-Menegotto-Pinto steel material and twenty nonlinear beam-column elements with spread plasticity were considered. The fatigue material parameter εo depends on brace slenderness ratio, width-to-thickness ratio and steel material properties. To predict the εo value, two empirical equations given in literature are recommended. In general, when smaller εo value than required is considered, the brace displays a conservative response (the model fails before the physiccal test), while by using a larger value, the model will dissipate more energy than the physical test.
When the seismic response of the 4-storey building with zipper bracing configuration is investigated under ground motions scaled to match the UHS predicted for Victoria, BC, both Drain 2DX and OpenSees models are reliable. However, the OpenSees model showed a more robust response than Drain 2DX model that becomes unstable when the demand is highly nonlinear.
7. Acknowledgements
The authors would like to thank Professors Robert Tremblay and Tom Brown for providing experimental test results.
REFERENCES
- CAN/CSA-S16-09, “Limit States Design of Steel Structures,” Canadian Standard Association, Rexdale, 2009.
- V. Prakash, G. H. Powell and S. D. Campbell, “Drain- 2DX Base Program Description and User Guide,” UCB/SEMM-1993, University of California, Berkeley, 1993.
- F. McKenna, “Object Oriented Finite Element Analysis: Frameworks for Analysis Algorithms and Parallel Computing,” Ph.D. Thesis, University of California, Berkeley, 1997.
- K. Ikeda and S. Mahin, “A Refined Physical Theory Model for Predicting the Seismic Behaviour of Braced Steel Frames,” Earthquake Engineering Research Center, University of California, Berkeley, 1984, Report No. UCB/EERC-84/12.
- P. Taddei, “Implementation of the Refined Theory Model of Braced Steel Frames in NONSPEC and Drain 2DX,” University of Ottawa, Canada, 1995.
- P. Uriz, “Towards Earthquake Resistant Design of Concentrically Braced Steel Buildings,” Ph.D. Dissertation, University of California, Berkeley, 2005.
- Y. Huang and S. Mahin, “Simulating the Inelastic Seismic Behaviour of Steel Braced Frames Including the Effects of Low-Cycle Fatigue,” Pacific Earthquake Eng. Research Center, Barkeley, 2010, Report No. 104.
- B. Fell, A. Kanvinde and G. Deierlein, “Large-Scale Testing and Simulation of Earthquake Induced Ultra Low Cycle Fatigue in Bracing Members Subjected to Cyclic Inelastic Buckling,” Stanford University, Stanford, 2010, Report No. 172.
- S. Pillai, “Beam-Columns of Hollow Structural Sections,” Canadian Journal of Civil Engineering, Vol. 1, No. 2, 1974, pp. 194-198. doi:10.1139/l74-018
- S. Mazzoni, F. McKenna, M. Scott, G. Fenves, et al., “OpenSees User Manual,” 2007.
- M. Menegotto and P. E. Pinto, “Method of Analysis for Cyclic Loaded R. C. Plane Frame Including Changes in Geometry and Non-Elastic Behaviour of Elements under Combined Normal Force and Bending,” Proceedings of IABSE Symposium on Resistance and Ultimate Deformability of Structures Acted On by Well Defined Repeated Loads, Vol. 11, 1973, pp. 15-22.
- A. Aguero, C. Izvernari and R. Tremblay, “Modelling of the Seismic Response of Concentrically Braced Steel Frames Using the OpenSees Analysis Environment,” International Journal of Advanced Steel Construction, Vol. 2, No. 3, 2006, pp. 242-274.
- M. H. Scot and G. L. Fenves, “Plastic Hinge Integration methods for Force-Based Beam-Column Elements,” Journal of Structural Engineering, Vol. 132, No. 2, 2006, pp. 244-252. doi:10.1061/(ASCE)0733-9445(2006)132:2(244)
- R. Tremblay, “Influence of Brace Slenderness on the Fracture Life of Rectangular Tubular Steel Bracing Members Subjected to Seismic Inelastic Loading,” Proceeings of ASCE Structures Congress, Vancouver, 2008.
- S. Salawdeh and J. Goggins, “Numerical Simulation for Steel Brace Members Incorporating a Fatigue Model,” Engineering Structures, Vol. 46, 2013, pp. 332-349. doi:10.1016/j.engstruct.2012.07.036
- P. Uriz, F. C. Filippou and S. Mahin, “Model for Cyclic Inelastic Buckling of Steel Braces,” ASCE Journal of Structural Engineering, Vol. 134, No. 4, 2008, pp. 619- 628. doi:10.1061/(ASCE)0733-9445(2008)134:4(619)
- R. Ziemian, “Guide to Stability Design Criteria for Metal Structures,” John Wiley & Sons, Hoboken, 2010. doi:10.1002/9780470549087
- P. C. Hsiao, D. Lehman and C. Roeder, “Improved Analytical Model for Special Concentrically Braced Frames,” Journal of Constructional Steel Research, Vol. 73, 2012, pp. 80-94. doi:10.1016/j.jcsr.2012.01.010
- L. Xue, “A Unified Expression for Low Cycle Fatigue and Extremely Low Cycle Fatigue and its Implication for Monotonic Loading,” International Journal of Fatigue, Vol. 30, No. 10-11, 2008, pp. 1691-1698. doi:10.1016/j.ijfatigue.2008.03.004
- P. Uriz and S. Mahin, “Toward Earthquake Resistant Design of Concentrically Braced Steel Frame Structures,” PEER Report 2008/08.
- S. S. Manson and M. H. Hirschberg, “Fatigue Behavior in Strain Cycling in the Lowand Intermediate-Cycle Range,” The 10th Sagamore Army Research Conference: Fatigue—An Interdisciplinary Approach, New York, 1963, pp. 13-16.
- L. F. Coffin Jr., “Low Cycle Fatigue—A Review,” Applied Material Research, Vol. 1, No. 3, 1962, pp. 129- 141.
- S. Santagati, D. Bolognini and R. Nascimbene, “Strain Life Analysis at Low-Cycle Fatigue on Concentrically Braced Steel Structures with RHS Shape Braces,” Journal of Earthquake Enineering, Vol. 16, No. S1, 2012, pp. 107-137. doi:10.1080/13632469.2012.675840
- D. Lignos and E. Karamanci, “Predictive Equations for Modelling Cyclic Buckling and Fracture of Steel Braces,” The 10th International Conference on Urban Earthquake Engineering, Tokyo, 1-2 March 2013, 2013, pp. 5-107.
- L. Tirca and L. Chen, “Numerical Simulation of Hollow Structural Steel Braces Upon Fracture,” Journal of Advanced Steel Construction (under review).
- M. H. Archambault, “Etude du Comportement Seismique des Contreventements Ductile en X Avec Profiles Tubulaires en Acier,” Ecole Polytechnique, Montreal, 1995, Rapport No. EPM/GCS-1995-09.
- B. Shaback, “Behaviour of Square HSS Braces with End Connections under Reversed Cyclic Axial Loading,” Master’s Thesis, University of Calgary, Calgary, 2001.
- R. Tremblay, “Inelastic Seismic Response of Steel Bracing Members,” Journal of Constructional Steel Research, Vol. 58, No. 5-8, 2002, pp. 665-701. doi:10.1016/S0143-974X(01)00104-3
- B. Shaback and T. Brown, “Behaviour of Square Hollow Structural Steel Braces with end Connections under Reversed Cyclic Axial Loading,” Canadian Journal of Civil Engineering, Vol. 30, No. 4, 2003, pp. 745-753. doi:10.1139/l03-028
- K. Lee and M. Bruneau, “Energy Dissipation of Compression Members in Concentrically Braced Frames: Review of Experimental Data,” Journal of Structural Engineering, ASCE, Vol. 131, No. 4, 2005, pp. 552-559. doi:10.1061/(ASCE)0733-9445(2005)131:4(552)
- L. Tirca and L. Chen, “The Influence of Lateral Load Patterns on the Seismic Design of Zipper Braced Frames,” Engineering Structures Journal. Vol. 40, 2012, pp. 536-555. doi:10.1016/j.engstruct.2012.03.017
- National Research Council of Canada, “National Building Code of Canada—Part 4,” NBCC 2010, Ottawa, 2010.
- American Society of Civil Engineers (ASCE), “Minimum Design Loads for Buildings and Other Structures,” ASCE/SEI 7-05, Reston.